| Multiple Linear Regression - Estimated Regression Equation |
| Ipzb[t] = + 37.9750577712368 + 0.35752597917971Cvn[t] -0.0972246665009244Y1[t] + 0.210673223544915Y2[t] + 0.471709841600752Y3[t] -0.130871652430054Y4[t] + 1.65159776730035M1[t] + 4.63924252137943M2[t] + 14.9692992911281M3[t] + 8.32260636552639M4[t] + 5.13879831352945M5[t] + 10.5730267079814M6[t] -0.424942244137813M7[t] -3.60594526919893M8[t] + 11.3518116431457M9[t] + 23.6135067770042M10[t] + 12.5920852084701M11[t] + 0.0661072462522717t + e[t] |
| Multiple Linear Regression - Ordinary Least Squares | |||||
| Variable | Parameter | S.D. | T-STAT H0: parameter = 0 | 2-tail p-value | 1-tail p-value |
| (Intercept) | 37.9750577712368 | 13.723465 | 2.7672 | 0.008687 | 0.004343 |
| Cvn | 0.35752597917971 | 0.08781 | 4.0716 | 0.000228 | 0.000114 |
| Y1 | -0.0972246665009244 | 0.164693 | -0.5903 | 0.558458 | 0.279229 |
| Y2 | 0.210673223544915 | 0.128717 | 1.6367 | 0.109947 | 0.054973 |
| Y3 | 0.471709841600752 | 0.118607 | 3.9771 | 0.000302 | 0.000151 |
| Y4 | -0.130871652430054 | 0.148908 | -0.8789 | 0.384992 | 0.192496 |
| M1 | 1.65159776730035 | 3.926173 | 0.4207 | 0.67637 | 0.338185 |
| M2 | 4.63924252137943 | 4.309825 | 1.0764 | 0.28852 | 0.14426 |
| M3 | 14.9692992911281 | 3.838041 | 3.9002 | 0.000379 | 0.00019 |
| M4 | 8.32260636552639 | 3.121846 | 2.6659 | 0.011212 | 0.005606 |
| M5 | 5.13879831352945 | 2.935581 | 1.7505 | 0.088099 | 0.04405 |
| M6 | 10.5730267079814 | 3.226022 | 3.2774 | 0.002244 | 0.001122 |
| M7 | -0.424942244137813 | 3.682638 | -0.1154 | 0.908743 | 0.454372 |
| M8 | -3.60594526919893 | 3.749797 | -0.9616 | 0.342311 | 0.171156 |
| M9 | 11.3518116431457 | 4.799498 | 2.3652 | 0.023227 | 0.011614 |
| M10 | 23.6135067770042 | 4.66452 | 5.0624 | 1.1e-05 | 5e-06 |
| M11 | 12.5920852084701 | 3.195118 | 3.941 | 0.000336 | 0.000168 |
| t | 0.0661072462522717 | 0.038151 | 1.7328 | 0.091241 | 0.045621 |
| Multiple Linear Regression - Regression Statistics | |
| Multiple R | 0.951169221640086 |
| R-squared | 0.904722888195407 |
| Adjusted R-squared | 0.862098917124931 |
| F-TEST (value) | 21.2256827666176 |
| F-TEST (DF numerator) | 17 |
| F-TEST (DF denominator) | 38 |
| p-value | 2.39808173319034e-14 |
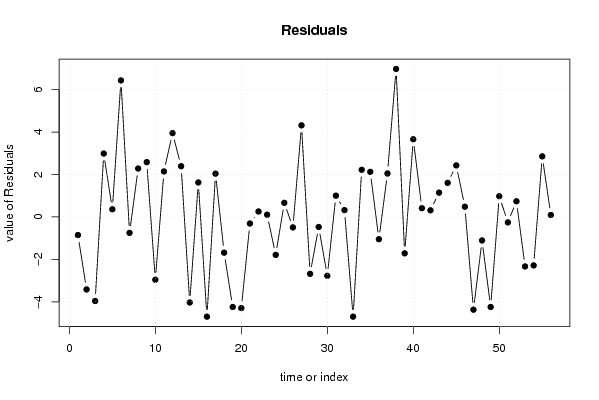
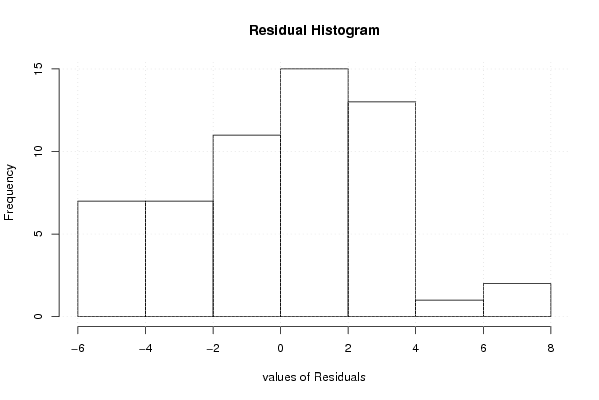
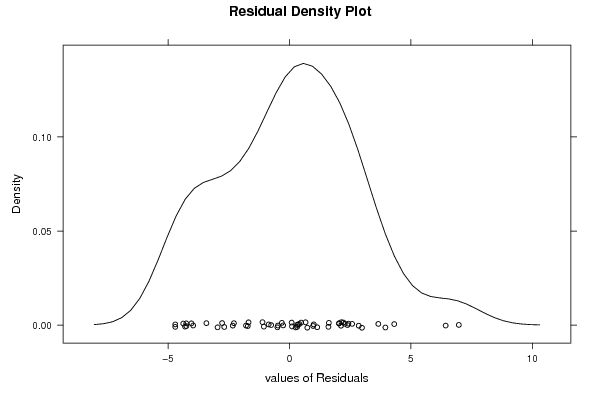
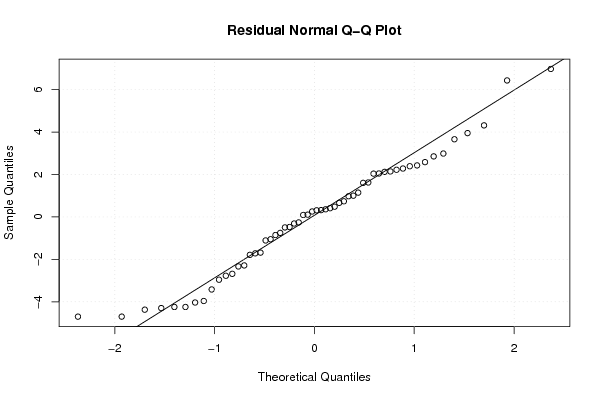
| Multiple Linear Regression - Residual Statistics | |
| Residual Standard Deviation | 3.32446883465033 |
| Sum Squared Residuals | 419.97953523733 |
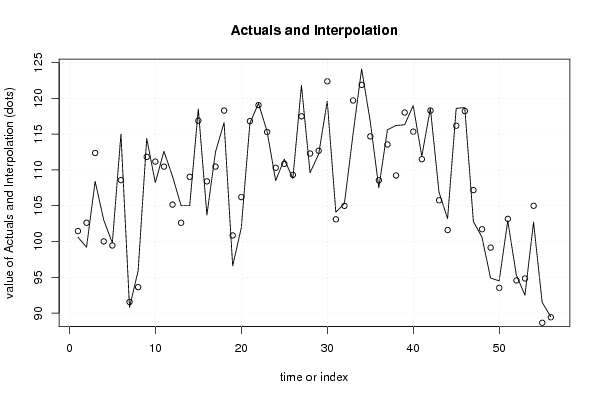
| Multiple Linear Regression - Actuals, Interpolation, and Residuals | |||
| Time or Index | Actuals | Interpolation Forecast | Residuals Prediction Error |
| 1 | 100.6 | 101.454724478577 | -0.85472447857655 |
| 2 | 99.2 | 102.619299065306 | -3.41929906530648 |
| 3 | 108.4 | 112.363385948680 | -3.96338594868014 |
| 4 | 103 | 100.012580576357 | 2.98741942364329 |
| 5 | 99.8 | 99.4411007951306 | 0.358899204869372 |
| 6 | 115 | 108.566365621788 | 6.43363437821166 |
| 7 | 90.8 | 91.5525193331732 | -0.752519333173178 |
| 8 | 95.9 | 93.618960086585 | 2.28103991341506 |
| 9 | 114.4 | 111.817301047641 | 2.58269895235922 |
| 10 | 108.2 | 111.160336387264 | -2.96033638726361 |
| 11 | 112.6 | 110.456846803429 | 2.14315319657057 |
| 12 | 109.1 | 105.149907912799 | 3.950092087201 |
| 13 | 105 | 102.610371865232 | 2.38962813476804 |
| 14 | 105 | 109.034626016033 | -4.03462601603286 |
| 15 | 118.5 | 116.876499067974 | 1.62350093202566 |
| 16 | 103.7 | 108.401235771754 | -4.70123577175384 |
| 17 | 112.5 | 110.460648302222 | 2.03935169777787 |
| 18 | 116.6 | 118.284020835028 | -1.68402083502772 |
| 19 | 96.6 | 100.845946554401 | -4.24594655440072 |
| 20 | 101.9 | 106.198220209180 | -4.29822020918026 |
| 21 | 116.5 | 116.810885200669 | -0.310885200668901 |
| 22 | 119.3 | 119.043767917266 | 0.256232082734123 |
| 23 | 115.4 | 115.294496843263 | 0.105503156737186 |
| 24 | 108.5 | 110.288450014996 | -1.78845001499580 |
| 25 | 111.5 | 110.836409911567 | 0.663590088432707 |
| 26 | 108.8 | 109.295186898365 | -0.495186898365405 |
| 27 | 121.8 | 117.483952742806 | 4.31604725719414 |
| 28 | 109.6 | 112.282587569892 | -2.68258756989208 |
| 29 | 112.2 | 112.674888999059 | -0.474888999059369 |
| 30 | 119.6 | 122.374097550754 | -2.77409755075375 |
| 31 | 104.1 | 103.099280186517 | 1.00071981348258 |
| 32 | 105.3 | 104.979613392565 | 0.320386607435388 |
| 33 | 115 | 119.700254322106 | -4.70025432210564 |
| 34 | 124.1 | 121.877996801324 | 2.2220031986757 |
| 35 | 116.8 | 114.676030704856 | 2.12396929514356 |
| 36 | 107.5 | 108.551911860442 | -1.05191186044187 |
| 37 | 115.6 | 113.552811218520 | 2.0471887814802 |
| 38 | 116.2 | 109.225368560427 | 6.97463143957302 |
| 39 | 116.3 | 118.016875412683 | -1.71687541268341 |
| 40 | 119 | 115.339586358247 | 3.66041364175254 |
| 41 | 111.9 | 111.489432578926 | 0.410567421074432 |
| 42 | 118.6 | 118.289034243896 | 0.310965756104348 |
| 43 | 106.9 | 105.755464834023 | 1.14453516597682 |
| 44 | 103.2 | 101.594372707854 | 1.60562729214648 |
| 45 | 118.6 | 116.171559429585 | 2.42844057041532 |
| 46 | 118.7 | 118.217898894146 | 0.482101105853787 |
| 47 | 102.8 | 107.172625648451 | -4.37262564845132 |
| 48 | 100.6 | 101.709730211763 | -1.10973021176333 |
| 49 | 94.9 | 99.1456825261044 | -4.2456825261044 |
| 50 | 94.5 | 93.5255194598683 | 0.97448054013173 |
| 51 | 102.9 | 103.159286827856 | -0.259286827856248 |
| 52 | 95.3 | 94.56400972375 | 0.735990276250078 |
| 53 | 92.5 | 94.8339293246623 | -2.3339293246623 |
| 54 | 102.7 | 104.986481748535 | -2.28648174853454 |
| 55 | 91.5 | 88.6467890918855 | 2.8532109081145 |
| 56 | 89.5 | 89.4088336038167 | 0.091166396183328 |
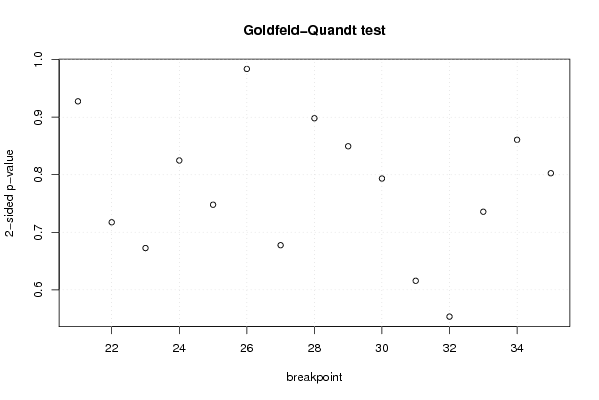
| Goldfeld-Quandt test for Heteroskedasticity | |||
| p-values | Alternative Hypothesis | ||
| breakpoint index | greater | 2-sided | less |
| 21 | 0.463790510710981 | 0.927581021421962 | 0.536209489289019 |
| 22 | 0.35868072858568 | 0.71736145717136 | 0.64131927141432 |
| 23 | 0.336295101830377 | 0.672590203660754 | 0.663704898169623 |
| 24 | 0.587601420382614 | 0.824797159234773 | 0.412398579617386 |
| 25 | 0.626052298832712 | 0.747895402334576 | 0.373947701167288 |
| 26 | 0.50808641570078 | 0.98382716859844 | 0.49191358429922 |
| 27 | 0.661235961156948 | 0.677528077686104 | 0.338764038843052 |
| 28 | 0.550928264830868 | 0.898143470338263 | 0.449071735169132 |
| 29 | 0.42475294985115 | 0.8495058997023 | 0.57524705014885 |
| 30 | 0.396714702921907 | 0.793429405843814 | 0.603285297078093 |
| 31 | 0.307851548743161 | 0.615703097486322 | 0.692148451256839 |
| 32 | 0.276697272001006 | 0.553394544002012 | 0.723302727998994 |
| 33 | 0.632153597544912 | 0.735692804910177 | 0.367846402455088 |
| 34 | 0.569635609149918 | 0.860728781700164 | 0.430364390850082 |
| 35 | 0.401314004018447 | 0.802628008036894 | 0.598685995981553 |
| Meta Analysis of Goldfeld-Quandt test for Heteroskedasticity | |||
| Description | # significant tests | % significant tests | OK/NOK |
| 1% type I error level | 0 | 0 | OK |
| 5% type I error level | 0 | 0 | OK |
| 10% type I error level | 0 | 0 | OK |