Free Statistics

of Irreproducible Research!

Author's title

Author*The author of this computation has been verified*
R Software Modulerwasp_multipleregression.wasp
Title produced by softwareMultiple Regression
Date of computationFri, 20 Nov 2009 07:53:18 -0700
Cite this page as followsStatistical Computations at FreeStatistics.org, Office for Research Development and Education, URL https://freestatistics.org/blog/index.php?v=date/2009/Nov/20/t1258728935gm62bo0e7jacl44.htm/, Retrieved Fri, 26 Apr 2024 17:15:02 +0000
Statistical Computations at FreeStatistics.org, Office for Research Development and Education, URL https://freestatistics.org/blog/index.php?pk=58235, Retrieved Fri, 26 Apr 2024 17:15:02 +0000
QR Codes:

Original text written by user:
IsPrivate?No (this computation is public)
User-defined keywords
Estimated Impact182
Family? (F = Feedback message, R = changed R code, M = changed R Module, P = changed Parameters, D = changed Data)
-     [Multiple Regression] [Q1 The Seatbeltlaw] [2007-11-14 19:27:43] [8cd6641b921d30ebe00b648d1481bba0]
- RM D  [Multiple Regression] [Seatbelt] [2009-11-12 14:10:54] [b98453cac15ba1066b407e146608df68]
-   PD      [Multiple Regression] [] [2009-11-20 14:53:18] [429631dabc57c2ce83a6344a979b9063] [Current]
Feedback Forum

Post a new message
Dataseries X:
100.6	33.5	107.1	107	111.9	115.6
99.2	31.5	100.6	107.1	107	111.9
108.4	31.2	99.2	100.6	107.1	107
103	27	108.4	99.2	100.6	107.1
99.8	26.7	103	108.4	99.2	100.6
115	26.5	99.8	103	108.4	99.2
90.8	26	115	99.8	103	108.4
95.9	27.2	90.8	115	99.8	103
114.4	30.5	95.9	90.8	115	99.8
108.2	33.7	114.4	95.9	90.8	115
112.6	34.2	108.2	114.4	95.9	90.8
109.1	36.7	112.6	108.2	114.4	95.9
105	36.2	109.1	112.6	108.2	114.4
105	38.5	105	109.1	112.6	108.2
118.5	40	105	105	109.1	112.6
103.7	42.5	118.5	105	105	109.1
112.5	43.5	103.7	118.5	105	105
116.6	43.3	112.5	103.7	118.5	105
96.6	45.5	116.6	112.5	103.7	118.5
101.9	44.3	96.6	116.6	112.5	103.7
116.5	43	101.9	96.6	116.6	112.5
119.3	43.5	116.5	101.9	96.6	116.6
115.4	41.5	119.3	116.5	101.9	96.6
108.5	42.5	115.4	119.3	116.5	101.9
111.5	41.3	108.5	115.4	119.3	116.5
108.8	39.5	111.5	108.5	115.4	119.3
121.8	38.5	108.8	111.5	108.5	115.4
109.6	41	121.8	108.8	111.5	108.5
112.2	44.5	109.6	121.8	108.8	111.5
119.6	46	112.2	109.6	121.8	108.8
104.1	44	119.6	112.2	109.6	121.8
105.3	41.5	104.1	119.6	112.2	109.6
115	41.3	105.3	104.1	119.6	112.2
124.1	38	115	105.3	104.1	119.6
116.8	38	124.1	115	105.3	104.1
107.5	36.2	116.8	124.1	115	105.3
115.6	38.7	107.5	116.8	124.1	115
116.2	38.7	115.6	107.5	116.8	124.1
116.3	39.2	116.2	115.6	107.5	116.8
119	35.7	116.3	116.2	115.6	107.5
111.9	36.5	119	116.3	116.2	115.6
118.6	36.7	111.9	119	116.3	116.2
106.9	34.7	118.6	111.9	119	116.3
103.2	35	106.9	118.6	111.9	119
118.6	28.2	103.2	106.9	118.6	111.9
118.7	23.7	118.6	103.2	106.9	118.6
102.8	15	118.7	118.6	103.2	106.9
100.6	8.7	102.8	118.7	118.6	103.2
94.9	11	100.6	102.8	118.7	118.6
94.5	7.5	94.9	100.6	102.8	118.7
102.9	5.7	94.5	94.9	100.6	102.8
95.3	9.3	102.9	94.5	94.9	100.6
92.5	10.2	95.3	102.9	94.5	94.9
102.7	15.7	92.5	95.3	102.9	94.5
91.5	18.1	102.7	92.5	95.3	102.9
89.5	20.8	91.5	102.7	92.5	95.3


Summary of computational transaction
Raw Inputview raw input (R code)
Raw Outputview raw output of R engine
Computing time3 seconds
R Server'Gwilym Jenkins' @ 72.249.127.135

\begin{tabular}{lllllllll}
\hline
Summary of computational transaction \tabularnewline
Raw Input & view raw input (R code)  \tabularnewline
Raw Output & view raw output of R engine  \tabularnewline
Computing time & 3 seconds \tabularnewline
R Server & 'Gwilym Jenkins' @ 72.249.127.135 \tabularnewline
\hline
\end{tabular}
%Source: https://freestatistics.org/blog/index.php?pk=58235&T=0

[TABLE]
[ROW][C]Summary of computational transaction[/C][/ROW]
[ROW][C]Raw Input[/C][C]view raw input (R code) [/C][/ROW]
[ROW][C]Raw Output[/C][C]view raw output of R engine [/C][/ROW]
[ROW][C]Computing time[/C][C]3 seconds[/C][/ROW]
[ROW][C]R Server[/C][C]'Gwilym Jenkins' @ 72.249.127.135[/C][/ROW]
[/TABLE]
Source: https://freestatistics.org/blog/index.php?pk=58235&T=0

Globally Unique Identifier (entire table): ba.freestatistics.org/blog/index.php?pk=58235&T=0

As an alternative you can also use a QR Code:  

The GUIDs for individual cells are displayed in the table below:

Summary of computational transaction
Raw Inputview raw input (R code)
Raw Outputview raw output of R engine
Computing time3 seconds
R Server'Gwilym Jenkins' @ 72.249.127.135


Multiple Linear Regression - Estimated Regression Equation
Ipzb[t] = + 37.9750577712368 + 0.35752597917971Cvn[t] -0.0972246665009244Y1[t] + 0.210673223544915Y2[t] + 0.471709841600752Y3[t] -0.130871652430054Y4[t] + 1.65159776730035M1[t] + 4.63924252137943M2[t] + 14.9692992911281M3[t] + 8.32260636552639M4[t] + 5.13879831352945M5[t] + 10.5730267079814M6[t] -0.424942244137813M7[t] -3.60594526919893M8[t] + 11.3518116431457M9[t] + 23.6135067770042M10[t] + 12.5920852084701M11[t] + 0.0661072462522717t + e[t]

\begin{tabular}{lllllllll}
\hline
Multiple Linear Regression - Estimated Regression Equation \tabularnewline
Ipzb[t] =  +  37.9750577712368 +  0.35752597917971Cvn[t] -0.0972246665009244Y1[t] +  0.210673223544915Y2[t] +  0.471709841600752Y3[t] -0.130871652430054Y4[t] +  1.65159776730035M1[t] +  4.63924252137943M2[t] +  14.9692992911281M3[t] +  8.32260636552639M4[t] +  5.13879831352945M5[t] +  10.5730267079814M6[t] -0.424942244137813M7[t] -3.60594526919893M8[t] +  11.3518116431457M9[t] +  23.6135067770042M10[t] +  12.5920852084701M11[t] +  0.0661072462522717t  + e[t] \tabularnewline
\hline
\end{tabular}
%Source: https://freestatistics.org/blog/index.php?pk=58235&T=1

[TABLE]
[ROW][C]Multiple Linear Regression - Estimated Regression Equation[/C][/ROW]
[ROW][C]Ipzb[t] =  +  37.9750577712368 +  0.35752597917971Cvn[t] -0.0972246665009244Y1[t] +  0.210673223544915Y2[t] +  0.471709841600752Y3[t] -0.130871652430054Y4[t] +  1.65159776730035M1[t] +  4.63924252137943M2[t] +  14.9692992911281M3[t] +  8.32260636552639M4[t] +  5.13879831352945M5[t] +  10.5730267079814M6[t] -0.424942244137813M7[t] -3.60594526919893M8[t] +  11.3518116431457M9[t] +  23.6135067770042M10[t] +  12.5920852084701M11[t] +  0.0661072462522717t  + e[t][/C][/ROW]
[/TABLE]
Source: https://freestatistics.org/blog/index.php?pk=58235&T=1

Globally Unique Identifier (entire table): ba.freestatistics.org/blog/index.php?pk=58235&T=1

As an alternative you can also use a QR Code:  

The GUIDs for individual cells are displayed in the table below:

Multiple Linear Regression - Estimated Regression Equation
Ipzb[t] = + 37.9750577712368 + 0.35752597917971Cvn[t] -0.0972246665009244Y1[t] + 0.210673223544915Y2[t] + 0.471709841600752Y3[t] -0.130871652430054Y4[t] + 1.65159776730035M1[t] + 4.63924252137943M2[t] + 14.9692992911281M3[t] + 8.32260636552639M4[t] + 5.13879831352945M5[t] + 10.5730267079814M6[t] -0.424942244137813M7[t] -3.60594526919893M8[t] + 11.3518116431457M9[t] + 23.6135067770042M10[t] + 12.5920852084701M11[t] + 0.0661072462522717t + e[t]


Multiple Linear Regression - Ordinary Least Squares
VariableParameterS.D.T-STATH0: parameter = 02-tail p-value1-tail p-value
(Intercept)37.975057771236813.7234652.76720.0086870.004343
Cvn0.357525979179710.087814.07160.0002280.000114
Y1-0.09722466650092440.164693-0.59030.5584580.279229
Y20.2106732235449150.1287171.63670.1099470.054973
Y30.4717098416007520.1186073.97710.0003020.000151
Y4-0.1308716524300540.148908-0.87890.3849920.192496
M11.651597767300353.9261730.42070.676370.338185
M24.639242521379434.3098251.07640.288520.14426
M314.96929929112813.8380413.90020.0003790.00019
M48.322606365526393.1218462.66590.0112120.005606
M55.138798313529452.9355811.75050.0880990.04405
M610.57302670798143.2260223.27740.0022440.001122
M7-0.4249422441378133.682638-0.11540.9087430.454372
M8-3.605945269198933.749797-0.96160.3423110.171156
M911.35181164314574.7994982.36520.0232270.011614
M1023.61350677700424.664525.06241.1e-055e-06
M1112.59208520847013.1951183.9410.0003360.000168
t0.06610724625227170.0381511.73280.0912410.045621

\begin{tabular}{lllllllll}
\hline
Multiple Linear Regression - Ordinary Least Squares \tabularnewline
Variable & Parameter & S.D. & T-STATH0: parameter = 0 & 2-tail p-value & 1-tail p-value \tabularnewline
(Intercept) & 37.9750577712368 & 13.723465 & 2.7672 & 0.008687 & 0.004343 \tabularnewline
Cvn & 0.35752597917971 & 0.08781 & 4.0716 & 0.000228 & 0.000114 \tabularnewline
Y1 & -0.0972246665009244 & 0.164693 & -0.5903 & 0.558458 & 0.279229 \tabularnewline
Y2 & 0.210673223544915 & 0.128717 & 1.6367 & 0.109947 & 0.054973 \tabularnewline
Y3 & 0.471709841600752 & 0.118607 & 3.9771 & 0.000302 & 0.000151 \tabularnewline
Y4 & -0.130871652430054 & 0.148908 & -0.8789 & 0.384992 & 0.192496 \tabularnewline
M1 & 1.65159776730035 & 3.926173 & 0.4207 & 0.67637 & 0.338185 \tabularnewline
M2 & 4.63924252137943 & 4.309825 & 1.0764 & 0.28852 & 0.14426 \tabularnewline
M3 & 14.9692992911281 & 3.838041 & 3.9002 & 0.000379 & 0.00019 \tabularnewline
M4 & 8.32260636552639 & 3.121846 & 2.6659 & 0.011212 & 0.005606 \tabularnewline
M5 & 5.13879831352945 & 2.935581 & 1.7505 & 0.088099 & 0.04405 \tabularnewline
M6 & 10.5730267079814 & 3.226022 & 3.2774 & 0.002244 & 0.001122 \tabularnewline
M7 & -0.424942244137813 & 3.682638 & -0.1154 & 0.908743 & 0.454372 \tabularnewline
M8 & -3.60594526919893 & 3.749797 & -0.9616 & 0.342311 & 0.171156 \tabularnewline
M9 & 11.3518116431457 & 4.799498 & 2.3652 & 0.023227 & 0.011614 \tabularnewline
M10 & 23.6135067770042 & 4.66452 & 5.0624 & 1.1e-05 & 5e-06 \tabularnewline
M11 & 12.5920852084701 & 3.195118 & 3.941 & 0.000336 & 0.000168 \tabularnewline
t & 0.0661072462522717 & 0.038151 & 1.7328 & 0.091241 & 0.045621 \tabularnewline
\hline
\end{tabular}
%Source: https://freestatistics.org/blog/index.php?pk=58235&T=2

[TABLE]
[ROW][C]Multiple Linear Regression - Ordinary Least Squares[/C][/ROW]
[ROW][C]Variable[/C][C]Parameter[/C][C]S.D.[/C][C]T-STATH0: parameter = 0[/C][C]2-tail p-value[/C][C]1-tail p-value[/C][/ROW]
[ROW][C](Intercept)[/C][C]37.9750577712368[/C][C]13.723465[/C][C]2.7672[/C][C]0.008687[/C][C]0.004343[/C][/ROW]
[ROW][C]Cvn[/C][C]0.35752597917971[/C][C]0.08781[/C][C]4.0716[/C][C]0.000228[/C][C]0.000114[/C][/ROW]
[ROW][C]Y1[/C][C]-0.0972246665009244[/C][C]0.164693[/C][C]-0.5903[/C][C]0.558458[/C][C]0.279229[/C][/ROW]
[ROW][C]Y2[/C][C]0.210673223544915[/C][C]0.128717[/C][C]1.6367[/C][C]0.109947[/C][C]0.054973[/C][/ROW]
[ROW][C]Y3[/C][C]0.471709841600752[/C][C]0.118607[/C][C]3.9771[/C][C]0.000302[/C][C]0.000151[/C][/ROW]
[ROW][C]Y4[/C][C]-0.130871652430054[/C][C]0.148908[/C][C]-0.8789[/C][C]0.384992[/C][C]0.192496[/C][/ROW]
[ROW][C]M1[/C][C]1.65159776730035[/C][C]3.926173[/C][C]0.4207[/C][C]0.67637[/C][C]0.338185[/C][/ROW]
[ROW][C]M2[/C][C]4.63924252137943[/C][C]4.309825[/C][C]1.0764[/C][C]0.28852[/C][C]0.14426[/C][/ROW]
[ROW][C]M3[/C][C]14.9692992911281[/C][C]3.838041[/C][C]3.9002[/C][C]0.000379[/C][C]0.00019[/C][/ROW]
[ROW][C]M4[/C][C]8.32260636552639[/C][C]3.121846[/C][C]2.6659[/C][C]0.011212[/C][C]0.005606[/C][/ROW]
[ROW][C]M5[/C][C]5.13879831352945[/C][C]2.935581[/C][C]1.7505[/C][C]0.088099[/C][C]0.04405[/C][/ROW]
[ROW][C]M6[/C][C]10.5730267079814[/C][C]3.226022[/C][C]3.2774[/C][C]0.002244[/C][C]0.001122[/C][/ROW]
[ROW][C]M7[/C][C]-0.424942244137813[/C][C]3.682638[/C][C]-0.1154[/C][C]0.908743[/C][C]0.454372[/C][/ROW]
[ROW][C]M8[/C][C]-3.60594526919893[/C][C]3.749797[/C][C]-0.9616[/C][C]0.342311[/C][C]0.171156[/C][/ROW]
[ROW][C]M9[/C][C]11.3518116431457[/C][C]4.799498[/C][C]2.3652[/C][C]0.023227[/C][C]0.011614[/C][/ROW]
[ROW][C]M10[/C][C]23.6135067770042[/C][C]4.66452[/C][C]5.0624[/C][C]1.1e-05[/C][C]5e-06[/C][/ROW]
[ROW][C]M11[/C][C]12.5920852084701[/C][C]3.195118[/C][C]3.941[/C][C]0.000336[/C][C]0.000168[/C][/ROW]
[ROW][C]t[/C][C]0.0661072462522717[/C][C]0.038151[/C][C]1.7328[/C][C]0.091241[/C][C]0.045621[/C][/ROW]
[/TABLE]
Source: https://freestatistics.org/blog/index.php?pk=58235&T=2

Globally Unique Identifier (entire table): ba.freestatistics.org/blog/index.php?pk=58235&T=2

As an alternative you can also use a QR Code:  

The GUIDs for individual cells are displayed in the table below:

Multiple Linear Regression - Ordinary Least Squares
VariableParameterS.D.T-STATH0: parameter = 02-tail p-value1-tail p-value
(Intercept)37.975057771236813.7234652.76720.0086870.004343
Cvn0.357525979179710.087814.07160.0002280.000114
Y1-0.09722466650092440.164693-0.59030.5584580.279229
Y20.2106732235449150.1287171.63670.1099470.054973
Y30.4717098416007520.1186073.97710.0003020.000151
Y4-0.1308716524300540.148908-0.87890.3849920.192496
M11.651597767300353.9261730.42070.676370.338185
M24.639242521379434.3098251.07640.288520.14426
M314.96929929112813.8380413.90020.0003790.00019
M48.322606365526393.1218462.66590.0112120.005606
M55.138798313529452.9355811.75050.0880990.04405
M610.57302670798143.2260223.27740.0022440.001122
M7-0.4249422441378133.682638-0.11540.9087430.454372
M8-3.605945269198933.749797-0.96160.3423110.171156
M911.35181164314574.7994982.36520.0232270.011614
M1023.61350677700424.664525.06241.1e-055e-06
M1112.59208520847013.1951183.9410.0003360.000168
t0.06610724625227170.0381511.73280.0912410.045621


Multiple Linear Regression - Regression Statistics
Multiple R0.951169221640086
R-squared0.904722888195407
Adjusted R-squared0.862098917124931
F-TEST (value)21.2256827666176
F-TEST (DF numerator)17
F-TEST (DF denominator)38
p-value2.39808173319034e-14
Multiple Linear Regression - Residual Statistics
Residual Standard Deviation3.32446883465033
Sum Squared Residuals419.97953523733

\begin{tabular}{lllllllll}
\hline
Multiple Linear Regression - Regression Statistics \tabularnewline
Multiple R & 0.951169221640086 \tabularnewline
R-squared & 0.904722888195407 \tabularnewline
Adjusted R-squared & 0.862098917124931 \tabularnewline
F-TEST (value) & 21.2256827666176 \tabularnewline
F-TEST (DF numerator) & 17 \tabularnewline
F-TEST (DF denominator) & 38 \tabularnewline
p-value & 2.39808173319034e-14 \tabularnewline
Multiple Linear Regression - Residual Statistics \tabularnewline
Residual Standard Deviation & 3.32446883465033 \tabularnewline
Sum Squared Residuals & 419.97953523733 \tabularnewline
\hline
\end{tabular}
%Source: https://freestatistics.org/blog/index.php?pk=58235&T=3

[TABLE]
[ROW][C]Multiple Linear Regression - Regression Statistics[/C][/ROW]
[ROW][C]Multiple R[/C][C]0.951169221640086[/C][/ROW]
[ROW][C]R-squared[/C][C]0.904722888195407[/C][/ROW]
[ROW][C]Adjusted R-squared[/C][C]0.862098917124931[/C][/ROW]
[ROW][C]F-TEST (value)[/C][C]21.2256827666176[/C][/ROW]
[ROW][C]F-TEST (DF numerator)[/C][C]17[/C][/ROW]
[ROW][C]F-TEST (DF denominator)[/C][C]38[/C][/ROW]
[ROW][C]p-value[/C][C]2.39808173319034e-14[/C][/ROW]
[ROW][C]Multiple Linear Regression - Residual Statistics[/C][/ROW]
[ROW][C]Residual Standard Deviation[/C][C]3.32446883465033[/C][/ROW]
[ROW][C]Sum Squared Residuals[/C][C]419.97953523733[/C][/ROW]
[/TABLE]
Source: https://freestatistics.org/blog/index.php?pk=58235&T=3

Globally Unique Identifier (entire table): ba.freestatistics.org/blog/index.php?pk=58235&T=3

As an alternative you can also use a QR Code:  

The GUIDs for individual cells are displayed in the table below:

Multiple Linear Regression - Regression Statistics
Multiple R0.951169221640086
R-squared0.904722888195407
Adjusted R-squared0.862098917124931
F-TEST (value)21.2256827666176
F-TEST (DF numerator)17
F-TEST (DF denominator)38
p-value2.39808173319034e-14
Multiple Linear Regression - Residual Statistics
Residual Standard Deviation3.32446883465033
Sum Squared Residuals419.97953523733


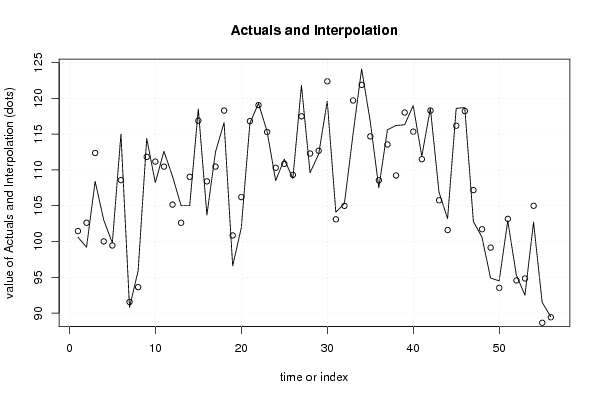
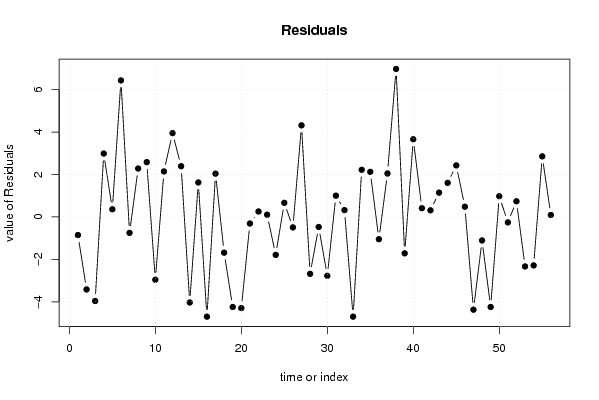
Multiple Linear Regression - Actuals, Interpolation, and Residuals
Time or IndexActualsInterpolationForecastResidualsPrediction Error
1100.6101.454724478577-0.85472447857655
299.2102.619299065306-3.41929906530648
3108.4112.363385948680-3.96338594868014
4103100.0125805763572.98741942364329
599.899.44110079513060.358899204869372
6115108.5663656217886.43363437821166
790.891.5525193331732-0.752519333173178
895.993.6189600865852.28103991341506
9114.4111.8173010476412.58269895235922
10108.2111.160336387264-2.96033638726361
11112.6110.4568468034292.14315319657057
12109.1105.1499079127993.950092087201
13105102.6103718652322.38962813476804
14105109.034626016033-4.03462601603286
15118.5116.8764990679741.62350093202566
16103.7108.401235771754-4.70123577175384
17112.5110.4606483022222.03935169777787
18116.6118.284020835028-1.68402083502772
1996.6100.845946554401-4.24594655440072
20101.9106.198220209180-4.29822020918026
21116.5116.810885200669-0.310885200668901
22119.3119.0437679172660.256232082734123
23115.4115.2944968432630.105503156737186
24108.5110.288450014996-1.78845001499580
25111.5110.8364099115670.663590088432707
26108.8109.295186898365-0.495186898365405
27121.8117.4839527428064.31604725719414
28109.6112.282587569892-2.68258756989208
29112.2112.674888999059-0.474888999059369
30119.6122.374097550754-2.77409755075375
31104.1103.0992801865171.00071981348258
32105.3104.9796133925650.320386607435388
33115119.700254322106-4.70025432210564
34124.1121.8779968013242.2220031986757
35116.8114.6760307048562.12396929514356
36107.5108.551911860442-1.05191186044187
37115.6113.5528112185202.0471887814802
38116.2109.2253685604276.97463143957302
39116.3118.016875412683-1.71687541268341
40119115.3395863582473.66041364175254
41111.9111.4894325789260.410567421074432
42118.6118.2890342438960.310965756104348
43106.9105.7554648340231.14453516597682
44103.2101.5943727078541.60562729214648
45118.6116.1715594295852.42844057041532
46118.7118.2178988941460.482101105853787
47102.8107.172625648451-4.37262564845132
48100.6101.709730211763-1.10973021176333
4994.999.1456825261044-4.2456825261044
5094.593.52551945986830.97448054013173
51102.9103.159286827856-0.259286827856248
5295.394.564009723750.735990276250078
5392.594.8339293246623-2.3339293246623
54102.7104.986481748535-2.28648174853454
5591.588.64678909188552.8532109081145
5689.589.40883360381670.091166396183328

\begin{tabular}{lllllllll}
\hline
Multiple Linear Regression - Actuals, Interpolation, and Residuals \tabularnewline
Time or Index & Actuals & InterpolationForecast & ResidualsPrediction Error \tabularnewline
1 & 100.6 & 101.454724478577 & -0.85472447857655 \tabularnewline
2 & 99.2 & 102.619299065306 & -3.41929906530648 \tabularnewline
3 & 108.4 & 112.363385948680 & -3.96338594868014 \tabularnewline
4 & 103 & 100.012580576357 & 2.98741942364329 \tabularnewline
5 & 99.8 & 99.4411007951306 & 0.358899204869372 \tabularnewline
6 & 115 & 108.566365621788 & 6.43363437821166 \tabularnewline
7 & 90.8 & 91.5525193331732 & -0.752519333173178 \tabularnewline
8 & 95.9 & 93.618960086585 & 2.28103991341506 \tabularnewline
9 & 114.4 & 111.817301047641 & 2.58269895235922 \tabularnewline
10 & 108.2 & 111.160336387264 & -2.96033638726361 \tabularnewline
11 & 112.6 & 110.456846803429 & 2.14315319657057 \tabularnewline
12 & 109.1 & 105.149907912799 & 3.950092087201 \tabularnewline
13 & 105 & 102.610371865232 & 2.38962813476804 \tabularnewline
14 & 105 & 109.034626016033 & -4.03462601603286 \tabularnewline
15 & 118.5 & 116.876499067974 & 1.62350093202566 \tabularnewline
16 & 103.7 & 108.401235771754 & -4.70123577175384 \tabularnewline
17 & 112.5 & 110.460648302222 & 2.03935169777787 \tabularnewline
18 & 116.6 & 118.284020835028 & -1.68402083502772 \tabularnewline
19 & 96.6 & 100.845946554401 & -4.24594655440072 \tabularnewline
20 & 101.9 & 106.198220209180 & -4.29822020918026 \tabularnewline
21 & 116.5 & 116.810885200669 & -0.310885200668901 \tabularnewline
22 & 119.3 & 119.043767917266 & 0.256232082734123 \tabularnewline
23 & 115.4 & 115.294496843263 & 0.105503156737186 \tabularnewline
24 & 108.5 & 110.288450014996 & -1.78845001499580 \tabularnewline
25 & 111.5 & 110.836409911567 & 0.663590088432707 \tabularnewline
26 & 108.8 & 109.295186898365 & -0.495186898365405 \tabularnewline
27 & 121.8 & 117.483952742806 & 4.31604725719414 \tabularnewline
28 & 109.6 & 112.282587569892 & -2.68258756989208 \tabularnewline
29 & 112.2 & 112.674888999059 & -0.474888999059369 \tabularnewline
30 & 119.6 & 122.374097550754 & -2.77409755075375 \tabularnewline
31 & 104.1 & 103.099280186517 & 1.00071981348258 \tabularnewline
32 & 105.3 & 104.979613392565 & 0.320386607435388 \tabularnewline
33 & 115 & 119.700254322106 & -4.70025432210564 \tabularnewline
34 & 124.1 & 121.877996801324 & 2.2220031986757 \tabularnewline
35 & 116.8 & 114.676030704856 & 2.12396929514356 \tabularnewline
36 & 107.5 & 108.551911860442 & -1.05191186044187 \tabularnewline
37 & 115.6 & 113.552811218520 & 2.0471887814802 \tabularnewline
38 & 116.2 & 109.225368560427 & 6.97463143957302 \tabularnewline
39 & 116.3 & 118.016875412683 & -1.71687541268341 \tabularnewline
40 & 119 & 115.339586358247 & 3.66041364175254 \tabularnewline
41 & 111.9 & 111.489432578926 & 0.410567421074432 \tabularnewline
42 & 118.6 & 118.289034243896 & 0.310965756104348 \tabularnewline
43 & 106.9 & 105.755464834023 & 1.14453516597682 \tabularnewline
44 & 103.2 & 101.594372707854 & 1.60562729214648 \tabularnewline
45 & 118.6 & 116.171559429585 & 2.42844057041532 \tabularnewline
46 & 118.7 & 118.217898894146 & 0.482101105853787 \tabularnewline
47 & 102.8 & 107.172625648451 & -4.37262564845132 \tabularnewline
48 & 100.6 & 101.709730211763 & -1.10973021176333 \tabularnewline
49 & 94.9 & 99.1456825261044 & -4.2456825261044 \tabularnewline
50 & 94.5 & 93.5255194598683 & 0.97448054013173 \tabularnewline
51 & 102.9 & 103.159286827856 & -0.259286827856248 \tabularnewline
52 & 95.3 & 94.56400972375 & 0.735990276250078 \tabularnewline
53 & 92.5 & 94.8339293246623 & -2.3339293246623 \tabularnewline
54 & 102.7 & 104.986481748535 & -2.28648174853454 \tabularnewline
55 & 91.5 & 88.6467890918855 & 2.8532109081145 \tabularnewline
56 & 89.5 & 89.4088336038167 & 0.091166396183328 \tabularnewline
\hline
\end{tabular}
%Source: https://freestatistics.org/blog/index.php?pk=58235&T=4

[TABLE]
[ROW][C]Multiple Linear Regression - Actuals, Interpolation, and Residuals[/C][/ROW]
[ROW][C]Time or Index[/C][C]Actuals[/C][C]InterpolationForecast[/C][C]ResidualsPrediction Error[/C][/ROW]
[ROW][C]1[/C][C]100.6[/C][C]101.454724478577[/C][C]-0.85472447857655[/C][/ROW]
[ROW][C]2[/C][C]99.2[/C][C]102.619299065306[/C][C]-3.41929906530648[/C][/ROW]
[ROW][C]3[/C][C]108.4[/C][C]112.363385948680[/C][C]-3.96338594868014[/C][/ROW]
[ROW][C]4[/C][C]103[/C][C]100.012580576357[/C][C]2.98741942364329[/C][/ROW]
[ROW][C]5[/C][C]99.8[/C][C]99.4411007951306[/C][C]0.358899204869372[/C][/ROW]
[ROW][C]6[/C][C]115[/C][C]108.566365621788[/C][C]6.43363437821166[/C][/ROW]
[ROW][C]7[/C][C]90.8[/C][C]91.5525193331732[/C][C]-0.752519333173178[/C][/ROW]
[ROW][C]8[/C][C]95.9[/C][C]93.618960086585[/C][C]2.28103991341506[/C][/ROW]
[ROW][C]9[/C][C]114.4[/C][C]111.817301047641[/C][C]2.58269895235922[/C][/ROW]
[ROW][C]10[/C][C]108.2[/C][C]111.160336387264[/C][C]-2.96033638726361[/C][/ROW]
[ROW][C]11[/C][C]112.6[/C][C]110.456846803429[/C][C]2.14315319657057[/C][/ROW]
[ROW][C]12[/C][C]109.1[/C][C]105.149907912799[/C][C]3.950092087201[/C][/ROW]
[ROW][C]13[/C][C]105[/C][C]102.610371865232[/C][C]2.38962813476804[/C][/ROW]
[ROW][C]14[/C][C]105[/C][C]109.034626016033[/C][C]-4.03462601603286[/C][/ROW]
[ROW][C]15[/C][C]118.5[/C][C]116.876499067974[/C][C]1.62350093202566[/C][/ROW]
[ROW][C]16[/C][C]103.7[/C][C]108.401235771754[/C][C]-4.70123577175384[/C][/ROW]
[ROW][C]17[/C][C]112.5[/C][C]110.460648302222[/C][C]2.03935169777787[/C][/ROW]
[ROW][C]18[/C][C]116.6[/C][C]118.284020835028[/C][C]-1.68402083502772[/C][/ROW]
[ROW][C]19[/C][C]96.6[/C][C]100.845946554401[/C][C]-4.24594655440072[/C][/ROW]
[ROW][C]20[/C][C]101.9[/C][C]106.198220209180[/C][C]-4.29822020918026[/C][/ROW]
[ROW][C]21[/C][C]116.5[/C][C]116.810885200669[/C][C]-0.310885200668901[/C][/ROW]
[ROW][C]22[/C][C]119.3[/C][C]119.043767917266[/C][C]0.256232082734123[/C][/ROW]
[ROW][C]23[/C][C]115.4[/C][C]115.294496843263[/C][C]0.105503156737186[/C][/ROW]
[ROW][C]24[/C][C]108.5[/C][C]110.288450014996[/C][C]-1.78845001499580[/C][/ROW]
[ROW][C]25[/C][C]111.5[/C][C]110.836409911567[/C][C]0.663590088432707[/C][/ROW]
[ROW][C]26[/C][C]108.8[/C][C]109.295186898365[/C][C]-0.495186898365405[/C][/ROW]
[ROW][C]27[/C][C]121.8[/C][C]117.483952742806[/C][C]4.31604725719414[/C][/ROW]
[ROW][C]28[/C][C]109.6[/C][C]112.282587569892[/C][C]-2.68258756989208[/C][/ROW]
[ROW][C]29[/C][C]112.2[/C][C]112.674888999059[/C][C]-0.474888999059369[/C][/ROW]
[ROW][C]30[/C][C]119.6[/C][C]122.374097550754[/C][C]-2.77409755075375[/C][/ROW]
[ROW][C]31[/C][C]104.1[/C][C]103.099280186517[/C][C]1.00071981348258[/C][/ROW]
[ROW][C]32[/C][C]105.3[/C][C]104.979613392565[/C][C]0.320386607435388[/C][/ROW]
[ROW][C]33[/C][C]115[/C][C]119.700254322106[/C][C]-4.70025432210564[/C][/ROW]
[ROW][C]34[/C][C]124.1[/C][C]121.877996801324[/C][C]2.2220031986757[/C][/ROW]
[ROW][C]35[/C][C]116.8[/C][C]114.676030704856[/C][C]2.12396929514356[/C][/ROW]
[ROW][C]36[/C][C]107.5[/C][C]108.551911860442[/C][C]-1.05191186044187[/C][/ROW]
[ROW][C]37[/C][C]115.6[/C][C]113.552811218520[/C][C]2.0471887814802[/C][/ROW]
[ROW][C]38[/C][C]116.2[/C][C]109.225368560427[/C][C]6.97463143957302[/C][/ROW]
[ROW][C]39[/C][C]116.3[/C][C]118.016875412683[/C][C]-1.71687541268341[/C][/ROW]
[ROW][C]40[/C][C]119[/C][C]115.339586358247[/C][C]3.66041364175254[/C][/ROW]
[ROW][C]41[/C][C]111.9[/C][C]111.489432578926[/C][C]0.410567421074432[/C][/ROW]
[ROW][C]42[/C][C]118.6[/C][C]118.289034243896[/C][C]0.310965756104348[/C][/ROW]
[ROW][C]43[/C][C]106.9[/C][C]105.755464834023[/C][C]1.14453516597682[/C][/ROW]
[ROW][C]44[/C][C]103.2[/C][C]101.594372707854[/C][C]1.60562729214648[/C][/ROW]
[ROW][C]45[/C][C]118.6[/C][C]116.171559429585[/C][C]2.42844057041532[/C][/ROW]
[ROW][C]46[/C][C]118.7[/C][C]118.217898894146[/C][C]0.482101105853787[/C][/ROW]
[ROW][C]47[/C][C]102.8[/C][C]107.172625648451[/C][C]-4.37262564845132[/C][/ROW]
[ROW][C]48[/C][C]100.6[/C][C]101.709730211763[/C][C]-1.10973021176333[/C][/ROW]
[ROW][C]49[/C][C]94.9[/C][C]99.1456825261044[/C][C]-4.2456825261044[/C][/ROW]
[ROW][C]50[/C][C]94.5[/C][C]93.5255194598683[/C][C]0.97448054013173[/C][/ROW]
[ROW][C]51[/C][C]102.9[/C][C]103.159286827856[/C][C]-0.259286827856248[/C][/ROW]
[ROW][C]52[/C][C]95.3[/C][C]94.56400972375[/C][C]0.735990276250078[/C][/ROW]
[ROW][C]53[/C][C]92.5[/C][C]94.8339293246623[/C][C]-2.3339293246623[/C][/ROW]
[ROW][C]54[/C][C]102.7[/C][C]104.986481748535[/C][C]-2.28648174853454[/C][/ROW]
[ROW][C]55[/C][C]91.5[/C][C]88.6467890918855[/C][C]2.8532109081145[/C][/ROW]
[ROW][C]56[/C][C]89.5[/C][C]89.4088336038167[/C][C]0.091166396183328[/C][/ROW]
[/TABLE]
Source: https://freestatistics.org/blog/index.php?pk=58235&T=4

Globally Unique Identifier (entire table): ba.freestatistics.org/blog/index.php?pk=58235&T=4

As an alternative you can also use a QR Code:  

The GUIDs for individual cells are displayed in the table below:

Multiple Linear Regression - Actuals, Interpolation, and Residuals
Time or IndexActualsInterpolationForecastResidualsPrediction Error
1100.6101.454724478577-0.85472447857655
299.2102.619299065306-3.41929906530648
3108.4112.363385948680-3.96338594868014
4103100.0125805763572.98741942364329
599.899.44110079513060.358899204869372
6115108.5663656217886.43363437821166
790.891.5525193331732-0.752519333173178
895.993.6189600865852.28103991341506
9114.4111.8173010476412.58269895235922
10108.2111.160336387264-2.96033638726361
11112.6110.4568468034292.14315319657057
12109.1105.1499079127993.950092087201
13105102.6103718652322.38962813476804
14105109.034626016033-4.03462601603286
15118.5116.8764990679741.62350093202566
16103.7108.401235771754-4.70123577175384
17112.5110.4606483022222.03935169777787
18116.6118.284020835028-1.68402083502772
1996.6100.845946554401-4.24594655440072
20101.9106.198220209180-4.29822020918026
21116.5116.810885200669-0.310885200668901
22119.3119.0437679172660.256232082734123
23115.4115.2944968432630.105503156737186
24108.5110.288450014996-1.78845001499580
25111.5110.8364099115670.663590088432707
26108.8109.295186898365-0.495186898365405
27121.8117.4839527428064.31604725719414
28109.6112.282587569892-2.68258756989208
29112.2112.674888999059-0.474888999059369
30119.6122.374097550754-2.77409755075375
31104.1103.0992801865171.00071981348258
32105.3104.9796133925650.320386607435388
33115119.700254322106-4.70025432210564
34124.1121.8779968013242.2220031986757
35116.8114.6760307048562.12396929514356
36107.5108.551911860442-1.05191186044187
37115.6113.5528112185202.0471887814802
38116.2109.2253685604276.97463143957302
39116.3118.016875412683-1.71687541268341
40119115.3395863582473.66041364175254
41111.9111.4894325789260.410567421074432
42118.6118.2890342438960.310965756104348
43106.9105.7554648340231.14453516597682
44103.2101.5943727078541.60562729214648
45118.6116.1715594295852.42844057041532
46118.7118.2178988941460.482101105853787
47102.8107.172625648451-4.37262564845132
48100.6101.709730211763-1.10973021176333
4994.999.1456825261044-4.2456825261044
5094.593.52551945986830.97448054013173
51102.9103.159286827856-0.259286827856248
5295.394.564009723750.735990276250078
5392.594.8339293246623-2.3339293246623
54102.7104.986481748535-2.28648174853454
5591.588.64678909188552.8532109081145
5689.589.40883360381670.091166396183328


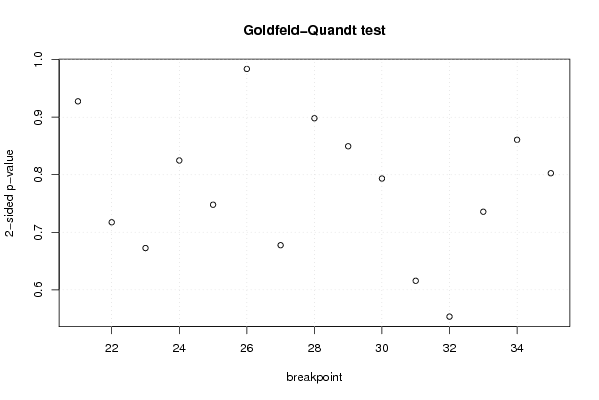
Goldfeld-Quandt test for Heteroskedasticity
p-valuesAlternative Hypothesis
breakpoint indexgreater2-sidedless
210.4637905107109810.9275810214219620.536209489289019
220.358680728585680.717361457171360.64131927141432
230.3362951018303770.6725902036607540.663704898169623
240.5876014203826140.8247971592347730.412398579617386
250.6260522988327120.7478954023345760.373947701167288
260.508086415700780.983827168598440.49191358429922
270.6612359611569480.6775280776861040.338764038843052
280.5509282648308680.8981434703382630.449071735169132
290.424752949851150.84950589970230.57524705014885
300.3967147029219070.7934294058438140.603285297078093
310.3078515487431610.6157030974863220.692148451256839
320.2766972720010060.5533945440020120.723302727998994
330.6321535975449120.7356928049101770.367846402455088
340.5696356091499180.8607287817001640.430364390850082
350.4013140040184470.8026280080368940.598685995981553

\begin{tabular}{lllllllll}
\hline
Goldfeld-Quandt test for Heteroskedasticity \tabularnewline
p-values & Alternative Hypothesis \tabularnewline
breakpoint index & greater & 2-sided & less \tabularnewline
21 & 0.463790510710981 & 0.927581021421962 & 0.536209489289019 \tabularnewline
22 & 0.35868072858568 & 0.71736145717136 & 0.64131927141432 \tabularnewline
23 & 0.336295101830377 & 0.672590203660754 & 0.663704898169623 \tabularnewline
24 & 0.587601420382614 & 0.824797159234773 & 0.412398579617386 \tabularnewline
25 & 0.626052298832712 & 0.747895402334576 & 0.373947701167288 \tabularnewline
26 & 0.50808641570078 & 0.98382716859844 & 0.49191358429922 \tabularnewline
27 & 0.661235961156948 & 0.677528077686104 & 0.338764038843052 \tabularnewline
28 & 0.550928264830868 & 0.898143470338263 & 0.449071735169132 \tabularnewline
29 & 0.42475294985115 & 0.8495058997023 & 0.57524705014885 \tabularnewline
30 & 0.396714702921907 & 0.793429405843814 & 0.603285297078093 \tabularnewline
31 & 0.307851548743161 & 0.615703097486322 & 0.692148451256839 \tabularnewline
32 & 0.276697272001006 & 0.553394544002012 & 0.723302727998994 \tabularnewline
33 & 0.632153597544912 & 0.735692804910177 & 0.367846402455088 \tabularnewline
34 & 0.569635609149918 & 0.860728781700164 & 0.430364390850082 \tabularnewline
35 & 0.401314004018447 & 0.802628008036894 & 0.598685995981553 \tabularnewline
\hline
\end{tabular}
%Source: https://freestatistics.org/blog/index.php?pk=58235&T=5

[TABLE]
[ROW][C]Goldfeld-Quandt test for Heteroskedasticity[/C][/ROW]
[ROW][C]p-values[/C][C]Alternative Hypothesis[/C][/ROW]
[ROW][C]breakpoint index[/C][C]greater[/C][C]2-sided[/C][C]less[/C][/ROW]
[ROW][C]21[/C][C]0.463790510710981[/C][C]0.927581021421962[/C][C]0.536209489289019[/C][/ROW]
[ROW][C]22[/C][C]0.35868072858568[/C][C]0.71736145717136[/C][C]0.64131927141432[/C][/ROW]
[ROW][C]23[/C][C]0.336295101830377[/C][C]0.672590203660754[/C][C]0.663704898169623[/C][/ROW]
[ROW][C]24[/C][C]0.587601420382614[/C][C]0.824797159234773[/C][C]0.412398579617386[/C][/ROW]
[ROW][C]25[/C][C]0.626052298832712[/C][C]0.747895402334576[/C][C]0.373947701167288[/C][/ROW]
[ROW][C]26[/C][C]0.50808641570078[/C][C]0.98382716859844[/C][C]0.49191358429922[/C][/ROW]
[ROW][C]27[/C][C]0.661235961156948[/C][C]0.677528077686104[/C][C]0.338764038843052[/C][/ROW]
[ROW][C]28[/C][C]0.550928264830868[/C][C]0.898143470338263[/C][C]0.449071735169132[/C][/ROW]
[ROW][C]29[/C][C]0.42475294985115[/C][C]0.8495058997023[/C][C]0.57524705014885[/C][/ROW]
[ROW][C]30[/C][C]0.396714702921907[/C][C]0.793429405843814[/C][C]0.603285297078093[/C][/ROW]
[ROW][C]31[/C][C]0.307851548743161[/C][C]0.615703097486322[/C][C]0.692148451256839[/C][/ROW]
[ROW][C]32[/C][C]0.276697272001006[/C][C]0.553394544002012[/C][C]0.723302727998994[/C][/ROW]
[ROW][C]33[/C][C]0.632153597544912[/C][C]0.735692804910177[/C][C]0.367846402455088[/C][/ROW]
[ROW][C]34[/C][C]0.569635609149918[/C][C]0.860728781700164[/C][C]0.430364390850082[/C][/ROW]
[ROW][C]35[/C][C]0.401314004018447[/C][C]0.802628008036894[/C][C]0.598685995981553[/C][/ROW]
[/TABLE]
Source: https://freestatistics.org/blog/index.php?pk=58235&T=5

Globally Unique Identifier (entire table): ba.freestatistics.org/blog/index.php?pk=58235&T=5

As an alternative you can also use a QR Code:  

The GUIDs for individual cells are displayed in the table below:

Goldfeld-Quandt test for Heteroskedasticity
p-valuesAlternative Hypothesis
breakpoint indexgreater2-sidedless
210.4637905107109810.9275810214219620.536209489289019
220.358680728585680.717361457171360.64131927141432
230.3362951018303770.6725902036607540.663704898169623
240.5876014203826140.8247971592347730.412398579617386
250.6260522988327120.7478954023345760.373947701167288
260.508086415700780.983827168598440.49191358429922
270.6612359611569480.6775280776861040.338764038843052
280.5509282648308680.8981434703382630.449071735169132
290.424752949851150.84950589970230.57524705014885
300.3967147029219070.7934294058438140.603285297078093
310.3078515487431610.6157030974863220.692148451256839
320.2766972720010060.5533945440020120.723302727998994
330.6321535975449120.7356928049101770.367846402455088
340.5696356091499180.8607287817001640.430364390850082
350.4013140040184470.8026280080368940.598685995981553


Meta Analysis of Goldfeld-Quandt test for Heteroskedasticity
Description# significant tests% significant testsOK/NOK
1% type I error level00OK
5% type I error level00OK
10% type I error level00OK

\begin{tabular}{lllllllll}
\hline
Meta Analysis of Goldfeld-Quandt test for Heteroskedasticity \tabularnewline
Description & # significant tests & % significant tests & OK/NOK \tabularnewline
1% type I error level & 0 & 0 & OK \tabularnewline
5% type I error level & 0 & 0 & OK \tabularnewline
10% type I error level & 0 & 0 & OK \tabularnewline
\hline
\end{tabular}
%Source: https://freestatistics.org/blog/index.php?pk=58235&T=6

[TABLE]
[ROW][C]Meta Analysis of Goldfeld-Quandt test for Heteroskedasticity[/C][/ROW]
[ROW][C]Description[/C][C]# significant tests[/C][C]% significant tests[/C][C]OK/NOK[/C][/ROW]
[ROW][C]1% type I error level[/C][C]0[/C][C]0[/C][C]OK[/C][/ROW]
[ROW][C]5% type I error level[/C][C]0[/C][C]0[/C][C]OK[/C][/ROW]
[ROW][C]10% type I error level[/C][C]0[/C][C]0[/C][C]OK[/C][/ROW]
[/TABLE]
Source: https://freestatistics.org/blog/index.php?pk=58235&T=6

Globally Unique Identifier (entire table): ba.freestatistics.org/blog/index.php?pk=58235&T=6

As an alternative you can also use a QR Code:  

The GUIDs for individual cells are displayed in the table below:

Meta Analysis of Goldfeld-Quandt test for Heteroskedasticity
Description# significant tests% significant testsOK/NOK
1% type I error level00OK
5% type I error level00OK
10% type I error level00OK


Parameters (Session):
Parameters (R input):
par1 = 1 ; par2 = Include Monthly Dummies ; par3 = Linear Trend ;
R code (references can be found in the software module):
library(lattice)
library(lmtest)
n25 <- 25 #minimum number of obs. for Goldfeld-Quandt test
par1 <- as.numeric(par1)
x <- t(y)
k <- length(x[1,])
n <- length(x[,1])
x1 <- cbind(x[,par1], x[,1:k!=par1])
mycolnames <- c(colnames(x)[par1], colnames(x)[1:k!=par1])
colnames(x1) <- mycolnames #colnames(x)[par1]
x <- x1
if (par3 == 'First Differences'){
x2 <- array(0, dim=c(n-1,k), dimnames=list(1:(n-1), paste('(1-B)',colnames(x),sep='')))
for (i in 1:n-1) {
for (j in 1:k) {
x2[i,j] <- x[i+1,j] - x[i,j]
}
}
x <- x2
}
if (par2 == 'Include Monthly Dummies'){
x2 <- array(0, dim=c(n,11), dimnames=list(1:n, paste('M', seq(1:11), sep ='')))
for (i in 1:11){
x2[seq(i,n,12),i] <- 1
}
x <- cbind(x, x2)
}
if (par2 == 'Include Quarterly Dummies'){
x2 <- array(0, dim=c(n,3), dimnames=list(1:n, paste('Q', seq(1:3), sep ='')))
for (i in 1:3){
x2[seq(i,n,4),i] <- 1
}
x <- cbind(x, x2)
}
k <- length(x[1,])
if (par3 == 'Linear Trend'){
x <- cbind(x, c(1:n))
colnames(x)[k+1] <- 't'
}
x
k <- length(x[1,])
df <- as.data.frame(x)
(mylm <- lm(df))
(mysum <- summary(mylm))
if (n > n25) {
kp3 <- k + 3
nmkm3 <- n - k - 3
gqarr <- array(NA, dim=c(nmkm3-kp3+1,3))
numgqtests <- 0
numsignificant1 <- 0
numsignificant5 <- 0
numsignificant10 <- 0
for (mypoint in kp3:nmkm3) {
j <- 0
numgqtests <- numgqtests + 1
for (myalt in c('greater', 'two.sided', 'less')) {
j <- j + 1
gqarr[mypoint-kp3+1,j] <- gqtest(mylm, point=mypoint, alternative=myalt)$p.value
}
if (gqarr[mypoint-kp3+1,2] < 0.01) numsignificant1 <- numsignificant1 + 1
if (gqarr[mypoint-kp3+1,2] < 0.05) numsignificant5 <- numsignificant5 + 1
if (gqarr[mypoint-kp3+1,2] < 0.10) numsignificant10 <- numsignificant10 + 1
}
gqarr
}
bitmap(file='test0.png')
plot(x[,1], type='l', main='Actuals and Interpolation', ylab='value of Actuals and Interpolation (dots)', xlab='time or index')
points(x[,1]-mysum$resid)
grid()
dev.off()
bitmap(file='test1.png')
plot(mysum$resid, type='b', pch=19, main='Residuals', ylab='value of Residuals', xlab='time or index')
grid()
dev.off()
bitmap(file='test2.png')
hist(mysum$resid, main='Residual Histogram', xlab='values of Residuals')
grid()
dev.off()
bitmap(file='test3.png')
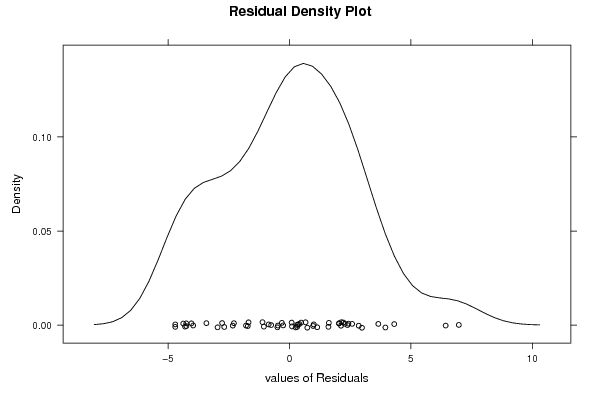
densityplot(~mysum$resid,col='black',main='Residual Density Plot', xlab='values of Residuals')
dev.off()
bitmap(file='test4.png')
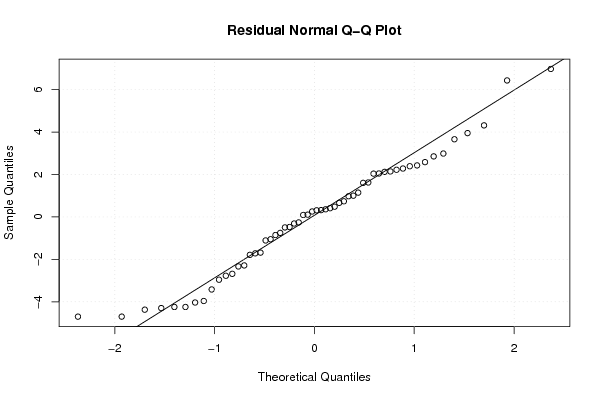
qqnorm(mysum$resid, main='Residual Normal Q-Q Plot')
qqline(mysum$resid)
grid()
dev.off()
(myerror <- as.ts(mysum$resid))
bitmap(file='test5.png')
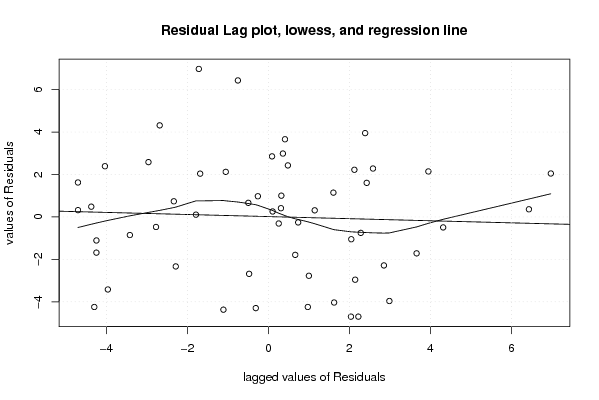
dum <- cbind(lag(myerror,k=1),myerror)
dum
dum1 <- dum[2:length(myerror),]
dum1
z <- as.data.frame(dum1)
z
plot(z,main=paste('Residual Lag plot, lowess, and regression line'), ylab='values of Residuals', xlab='lagged values of Residuals')
lines(lowess(z))
abline(lm(z))
grid()
dev.off()
bitmap(file='test6.png')
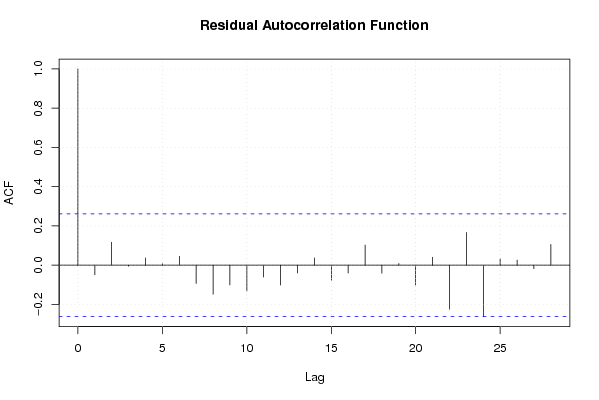
acf(mysum$resid, lag.max=length(mysum$resid)/2, main='Residual Autocorrelation Function')
grid()
dev.off()
bitmap(file='test7.png')
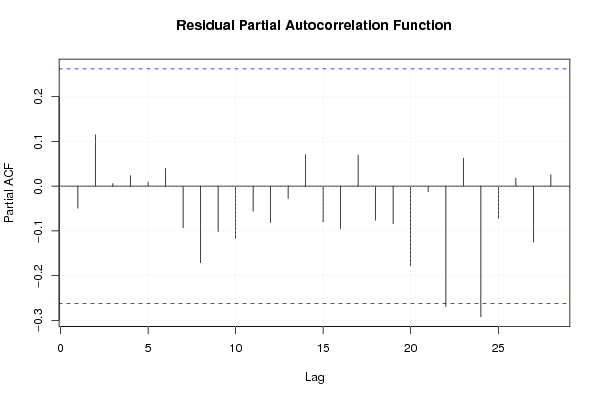
pacf(mysum$resid, lag.max=length(mysum$resid)/2, main='Residual Partial Autocorrelation Function')
grid()
dev.off()
bitmap(file='test8.png')
opar <- par(mfrow = c(2,2), oma = c(0, 0, 1.1, 0))
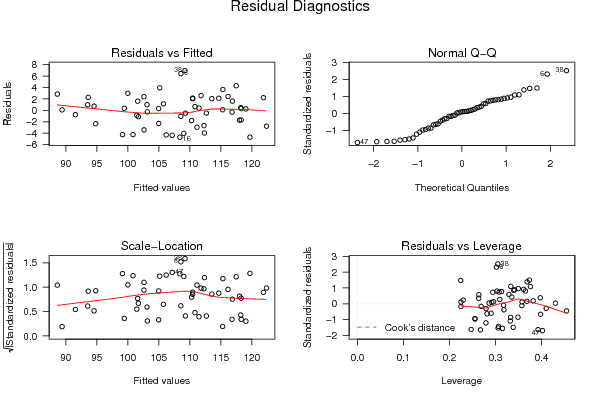
plot(mylm, las = 1, sub='Residual Diagnostics')
par(opar)
dev.off()
if (n > n25) {
bitmap(file='test9.png')
plot(kp3:nmkm3,gqarr[,2], main='Goldfeld-Quandt test',ylab='2-sided p-value',xlab='breakpoint')
grid()
dev.off()
}
load(file='createtable')
a<-table.start()
a<-table.row.start(a)
a<-table.element(a, 'Multiple Linear Regression - Estimated Regression Equation', 1, TRUE)
a<-table.row.end(a)
myeq <- colnames(x)[1]
myeq <- paste(myeq, '[t] = ', sep='')
for (i in 1:k){
if (mysum$coefficients[i,1] > 0) myeq <- paste(myeq, '+', '')
myeq <- paste(myeq, mysum$coefficients[i,1], sep=' ')
if (rownames(mysum$coefficients)[i] != '(Intercept)') {
myeq <- paste(myeq, rownames(mysum$coefficients)[i], sep='')
if (rownames(mysum$coefficients)[i] != 't') myeq <- paste(myeq, '[t]', sep='')
}
}
myeq <- paste(myeq, ' + e[t]')
a<-table.row.start(a)
a<-table.element(a, myeq)
a<-table.row.end(a)
a<-table.end(a)
table.save(a,file='mytable1.tab')
a<-table.start()
a<-table.row.start(a)
a<-table.element(a,hyperlink('ols1.htm','Multiple Linear Regression - Ordinary Least Squares',''), 6, TRUE)
a<-table.row.end(a)
a<-table.row.start(a)
a<-table.element(a,'Variable',header=TRUE)
a<-table.element(a,'Parameter',header=TRUE)
a<-table.element(a,'S.D.',header=TRUE)
a<-table.element(a,'T-STAT
H0: parameter = 0',header=TRUE)
a<-table.element(a,'2-tail p-value',header=TRUE)
a<-table.element(a,'1-tail p-value',header=TRUE)
a<-table.row.end(a)
for (i in 1:k){
a<-table.row.start(a)
a<-table.element(a,rownames(mysum$coefficients)[i],header=TRUE)
a<-table.element(a,mysum$coefficients[i,1])
a<-table.element(a, round(mysum$coefficients[i,2],6))
a<-table.element(a, round(mysum$coefficients[i,3],4))
a<-table.element(a, round(mysum$coefficients[i,4],6))
a<-table.element(a, round(mysum$coefficients[i,4]/2,6))
a<-table.row.end(a)
}
a<-table.end(a)
table.save(a,file='mytable2.tab')
a<-table.start()
a<-table.row.start(a)
a<-table.element(a, 'Multiple Linear Regression - Regression Statistics', 2, TRUE)
a<-table.row.end(a)
a<-table.row.start(a)
a<-table.element(a, 'Multiple R',1,TRUE)
a<-table.element(a, sqrt(mysum$r.squared))
a<-table.row.end(a)
a<-table.row.start(a)
a<-table.element(a, 'R-squared',1,TRUE)
a<-table.element(a, mysum$r.squared)
a<-table.row.end(a)
a<-table.row.start(a)
a<-table.element(a, 'Adjusted R-squared',1,TRUE)
a<-table.element(a, mysum$adj.r.squared)
a<-table.row.end(a)
a<-table.row.start(a)
a<-table.element(a, 'F-TEST (value)',1,TRUE)
a<-table.element(a, mysum$fstatistic[1])
a<-table.row.end(a)
a<-table.row.start(a)
a<-table.element(a, 'F-TEST (DF numerator)',1,TRUE)
a<-table.element(a, mysum$fstatistic[2])
a<-table.row.end(a)
a<-table.row.start(a)
a<-table.element(a, 'F-TEST (DF denominator)',1,TRUE)
a<-table.element(a, mysum$fstatistic[3])
a<-table.row.end(a)
a<-table.row.start(a)
a<-table.element(a, 'p-value',1,TRUE)
a<-table.element(a, 1-pf(mysum$fstatistic[1],mysum$fstatistic[2],mysum$fstatistic[3]))
a<-table.row.end(a)
a<-table.row.start(a)
a<-table.element(a, 'Multiple Linear Regression - Residual Statistics', 2, TRUE)
a<-table.row.end(a)
a<-table.row.start(a)
a<-table.element(a, 'Residual Standard Deviation',1,TRUE)
a<-table.element(a, mysum$sigma)
a<-table.row.end(a)
a<-table.row.start(a)
a<-table.element(a, 'Sum Squared Residuals',1,TRUE)
a<-table.element(a, sum(myerror*myerror))
a<-table.row.end(a)
a<-table.end(a)
table.save(a,file='mytable3.tab')
a<-table.start()
a<-table.row.start(a)
a<-table.element(a, 'Multiple Linear Regression - Actuals, Interpolation, and Residuals', 4, TRUE)
a<-table.row.end(a)
a<-table.row.start(a)
a<-table.element(a, 'Time or Index', 1, TRUE)
a<-table.element(a, 'Actuals', 1, TRUE)
a<-table.element(a, 'Interpolation
Forecast', 1, TRUE)
a<-table.element(a, 'Residuals
Prediction Error', 1, TRUE)
a<-table.row.end(a)
for (i in 1:n) {
a<-table.row.start(a)
a<-table.element(a,i, 1, TRUE)
a<-table.element(a,x[i])
a<-table.element(a,x[i]-mysum$resid[i])
a<-table.element(a,mysum$resid[i])
a<-table.row.end(a)
}
a<-table.end(a)
table.save(a,file='mytable4.tab')
if (n > n25) {
a<-table.start()
a<-table.row.start(a)
a<-table.element(a,'Goldfeld-Quandt test for Heteroskedasticity',4,TRUE)
a<-table.row.end(a)
a<-table.row.start(a)
a<-table.element(a,'p-values',header=TRUE)
a<-table.element(a,'Alternative Hypothesis',3,header=TRUE)
a<-table.row.end(a)
a<-table.row.start(a)
a<-table.element(a,'breakpoint index',header=TRUE)
a<-table.element(a,'greater',header=TRUE)
a<-table.element(a,'2-sided',header=TRUE)
a<-table.element(a,'less',header=TRUE)
a<-table.row.end(a)
for (mypoint in kp3:nmkm3) {
a<-table.row.start(a)
a<-table.element(a,mypoint,header=TRUE)
a<-table.element(a,gqarr[mypoint-kp3+1,1])
a<-table.element(a,gqarr[mypoint-kp3+1,2])
a<-table.element(a,gqarr[mypoint-kp3+1,3])
a<-table.row.end(a)
}
a<-table.end(a)
table.save(a,file='mytable5.tab')
a<-table.start()
a<-table.row.start(a)
a<-table.element(a,'Meta Analysis of Goldfeld-Quandt test for Heteroskedasticity',4,TRUE)
a<-table.row.end(a)
a<-table.row.start(a)
a<-table.element(a,'Description',header=TRUE)
a<-table.element(a,'# significant tests',header=TRUE)
a<-table.element(a,'% significant tests',header=TRUE)
a<-table.element(a,'OK/NOK',header=TRUE)
a<-table.row.end(a)
a<-table.row.start(a)
a<-table.element(a,'1% type I error level',header=TRUE)
a<-table.element(a,numsignificant1)
a<-table.element(a,numsignificant1/numgqtests)
if (numsignificant1/numgqtests < 0.01) dum <- 'OK' else dum <- 'NOK'
a<-table.element(a,dum)
a<-table.row.end(a)
a<-table.row.start(a)
a<-table.element(a,'5% type I error level',header=TRUE)
a<-table.element(a,numsignificant5)
a<-table.element(a,numsignificant5/numgqtests)
if (numsignificant5/numgqtests < 0.05) dum <- 'OK' else dum <- 'NOK'
a<-table.element(a,dum)
a<-table.row.end(a)
a<-table.row.start(a)
a<-table.element(a,'10% type I error level',header=TRUE)
a<-table.element(a,numsignificant10)
a<-table.element(a,numsignificant10/numgqtests)
if (numsignificant10/numgqtests < 0.1) dum <- 'OK' else dum <- 'NOK'
a<-table.element(a,dum)
a<-table.row.end(a)
a<-table.end(a)
table.save(a,file='mytable6.tab')
}