| Multiple Linear Regression - Estimated Regression Equation |
| Y[t] = + 77.4030165657879 + 0.541259094853539X[t] + e[t] |
| Multiple Linear Regression - Ordinary Least Squares | |||||
| Variable | Parameter | S.D. | T-STAT H0: parameter = 0 | 2-tail p-value | 1-tail p-value |
| (Intercept) | 77.4030165657879 | 6.113744 | 12.6605 | 0 | 0 |
| X | 0.541259094853539 | 0.082428 | 6.5664 | 0 | 0 |
| Multiple Linear Regression - Regression Statistics | |
| Multiple R | 0.649797303847281 |
| R-squared | 0.422236536087195 |
| Adjusted R-squared | 0.412443935003928 |
| F-TEST (value) | 43.1179144842988 |
| F-TEST (DF numerator) | 1 |
| F-TEST (DF denominator) | 59 |
| p-value | 1.45968518383555e-08 |
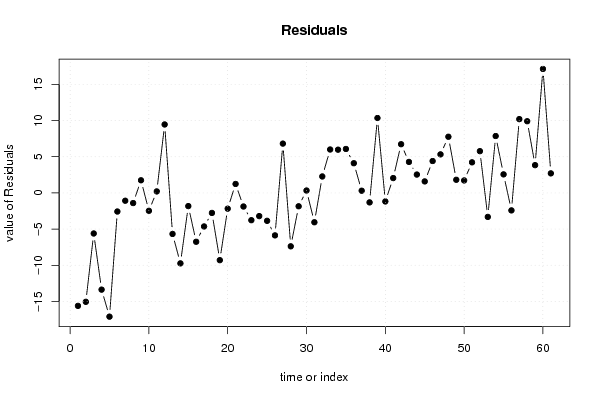
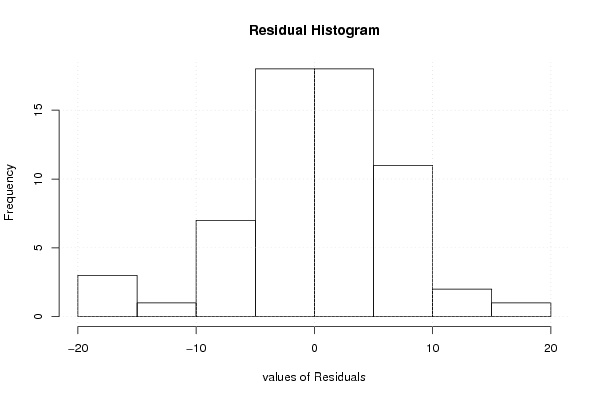
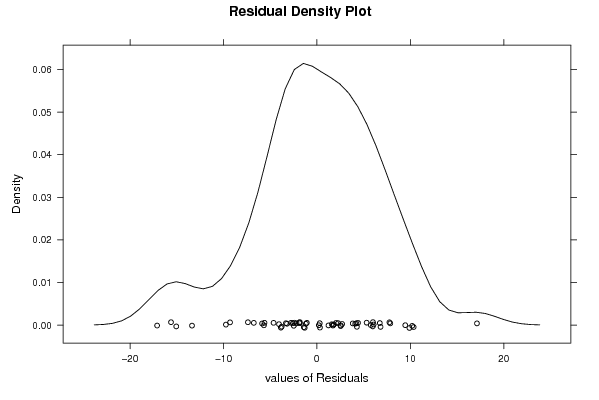
| Multiple Linear Regression - Residual Statistics | |
| Residual Standard Deviation | 6.7176759170251 |
| Sum Squared Residuals | 2662.50301384456 |
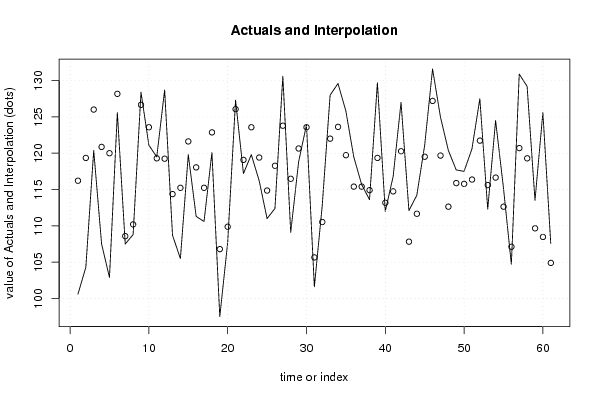
| Multiple Linear Regression - Actuals, Interpolation, and Residuals | |||
| Time or Index | Actuals | Interpolation Forecast | Residuals Prediction Error |
| 1 | 100.6 | 116.211293666786 | -15.6112936667864 |
| 2 | 104.3 | 119.350596416937 | -15.0505964169371 |
| 3 | 120.4 | 126.008083283636 | -5.60808328363562 |
| 4 | 107.5 | 120.866121882527 | -13.366121882527 |
| 5 | 102.9 | 120.000107330761 | -17.1001073307613 |
| 6 | 125.6 | 128.173119663050 | -2.57311966304978 |
| 7 | 107.5 | 108.579540429352 | -1.07954042935168 |
| 8 | 108.8 | 110.203317713912 | -1.4033177139123 |
| 9 | 128.4 | 126.65759419746 | 1.74240580254014 |
| 10 | 121.1 | 123.572417356795 | -2.47241735679470 |
| 11 | 119.5 | 119.296470507452 | 0.203529492548252 |
| 12 | 128.7 | 119.242344597966 | 9.4576554020336 |
| 13 | 108.7 | 114.371012744285 | -5.67101274428454 |
| 14 | 105.5 | 115.237027296050 | -9.7370272960502 |
| 15 | 119.8 | 121.623884615322 | -1.82388461532197 |
| 16 | 111.3 | 118.051574589289 | -6.7515745892886 |
| 17 | 110.6 | 115.237027296050 | -4.63702729605021 |
| 18 | 120.1 | 122.868780533485 | -2.76878053348511 |
| 19 | 97.5 | 106.793385416335 | -9.293385416335 |
| 20 | 107.7 | 109.878562257000 | -2.17856225700017 |
| 21 | 127.3 | 126.062209193121 | 1.23779080687902 |
| 22 | 117.2 | 119.079966869510 | -1.87996686951033 |
| 23 | 119.8 | 123.572417356795 | -3.7724173567947 |
| 24 | 116.2 | 119.404722326422 | -3.20472232642245 |
| 25 | 111 | 114.858145929653 | -3.85814592965273 |
| 26 | 112.4 | 118.26807822723 | -5.86807822723002 |
| 27 | 130.6 | 123.788920994736 | 6.81107900526388 |
| 28 | 109.1 | 116.481923214213 | -7.38192321421335 |
| 29 | 118.8 | 120.649618244586 | -1.84961824458560 |
| 30 | 123.9 | 123.572417356795 | 0.327582643205308 |
| 31 | 101.6 | 105.656741317143 | -4.05674131714258 |
| 32 | 112.8 | 110.528073170824 | 2.27192682917558 |
| 33 | 128 | 122.002765981719 | 5.99723401828056 |
| 34 | 129.6 | 123.62654326628 | 5.97345673371994 |
| 35 | 125.8 | 119.729477783335 | 6.07052221666542 |
| 36 | 119.5 | 115.399405024506 | 4.10059497549373 |
| 37 | 115.7 | 115.399405024506 | 0.300594975493734 |
| 38 | 113.6 | 114.912271839138 | -1.31227183913809 |
| 39 | 129.7 | 119.350596416937 | 10.3494035830629 |
| 40 | 112 | 113.180242735607 | -1.18024273560676 |
| 41 | 116.8 | 114.749894110682 | 2.05010588931798 |
| 42 | 127 | 120.270736878188 | 6.72926312181188 |
| 43 | 112.1 | 107.821777696557 | 4.27822230344327 |
| 44 | 114.2 | 111.664717270017 | 2.53528272998315 |
| 45 | 121.1 | 119.512974145393 | 1.58702585460684 |
| 46 | 131.6 | 127.198853292313 | 4.40114670768659 |
| 47 | 125 | 119.675351873849 | 5.32464812615078 |
| 48 | 120.4 | 112.638983640753 | 7.76101635924679 |
| 49 | 117.7 | 115.886538209874 | 1.81346179012555 |
| 50 | 117.5 | 115.778286390904 | 1.72171360909625 |
| 51 | 120.6 | 116.373671395243 | 4.22632860475736 |
| 52 | 127.5 | 121.732136434293 | 5.76786356570733 |
| 53 | 112.3 | 115.615908662448 | -3.31590866244768 |
| 54 | 124.5 | 116.644300942669 | 7.8556990573306 |
| 55 | 115.2 | 112.638983640753 | 2.56101635924679 |
| 56 | 104.7 | 107.118140873247 | -2.41814087324712 |
| 57 | 130.9 | 120.703744154071 | 10.1962558459291 |
| 58 | 129.2 | 119.296470507452 | 9.90352949254824 |
| 59 | 113.5 | 109.662058619059 | 3.83794138094124 |
| 60 | 125.6 | 108.471288610381 | 17.1287113896190 |
| 61 | 107.6 | 104.898978584348 | 2.70102141565238 |
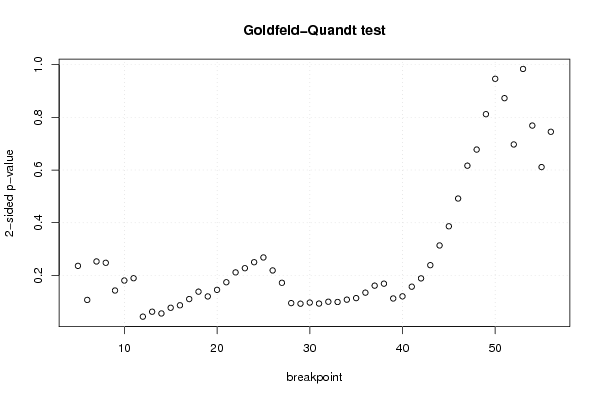
| Goldfeld-Quandt test for Heteroskedasticity | |||
| p-values | Alternative Hypothesis | ||
| breakpoint index | greater | 2-sided | less |
| 5 | 0.118008709415478 | 0.236017418830957 | 0.881991290584522 |
| 6 | 0.0534200597175088 | 0.106840119435018 | 0.946579940282491 |
| 7 | 0.87356148755858 | 0.252877024882839 | 0.126438512441420 |
| 8 | 0.876121694500243 | 0.247756610999514 | 0.123878305499757 |
| 9 | 0.9287033442312 | 0.142593311537601 | 0.0712966557688003 |
| 10 | 0.909765471295201 | 0.180469057409597 | 0.0902345287047985 |
| 11 | 0.905374079427813 | 0.189251841144375 | 0.0946259205721875 |
| 12 | 0.978355543304264 | 0.0432889133914725 | 0.0216444566957362 |
| 13 | 0.969013922788776 | 0.0619721544224487 | 0.0309860772112244 |
| 14 | 0.972283529461703 | 0.055432941076594 | 0.027716470538297 |
| 15 | 0.961493034103224 | 0.0770139317935523 | 0.0385069658967761 |
| 16 | 0.956783243125092 | 0.0864335137498163 | 0.0432167568749082 |
| 17 | 0.944957481865735 | 0.110085036268530 | 0.0550425181342651 |
| 18 | 0.93095397164798 | 0.138092056704042 | 0.0690460283520208 |
| 19 | 0.939941416270355 | 0.120117167459291 | 0.0600585837296455 |
| 20 | 0.927489104313446 | 0.145021791373107 | 0.0725108956865537 |
| 21 | 0.913052628441025 | 0.173894743117949 | 0.0869473715589746 |
| 22 | 0.894346284571123 | 0.211307430857755 | 0.105653715428877 |
| 23 | 0.88637951056158 | 0.227240978876839 | 0.113620489438420 |
| 24 | 0.87502817374044 | 0.249943652519118 | 0.124971826259559 |
| 25 | 0.865976484835748 | 0.268047030328504 | 0.134023515164252 |
| 26 | 0.890621792097697 | 0.218756415804605 | 0.109378207902303 |
| 27 | 0.914091193631702 | 0.171817612736596 | 0.0859088063682979 |
| 28 | 0.952634862032532 | 0.094730275934937 | 0.0473651379674685 |
| 29 | 0.953775815579376 | 0.0924483688412488 | 0.0462241844206244 |
| 30 | 0.951615128286206 | 0.0967697434275888 | 0.0483848717137944 |
| 31 | 0.953523686938176 | 0.0929526261236482 | 0.0464763130618241 |
| 32 | 0.950029308572578 | 0.0999413828548432 | 0.0499706914274216 |
| 33 | 0.950481580047045 | 0.0990368399059101 | 0.0495184199529551 |
| 34 | 0.946111632309627 | 0.107776735380746 | 0.0538883676903731 |
| 35 | 0.943131093851776 | 0.113737812296449 | 0.0568689061482243 |
| 36 | 0.932796755375457 | 0.134406489249087 | 0.0672032446245435 |
| 37 | 0.919497414666218 | 0.161005170667563 | 0.0805025853337815 |
| 38 | 0.915745724188857 | 0.168508551622285 | 0.0842542758111427 |
| 39 | 0.94385008572411 | 0.112299828551783 | 0.0561499142758913 |
| 40 | 0.939735968523446 | 0.120528062953108 | 0.0602640314765539 |
| 41 | 0.921501697587372 | 0.156996604825257 | 0.0784983024126284 |
| 42 | 0.905687735684488 | 0.188624528631024 | 0.094312264315512 |
| 43 | 0.880641081957323 | 0.238717836085355 | 0.119358918042677 |
| 44 | 0.843197421614642 | 0.313605156770716 | 0.156802578385358 |
| 45 | 0.806817491098507 | 0.386365017802987 | 0.193182508901493 |
| 46 | 0.754138805729371 | 0.491722388541257 | 0.245861194270629 |
| 47 | 0.691772013244247 | 0.616455973511506 | 0.308227986755753 |
| 48 | 0.661168111474262 | 0.677663777051476 | 0.338831888525738 |
| 49 | 0.59400084240975 | 0.8119983151805 | 0.40599915759025 |
| 50 | 0.526848635453644 | 0.946302729092712 | 0.473151364546356 |
| 51 | 0.436391668756762 | 0.872783337513524 | 0.563608331243238 |
| 52 | 0.348492628908404 | 0.696985257816808 | 0.651507371091596 |
| 53 | 0.491849232656592 | 0.983698465313184 | 0.508150767343408 |
| 54 | 0.38439282471508 | 0.76878564943016 | 0.61560717528492 |
| 55 | 0.305549231081619 | 0.611098462163237 | 0.694450768918381 |
| 56 | 0.37258091157498 | 0.74516182314996 | 0.62741908842502 |
| Meta Analysis of Goldfeld-Quandt test for Heteroskedasticity | |||
| Description | # significant tests | % significant tests | OK/NOK |
| 1% type I error level | 0 | 0 | OK |
| 5% type I error level | 1 | 0.0192307692307692 | OK |
| 10% type I error level | 11 | 0.211538461538462 | NOK |