| Multiple Linear Regression - Estimated Regression Equation |
| y[t] = + 20183.8908363885 + 4420.45606204759x[t] + 1.07278534683268y1[t] -0.128942160563676y4[t] -431.278490014834M1[t] -4299.96610657626M2[t] -7684.23161222854M3[t] -5830.93324768869M4[t] -8608.0669432388M5[t] -4351.97049942333M6[t] + 18422.3835583305M7[t] -2290.05787685714M8[t] -6937.72173064447M9[t] -11912.1094256655M10[t] -8764.12912603719M11[t] -67.3332347975218t + e[t] |
| Multiple Linear Regression - Ordinary Least Squares | |||||
| Variable | Parameter | S.D. | T-STAT H0: parameter = 0 | 2-tail p-value | 1-tail p-value |
| (Intercept) | 20183.8908363885 | 9546.436481 | 2.1143 | 0.039305 | 0.019652 |
| x | 4420.45606204759 | 1933.254625 | 2.2865 | 0.026325 | 0.013163 |
| y1 | 1.07278534683268 | 0.073851 | 14.5264 | 0 | 0 |
| y4 | -0.128942160563676 | 0.078557 | -1.6414 | 0.106752 | 0.053376 |
| M1 | -431.278490014834 | 2018.035954 | -0.2137 | 0.831607 | 0.415804 |
| M2 | -4299.96610657626 | 2159.582509 | -1.9911 | 0.051735 | 0.025867 |
| M3 | -7684.23161222854 | 2360.116241 | -3.2559 | 0.001992 | 0.000996 |
| M4 | -5830.93324768869 | 2160.531412 | -2.6988 | 0.009363 | 0.004681 |
| M5 | -8608.0669432388 | 2059.70848 | -4.1793 | 0.000112 | 5.6e-05 |
| M6 | -4351.97049942333 | 2020.839733 | -2.1535 | 0.035933 | 0.017967 |
| M7 | 18422.3835583305 | 2046.670279 | 9.0011 | 0 | 0 |
| M8 | -2290.05787685714 | 2684.606209 | -0.853 | 0.397553 | 0.198777 |
| M9 | -6937.72173064447 | 3251.784405 | -2.1335 | 0.03762 | 0.01881 |
| M10 | -11912.1094256655 | 3395.39403 | -3.5083 | 0.000939 | 0.00047 |
| M11 | -8764.12912603719 | 2182.651035 | -4.0154 | 0.000192 | 9.6e-05 |
| t | -67.3332347975218 | 33.724977 | -1.9965 | 0.051123 | 0.025561 |
| Multiple Linear Regression - Regression Statistics | |
| Multiple R | 0.985621546213983 |
| R-squared | 0.971449832361242 |
| Adjusted R-squared | 0.963214207080831 |
| F-TEST (value) | 117.957021997093 |
| F-TEST (DF numerator) | 15 |
| F-TEST (DF denominator) | 52 |
| p-value | 0 |
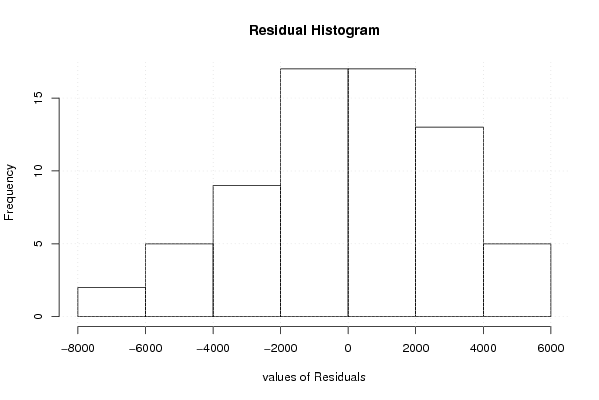
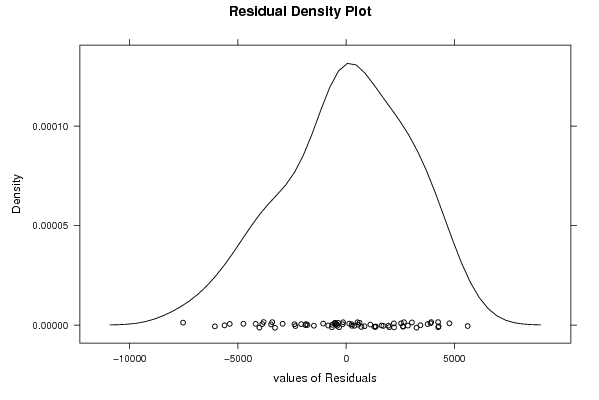
| Multiple Linear Regression - Residual Statistics | |
| Residual Standard Deviation | 3303.31748786203 |
| Sum Squared Residuals | 567419134.131984 |
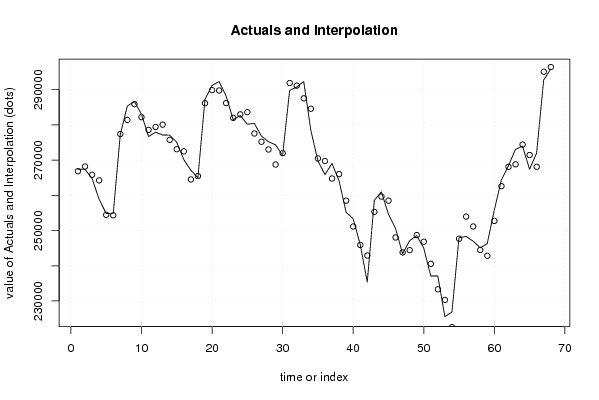
| Multiple Linear Regression - Actuals, Interpolation, and Residuals | |||
| Time or Index | Actuals | Interpolation Forecast | Residuals Prediction Error |
| 1 | 267413 | 266858.605583522 | 554.394416478448 |
| 2 | 267366 | 268193.678482343 | -827.678482342807 |
| 3 | 264777 | 265842.338671462 | -1065.33867146211 |
| 4 | 258863 | 264244.834383605 | -5381.83438360534 |
| 5 | 254844 | 254462.780973496 | 381.219026503680 |
| 6 | 254868 | 254346.08015514 | 521.919844859791 |
| 7 | 277267 | 277412.67908012 | -145.679080119890 |
| 8 | 285351 | 281424.787331414 | 3926.21266858648 |
| 9 | 286602 | 285900.405529929 | 701.594470070513 |
| 10 | 283042 | 282197.644457145 | 844.35554285488 |
| 11 | 276687 | 278571.000232786 | -1884.00023278576 |
| 12 | 277915 | 279407.876818907 | -1492.87681890696 |
| 13 | 277128 | 280065.33885714 | -2937.33885713999 |
| 14 | 277103 | 275744.070029430 | 1358.92997056959 |
| 15 | 275037 | 273085.079085692 | 1951.92091430805 |
| 16 | 270150 | 272496.328715706 | -2346.32871570576 |
| 17 | 267140 | 264510.637275750 | 2629.36272424957 |
| 18 | 264993 | 265473.540144816 | -480.54014481609 |
| 19 | 287259 | 286143.685331847 | 1115.31466815279 |
| 20 | 291186 | 289880.689533113 | 1305.31046688680 |
| 21 | 292300 | 289766.636404837 | 2533.36359516304 |
| 22 | 288186 | 286196.837170120 | 1989.16282987976 |
| 23 | 281477 | 281993.019170971 | -516.019170970558 |
| 24 | 282656 | 282986.142305776 | -330.142305776204 |
| 25 | 280190 | 283608.702938012 | -3418.70293801165 |
| 26 | 280408 | 277557.661469922 | 2850.33853007773 |
| 27 | 276836 | 275205.002890304 | 1630.99710969631 |
| 28 | 275216 | 273006.955953855 | 2209.04404614490 |
| 29 | 274352 | 268742.548129589 | 5609.45187041144 |
| 30 | 271311 | 271976.31540794 | -665.315407940186 |
| 31 | 289802 | 291881.577388712 | -2079.57738871178 |
| 32 | 290726 | 291147.562867123 | -421.562867122867 |
| 33 | 292300 | 287535.225465738 | 4764.77453426157 |
| 34 | 278506 | 284574.181782109 | -6068.18178210868 |
| 35 | 269826 | 270472.558281747 | -646.558281746506 |
| 36 | 265861 | 269738.434806118 | -3877.43480611765 |
| 37 | 269034 | 264783.274220386 | 4250.72577961351 |
| 38 | 264176 | 266029.829437343 | -1853.82943734299 |
| 39 | 255198 | 258485.857435673 | -3287.85743567272 |
| 40 | 253353 | 251151.611388186 | 2201.38861181379 |
| 41 | 246057 | 245918.722017464 | 138.277982536256 |
| 42 | 235372 | 242906.844352009 | -7534.84435200876 |
| 43 | 258556 | 255308.796461599 | 3247.20353840141 |
| 44 | 260993 | 259638.375558822 | 1354.62444117772 |
| 45 | 254663 | 258478.518363941 | -3815.51836394125 |
| 46 | 250643 | 248023.813174295 | 2619.18682570528 |
| 47 | 243422 | 243802.46809435 | -380.468094349849 |
| 48 | 247105 | 244438.448950817 | 2666.55104918297 |
| 49 | 248541 | 248707.109534758 | -166.109534757523 |
| 50 | 245039 | 246829.955926916 | -1790.95592691628 |
| 51 | 237080 | 240552.554243289 | -3472.55424328873 |
| 52 | 237085 | 233325.326820234 | 3759.67317976628 |
| 53 | 225554 | 230301.062874051 | -4747.06287405083 |
| 54 | 226839 | 222571.093695035 | 4267.9063049649 |
| 55 | 247934 | 247682.894344598 | 251.105655402272 |
| 56 | 248333 | 253953.337917293 | -5620.33791729274 |
| 57 | 246969 | 251153.214235554 | -4184.21423555387 |
| 58 | 245098 | 244482.523416331 | 615.476583668764 |
| 59 | 246263 | 242835.954220147 | 3427.04577985268 |
| 60 | 255765 | 252731.097118382 | 3033.90288161785 |
| 61 | 264319 | 262601.968866183 | 1717.03113381720 |
| 62 | 268347 | 268083.804654045 | 263.19534595475 |
| 63 | 273046 | 268803.167673581 | 4242.8323264192 |
| 64 | 273963 | 274404.942738414 | -441.942738413858 |
| 65 | 267430 | 271441.24872965 | -4011.24872965012 |
| 66 | 271993 | 268102.126245060 | 3890.87375494034 |
| 67 | 292710 | 295098.367393125 | -2388.3673931248 |
| 68 | 295881 | 296425.246792235 | -544.246792235398 |
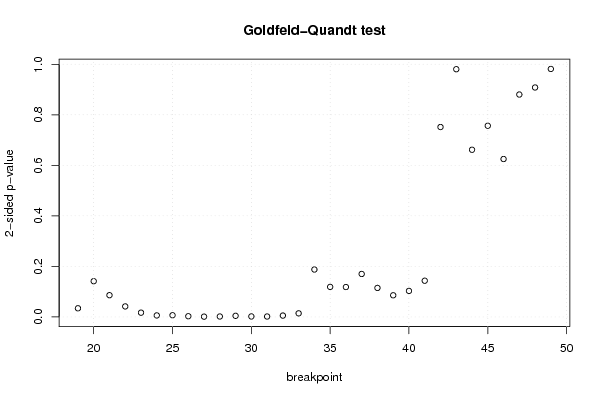
| Goldfeld-Quandt test for Heteroskedasticity | |||
| p-values | Alternative Hypothesis | ||
| breakpoint index | greater | 2-sided | less |
| 19 | 0.0170914526508557 | 0.0341829053017114 | 0.982908547349144 |
| 20 | 0.0706844224037705 | 0.141368844807541 | 0.92931557759623 |
| 21 | 0.0429904510758182 | 0.0859809021516364 | 0.957009548924182 |
| 22 | 0.0207952243827509 | 0.0415904487655018 | 0.97920477561725 |
| 23 | 0.00843768952783331 | 0.0168753790556666 | 0.991562310472167 |
| 24 | 0.00294948500473889 | 0.00589897000947777 | 0.997050514995261 |
| 25 | 0.00333756549116453 | 0.00667513098232906 | 0.996662434508836 |
| 26 | 0.00137273597756269 | 0.00274547195512539 | 0.998627264022437 |
| 27 | 0.000540342691815725 | 0.00108068538363145 | 0.999459657308184 |
| 28 | 0.00085613879615001 | 0.00171227759230002 | 0.99914386120385 |
| 29 | 0.00219149455709473 | 0.00438298911418946 | 0.997808505442905 |
| 30 | 0.000964058387817218 | 0.00192811677563444 | 0.999035941612183 |
| 31 | 0.000816063436217151 | 0.00163212687243430 | 0.999183936563783 |
| 32 | 0.00267520203552088 | 0.00535040407104176 | 0.997324797964479 |
| 33 | 0.00709851440769193 | 0.0141970288153839 | 0.992901485592308 |
| 34 | 0.0938021356735913 | 0.187604271347183 | 0.906197864326409 |
| 35 | 0.0593867115559281 | 0.118773423111856 | 0.940613288444072 |
| 36 | 0.0591410939852005 | 0.118282187970401 | 0.9408589060148 |
| 37 | 0.0850138359867299 | 0.170027671973460 | 0.91498616401327 |
| 38 | 0.057368782566079 | 0.114737565132158 | 0.94263121743392 |
| 39 | 0.0428196121240415 | 0.085639224248083 | 0.957180387875958 |
| 40 | 0.0514371927909442 | 0.102874385581888 | 0.948562807209056 |
| 41 | 0.0716367205460333 | 0.143273441092067 | 0.928363279453967 |
| 42 | 0.375774902245328 | 0.751549804490656 | 0.624225097754672 |
| 43 | 0.490208769455847 | 0.980417538911694 | 0.509791230544153 |
| 44 | 0.669212421538788 | 0.661575156922424 | 0.330787578461212 |
| 45 | 0.621742369356011 | 0.756515261287978 | 0.378257630643989 |
| 46 | 0.687528830931524 | 0.624942338136952 | 0.312471169068476 |
| 47 | 0.559921334964295 | 0.88015733007141 | 0.440078665035705 |
| 48 | 0.545984299359196 | 0.908031401281608 | 0.454015700640804 |
| 49 | 0.509296013761324 | 0.981407972477351 | 0.490703986238676 |
| Meta Analysis of Goldfeld-Quandt test for Heteroskedasticity | |||
| Description | # significant tests | % significant tests | OK/NOK |
| 1% type I error level | 9 | 0.290322580645161 | NOK |
| 5% type I error level | 13 | 0.419354838709677 | NOK |
| 10% type I error level | 15 | 0.483870967741935 | NOK |