| Multiple Linear Regression - Estimated Regression Equation |
| Y[t] = + 8.0159995930798 -0.396793923176626X[t] + 0.429040951968163Y1[t] + 0.117021660229381Y2[t] + 0.0321909561234374Y3[t] + 0.0338671313400513Y4[t] + 0.522084696539833M1[t] + 1.60881904762785M2[t] + 0.429102182903779M3[t] + 1.21952238869631M4[t] -0.0690080080649838M5[t] + 0.0599839230344053M6[t] + 0.21231296050147M7[t] + 0.870779207535017M8[t] + 0.429799214978465M9[t] + 2.35819701640652M10[t] + 0.84752047137127M11[t] -0.027329651821742t + e[t] |
| Multiple Linear Regression - Ordinary Least Squares | |||||
| Variable | Parameter | S.D. | T-STAT H0: parameter = 0 | 2-tail p-value | 1-tail p-value |
| (Intercept) | 8.0159995930798 | 3.519316 | 2.2777 | 0.027053 | 0.013527 |
| X | -0.396793923176626 | 0.640905 | -0.6191 | 0.538651 | 0.269326 |
| Y1 | 0.429040951968163 | 0.142421 | 3.0125 | 0.004058 | 0.002029 |
| Y2 | 0.117021660229381 | 0.150743 | 0.7763 | 0.44123 | 0.220615 |
| Y3 | 0.0321909561234374 | 0.152593 | 0.211 | 0.833776 | 0.416888 |
| Y4 | 0.0338671313400513 | 0.143065 | 0.2367 | 0.813837 | 0.406918 |
| M1 | 0.522084696539833 | 0.907111 | 0.5755 | 0.567503 | 0.283752 |
| M2 | 1.60881904762785 | 0.891956 | 1.8037 | 0.077305 | 0.038652 |
| M3 | 0.429102182903779 | 0.865743 | 0.4956 | 0.622316 | 0.311158 |
| M4 | 1.21952238869631 | 0.829226 | 1.4707 | 0.147644 | 0.073822 |
| M5 | -0.0690080080649838 | 0.884278 | -0.078 | 0.938109 | 0.469054 |
| M6 | 0.0599839230344053 | 0.850947 | 0.0705 | 0.944084 | 0.472042 |
| M7 | 0.21231296050147 | 0.899826 | 0.2359 | 0.814436 | 0.407218 |
| M8 | 0.870779207535017 | 0.886825 | 0.9819 | 0.330874 | 0.165437 |
| M9 | 0.429799214978465 | 0.905179 | 0.4748 | 0.636981 | 0.31849 |
| M10 | 2.35819701640652 | 0.877821 | 2.6864 | 0.009778 | 0.004889 |
| M11 | 0.84752047137127 | 0.930227 | 0.9111 | 0.36662 | 0.18331 |
| t | -0.027329651821742 | 0.018785 | -1.4549 | 0.151948 | 0.075974 |
| Multiple Linear Regression - Regression Statistics | |
| Multiple R | 0.86441380380356 |
| R-squared | 0.747211224206141 |
| Adjusted R-squared | 0.661263040436229 |
| F-TEST (value) | 8.69374071017563 |
| F-TEST (DF numerator) | 17 |
| F-TEST (DF denominator) | 50 |
| p-value | 1.00810626513237e-09 |
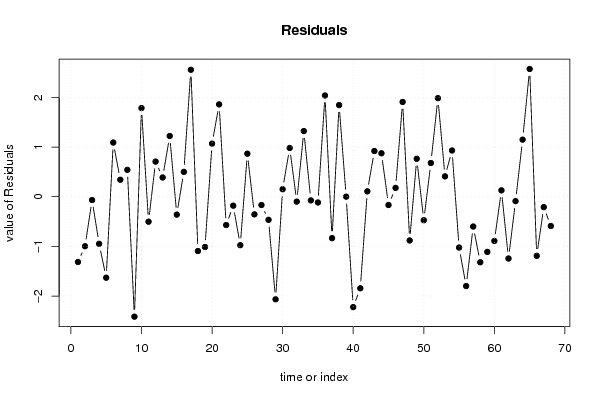
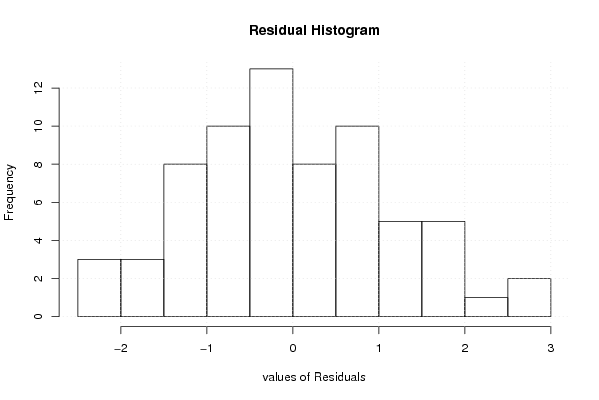
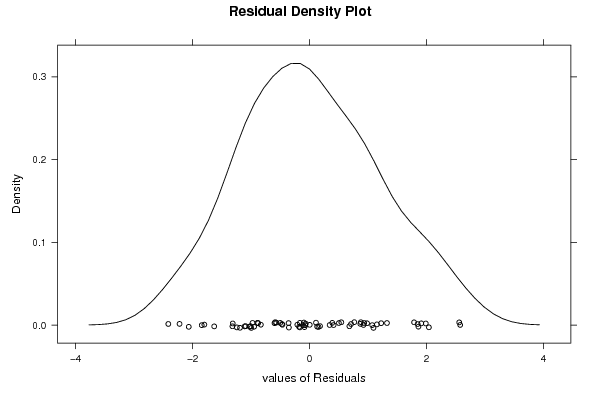
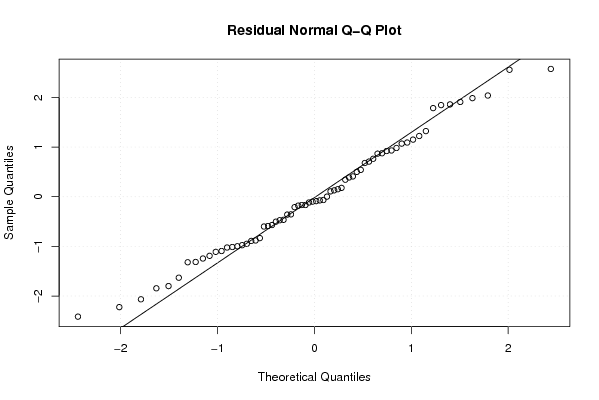
| Multiple Linear Regression - Residual Statistics | |
| Residual Standard Deviation | 1.35086548652037 |
| Sum Squared Residuals | 91.2418781335953 |
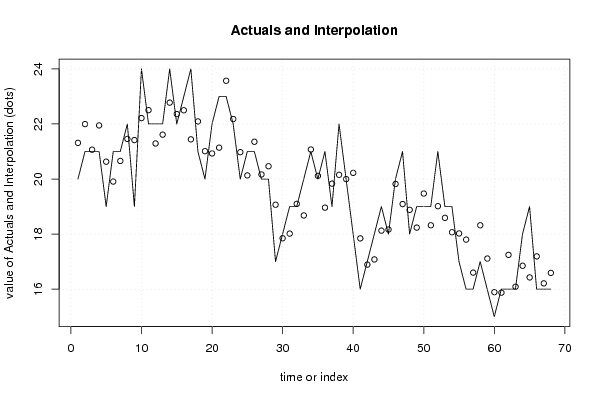
| Multiple Linear Regression - Actuals, Interpolation, and Residuals | |||
| Time or Index | Actuals | Interpolation Forecast | Residuals Prediction Error |
| 1 | 20 | 21.3143257579137 | -1.31432575791368 |
| 2 | 21 | 21.9973292531943 | -0.997329253194314 |
| 3 | 21 | 21.0667587218306 | -0.0667587218305936 |
| 4 | 21 | 21.9485471112474 | -0.948547111247382 |
| 5 | 19 | 20.6310108874477 | -1.63101088744773 |
| 6 | 21 | 19.9084583941291 | 1.09154160587090 |
| 7 | 21 | 20.657496363252 | 0.342503636748009 |
| 8 | 22 | 21.4582943666757 | 0.541705633324316 |
| 9 | 19 | 21.4156733238323 | -2.41567332383232 |
| 10 | 24 | 22.2143745404436 | 1.78562545955636 |
| 11 | 22 | 22.5026990788628 | -0.502699078862749 |
| 12 | 22 | 21.2921696158501 | 0.707830384149943 |
| 13 | 22 | 21.6122347267064 | 0.387765273293582 |
| 14 | 24 | 22.7765931704261 | 1.22340682957392 |
| 15 | 22 | 22.3598942951365 | -0.359894295136486 |
| 16 | 23 | 22.4989462656297 | 0.501053734370291 |
| 17 | 24 | 21.4424657608030 | 2.55753423919705 |
| 18 | 21 | 22.0935430027114 | -1.09354300271137 |
| 19 | 20 | 21.0128978861249 | -1.01289788612492 |
| 20 | 22 | 20.9299866361439 | 1.07001336385609 |
| 21 | 23 | 21.1400314984423 | 1.85996850155770 |
| 22 | 23 | 23.5703915703319 | -0.570391570331944 |
| 23 | 22 | 22.1799218146112 | -0.179921814611156 |
| 24 | 20 | 20.9759559582535 | -0.97595595825352 |
| 25 | 21 | 20.1326806469693 | 0.867319353030671 |
| 26 | 21 | 21.3548920216216 | -0.35489202162157 |
| 27 | 20 | 20.1666181217182 | -0.166618121718209 |
| 28 | 20 | 20.4651244171642 | -0.465124417164170 |
| 29 | 17 | 19.0661098396918 | -2.06610983969180 |
| 30 | 18 | 17.8484583069415 | 0.151541693058476 |
| 31 | 19 | 18.0175665325268 | 0.982433467473184 |
| 32 | 19 | 19.0981928715659 | -0.098192871565853 |
| 33 | 20 | 18.6774944495202 | 1.32250555047978 |
| 34 | 21 | 21.0736616385582 | -0.0736616385581894 |
| 35 | 20 | 20.1155851852388 | -0.115585185238791 |
| 36 | 21 | 18.9609067264304 | 2.03909327356957 |
| 37 | 19 | 19.8337391503508 | -0.833739150350797 |
| 38 | 22 | 20.1537597811267 | 1.84624021887326 |
| 39 | 20 | 19.9981166248100 | 0.00188337518995838 |
| 40 | 18 | 20.2236754746258 | -2.22367547462582 |
| 41 | 16 | 17.8445288073379 | -1.84452880733791 |
| 42 | 17 | 16.8912853439937 | 0.108714656006254 |
| 43 | 18 | 17.0791661862215 | 0.920833813778507 |
| 44 | 19 | 18.1242492187039 | 0.875750781296134 |
| 45 | 18 | 18.1664588799664 | -0.166458879966450 |
| 46 | 20 | 19.8215658252975 | 0.17843417470253 |
| 47 | 21 | 19.0906779596109 | 1.90932204038909 |
| 48 | 18 | 18.8805882840614 | -0.880588284061438 |
| 49 | 19 | 18.2357569140112 | 0.764243085988755 |
| 50 | 19 | 19.4730628033611 | -0.473062803361084 |
| 51 | 19 | 18.3203322100144 | 0.679667789985612 |
| 52 | 21 | 19.0140123260885 | 1.98598767391154 |
| 53 | 19 | 18.5901013127818 | 0.409898687218198 |
| 54 | 19 | 18.0677250085819 | 0.932274991418116 |
| 55 | 17 | 18.0230629860153 | -1.02306298601532 |
| 56 | 16 | 17.7994700277240 | -1.79947002772403 |
| 57 | 16 | 16.6003418482387 | -0.600341848238704 |
| 58 | 17 | 18.3200064253688 | -1.32000642536876 |
| 59 | 16 | 17.1111159616764 | -1.11111596167639 |
| 60 | 15 | 15.8903794154045 | -0.890379415404548 |
| 61 | 16 | 15.8712628040485 | 0.128737195951467 |
| 62 | 16 | 17.2443629702702 | -1.24436297027021 |
| 63 | 16 | 16.0882800264903 | -0.0882800264902834 |
| 64 | 18 | 16.8496944052445 | 1.15030559475554 |
| 65 | 19 | 16.4257833919378 | 2.5742166080622 |
| 66 | 16 | 17.1905299436424 | -1.19052994364237 |
| 67 | 16 | 16.2098100458595 | -0.209810045859461 |
| 68 | 16 | 16.5898068791867 | -0.589806879186663 |
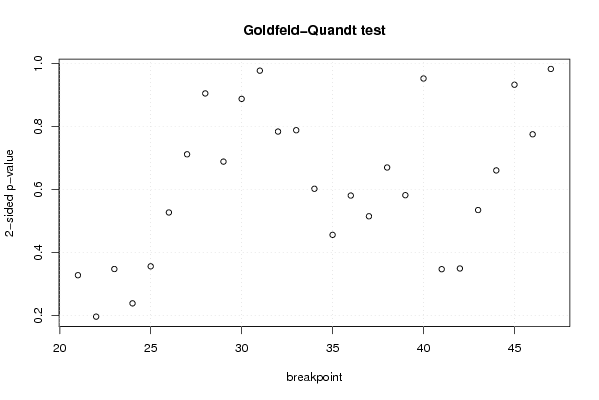
| Goldfeld-Quandt test for Heteroskedasticity | |||
| p-values | Alternative Hypothesis | ||
| breakpoint index | greater | 2-sided | less |
| 21 | 0.83601316536837 | 0.327973669263261 | 0.163986834631631 |
| 22 | 0.901851186682881 | 0.196297626634237 | 0.0981488133171186 |
| 23 | 0.826218909914364 | 0.347562180171272 | 0.173781090085636 |
| 24 | 0.880699403610114 | 0.238601192779772 | 0.119300596389886 |
| 25 | 0.821918100302104 | 0.356163799395791 | 0.178081899697896 |
| 26 | 0.736375071406229 | 0.527249857187542 | 0.263624928593771 |
| 27 | 0.643959049079458 | 0.712081901841083 | 0.356040950920542 |
| 28 | 0.547278452790011 | 0.905443094419978 | 0.452721547209989 |
| 29 | 0.655619766842733 | 0.688760466314534 | 0.344380233157267 |
| 30 | 0.555932586749274 | 0.888134826501452 | 0.444067413250726 |
| 31 | 0.488856418410922 | 0.977712836821843 | 0.511143581589078 |
| 32 | 0.392139168691886 | 0.784278337383773 | 0.607860831308114 |
| 33 | 0.394277599306861 | 0.788555198613722 | 0.605722400693139 |
| 34 | 0.301268986327637 | 0.602537972655274 | 0.698731013672363 |
| 35 | 0.228081144184266 | 0.456162288368532 | 0.771918855815734 |
| 36 | 0.290500054001188 | 0.581000108002376 | 0.709499945998812 |
| 37 | 0.257595714790649 | 0.515191429581298 | 0.742404285209351 |
| 38 | 0.335071763784689 | 0.670143527569377 | 0.664928236215311 |
| 39 | 0.291072515642083 | 0.582145031284165 | 0.708927484357917 |
| 40 | 0.476422235401031 | 0.952844470802063 | 0.523577764598969 |
| 41 | 0.826460581151675 | 0.347078837696650 | 0.173539418848325 |
| 42 | 0.825332886951502 | 0.349334226096995 | 0.174667113048498 |
| 43 | 0.732528246636192 | 0.534943506727615 | 0.267471753363808 |
| 44 | 0.669570581778412 | 0.660858836443175 | 0.330429418221588 |
| 45 | 0.533483626895273 | 0.933032746209453 | 0.466516373104727 |
| 46 | 0.387785654916564 | 0.775571309833127 | 0.612214345083437 |
| 47 | 0.508406167616343 | 0.983187664767314 | 0.491593832383657 |
| Meta Analysis of Goldfeld-Quandt test for Heteroskedasticity | |||
| Description | # significant tests | % significant tests | OK/NOK |
| 1% type I error level | 0 | 0 | OK |
| 5% type I error level | 0 | 0 | OK |
| 10% type I error level | 0 | 0 | OK |