| Multiple Linear Regression - Estimated Regression Equation |
| Invoer/inflatie[t] = + 54.4678682869157 + 19736.9890382847`Uitvoer/inflatie`[t] -4260.49052841623Inflatie[t] -2600.41110213936M1[t] + 511.415961808663M2[t] + 397.466380062199M3[t] -191.940314138286M4[t] -1531.96966104220M5[t] -844.712461834646M6[t] -671.981889680457M7[t] + 400.300576732874M8[t] -172.657737688075M9[t] -272.504655250035M10[t] + 297.501985184866M11[t] -26.4309477551256t + e[t] |
| Multiple Linear Regression - Ordinary Least Squares | |||||
| Variable | Parameter | S.D. | T-STAT H0: parameter = 0 | 2-tail p-value | 1-tail p-value |
| (Intercept) | 54.4678682869157 | 6051.67942 | 0.009 | 0.992859 | 0.496429 |
| `Uitvoer/inflatie` | 19736.9890382847 | 6944.096051 | 2.8423 | 0.00671 | 0.003355 |
| Inflatie | -4260.49052841623 | 623.664301 | -6.8314 | 0 | 0 |
| M1 | -2600.41110213936 | 935.528045 | -2.7796 | 0.007915 | 0.003958 |
| M2 | 511.415961808663 | 707.678516 | 0.7227 | 0.473624 | 0.236812 |
| M3 | 397.466380062199 | 714.549904 | 0.5562 | 0.580798 | 0.290399 |
| M4 | -191.940314138286 | 776.844708 | -0.2471 | 0.805973 | 0.402986 |
| M5 | -1531.96966104220 | 952.047675 | -1.6091 | 0.114582 | 0.057291 |
| M6 | -844.712461834646 | 859.821057 | -0.9824 | 0.331142 | 0.165571 |
| M7 | -671.981889680457 | 732.053175 | -0.9179 | 0.363544 | 0.181772 |
| M8 | 400.300576732874 | 742.537861 | 0.5391 | 0.592477 | 0.296238 |
| M9 | -172.657737688075 | 712.221312 | -0.2424 | 0.809555 | 0.404778 |
| M10 | -272.504655250035 | 701.299285 | -0.3886 | 0.699426 | 0.349713 |
| M11 | 297.501985184866 | 704.679953 | 0.4222 | 0.674904 | 0.337452 |
| t | -26.4309477551256 | 16.55801 | -1.5963 | 0.11743 | 0.058715 |
| Multiple Linear Regression - Regression Statistics | |
| Multiple R | 0.923156921377264 |
| R-squared | 0.852218701486747 |
| Adjusted R-squared | 0.806242297504847 |
| F-TEST (value) | 18.5360016808238 |
| F-TEST (DF numerator) | 14 |
| F-TEST (DF denominator) | 45 |
| p-value | 3.50830475781549e-14 |
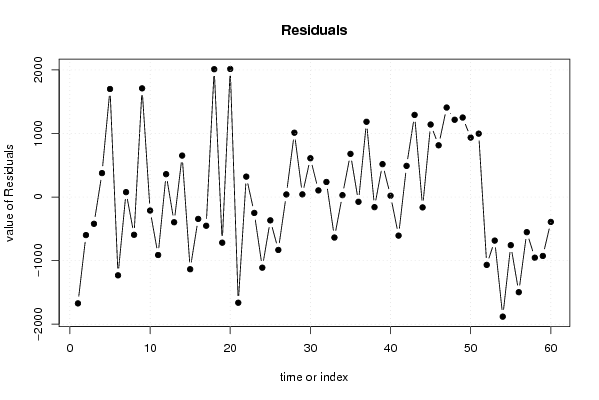
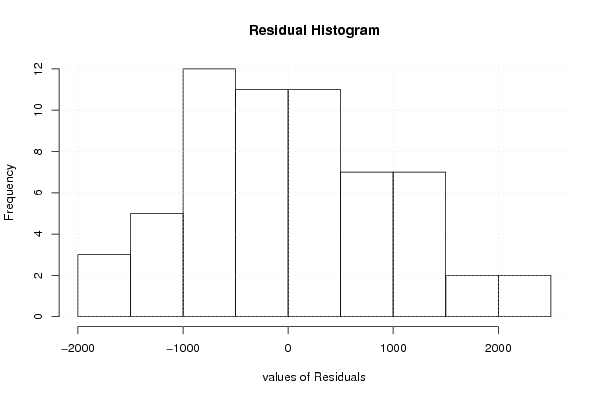
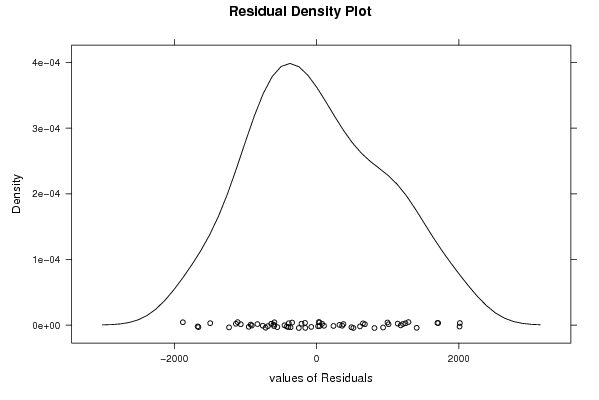
| Multiple Linear Regression - Residual Statistics | |
| Residual Standard Deviation | 1088.85489387133 |
| Sum Squared Residuals | 53352224.0958391 |
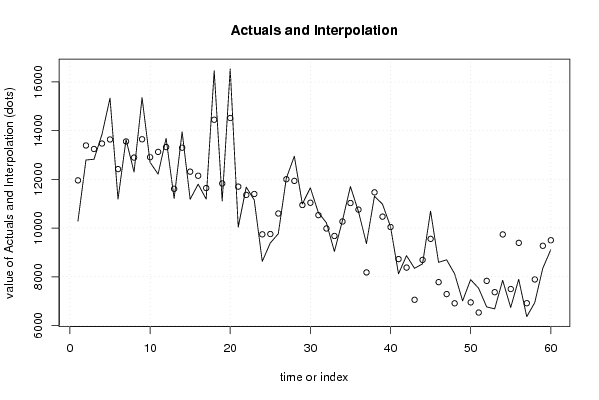
| Multiple Linear Regression - Actuals, Interpolation, and Residuals | |||
| Time or Index | Actuals | Interpolation Forecast | Residuals Prediction Error |
| 1 | 10284.5 | 11956.8697125110 | -1672.36971251104 |
| 2 | 12792 | 13389.6089591449 | -597.608959144895 |
| 3 | 12823.61538 | 13244.3340116276 | -420.718631627615 |
| 4 | 13845.66667 | 13468.4743527129 | 377.192317287128 |
| 5 | 15335.63636 | 13635.5114277194 | 1700.12493228065 |
| 6 | 11188.5 | 12419.5050571235 | -1231.0050571235 |
| 7 | 13633.25 | 13555.6329638609 | 77.6170361390786 |
| 8 | 12298.46667 | 12892.0941991091 | -593.627529109136 |
| 9 | 15353.63636 | 13643.6196038034 | 1710.01675619661 |
| 10 | 12696.15385 | 12908.1480398015 | -211.994189801517 |
| 11 | 12213.93333 | 13125.4422452141 | -911.508915214052 |
| 12 | 13683.72727 | 13323.6874872049 | 360.039782795114 |
| 13 | 11214.14286 | 11610.3672592507 | -396.224399250729 |
| 14 | 13950.23077 | 13297.6853813731 | 652.545388626859 |
| 15 | 11179.13333 | 12314.2509450973 | -1135.11761509725 |
| 16 | 11801.875 | 12145.7187717691 | -343.843771769142 |
| 17 | 11188.82353 | 11640.2620123761 | -451.438482376064 |
| 18 | 16456.27273 | 14445.2208612035 | 2011.0518687965 |
| 19 | 11110.0625 | 11827.5196349476 | -717.457134947606 |
| 20 | 16530.69231 | 14515.5428181823 | 2015.14949181768 |
| 21 | 10038.41176 | 11700.5622677962 | -1662.15050779617 |
| 22 | 11681.25 | 11359.7167191115 | 321.533280888521 |
| 23 | 11148.88235 | 11398.3986075122 | -249.516257512174 |
| 24 | 8631 | 9741.50896937573 | -1110.50896937573 |
| 25 | 9386.444444 | 9752.91978987123 | -366.475345871229 |
| 26 | 9764.736842 | 10596.3792294913 | -831.642387491307 |
| 27 | 12043.75 | 12002.8840104653 | 40.8659895347464 |
| 28 | 12948.06667 | 11935.6696233349 | 1012.39704666515 |
| 29 | 10987.125 | 10944.7756382375 | 42.3493617625198 |
| 30 | 11648.3125 | 11037.8088995681 | 610.50360043186 |
| 31 | 10633.35294 | 10528.7404678959 | 104.612472104067 |
| 32 | 10219.3 | 9981.91218384338 | 237.387816156622 |
| 33 | 9037.6 | 9674.2866595068 | -636.686659506803 |
| 34 | 10296.31579 | 10266.3978852138 | 29.9179047862289 |
| 35 | 11705.41176 | 11026.0579487401 | 679.353811259897 |
| 36 | 10681.94444 | 10756.3260118887 | -74.381571888684 |
| 37 | 9362.947368 | 8178.4856627974 | 1184.46170520259 |
| 38 | 11306.35294 | 11465.1550593118 | -158.802119311781 |
| 39 | 10984.45 | 10466.9304607794 | 517.519539220574 |
| 40 | 10062.61905 | 10041.4829669374 | 21.1360830626299 |
| 41 | 8118.583333 | 8725.0204340908 | -606.437101090796 |
| 42 | 8867.48 | 8377.01076779927 | 490.469232200726 |
| 43 | 8346.72 | 7054.4650954625 | 1292.25490453750 |
| 44 | 8529.307692 | 8691.89757786712 | -162.589885867121 |
| 45 | 10697.18182 | 9556.36697469448 | 1140.81484530552 |
| 46 | 8591.84 | 7777.75818495923 | 814.081815040767 |
| 47 | 8695.607143 | 7287.63736130783 | 1407.96978169217 |
| 48 | 8125.571429 | 6909.55430156025 | 1216.01712743975 |
| 49 | 7009.758621 | 5759.15086856959 | 1250.60775243041 |
| 50 | 7883.466667 | 6947.95858967888 | 935.508077321123 |
| 51 | 7527.645161 | 6530.19444303045 | 997.45071796955 |
| 52 | 6763.758621 | 7830.64029624576 | -1066.88167524576 |
| 53 | 6682.333333 | 7366.9320435763 | -684.598710576306 |
| 54 | 7855.681818 | 9736.70146230559 | -1881.01964430559 |
| 55 | 6738.88 | 7495.90727783304 | -757.027277833038 |
| 56 | 7895.434783 | 9391.75467599805 | -1496.31989299805 |
| 57 | 6361.884615 | 6913.87904919916 | -551.994434199156 |
| 58 | 6935.956522 | 7889.495332914 | -953.538810914 |
| 59 | 8344.454545 | 9270.75296522584 | -926.298420225837 |
| 60 | 9107.944444 | 9499.11081297045 | -391.16636897045 |
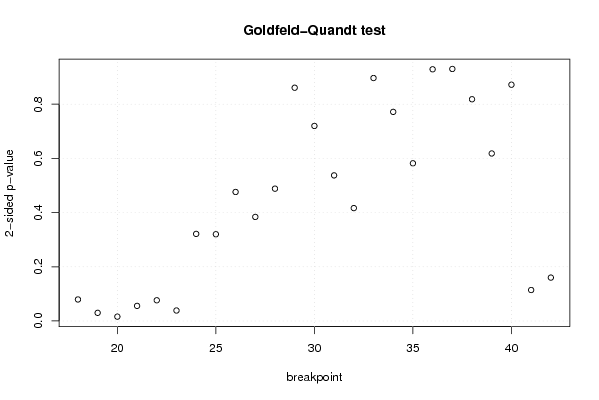
| Goldfeld-Quandt test for Heteroskedasticity | |||
| p-values | Alternative Hypothesis | ||
| breakpoint index | greater | 2-sided | less |
| 18 | 0.0396557973045622 | 0.0793115946091243 | 0.960344202695438 |
| 19 | 0.0149734650655189 | 0.0299469301310378 | 0.985026534934481 |
| 20 | 0.00791729210478549 | 0.0158345842095710 | 0.992082707895215 |
| 21 | 0.0277724367935391 | 0.0555448735870782 | 0.97222756320646 |
| 22 | 0.0381554598937814 | 0.0763109197875627 | 0.961844540106219 |
| 23 | 0.0192592755484715 | 0.038518551096943 | 0.980740724451528 |
| 24 | 0.160672905171715 | 0.321345810343430 | 0.839327094828285 |
| 25 | 0.160048732925869 | 0.320097465851738 | 0.83995126707413 |
| 26 | 0.238079351340466 | 0.476158702680932 | 0.761920648659534 |
| 27 | 0.192011246509730 | 0.384022493019461 | 0.80798875349027 |
| 28 | 0.244146067746356 | 0.488292135492711 | 0.755853932253644 |
| 29 | 0.430489681506037 | 0.860979363012074 | 0.569510318493963 |
| 30 | 0.359962258982155 | 0.71992451796431 | 0.640037741017845 |
| 31 | 0.268688113028761 | 0.537376226057521 | 0.73131188697124 |
| 32 | 0.208310106952111 | 0.416620213904222 | 0.791689893047889 |
| 33 | 0.448381637275994 | 0.896763274551987 | 0.551618362724006 |
| 34 | 0.385900410605091 | 0.771800821210182 | 0.614099589394909 |
| 35 | 0.290994610320489 | 0.581989220640977 | 0.709005389679511 |
| 36 | 0.464500039424954 | 0.929000078849908 | 0.535499960575046 |
| 37 | 0.465150217498443 | 0.930300434996886 | 0.534849782501557 |
| 38 | 0.590776865912517 | 0.818446268174966 | 0.409223134087483 |
| 39 | 0.690864591206261 | 0.618270817587478 | 0.309135408793739 |
| 40 | 0.563964121567726 | 0.872071756864549 | 0.436035878432274 |
| 41 | 0.942904312117155 | 0.114191375765689 | 0.0570956878828446 |
| 42 | 0.919998620121816 | 0.160002759756368 | 0.0800013798781842 |
| Meta Analysis of Goldfeld-Quandt test for Heteroskedasticity | |||
| Description | # significant tests | % significant tests | OK/NOK |
| 1% type I error level | 0 | 0 | OK |
| 5% type I error level | 3 | 0.12 | NOK |
| 10% type I error level | 6 | 0.24 | NOK |