Free Statistics

of Irreproducible Research!

Author's title

Author*The author of this computation has been verified*
R Software Modulerwasp_multipleregression.wasp
Title produced by softwareMultiple Regression
Date of computationFri, 20 Nov 2009 07:43:01 -0700
Cite this page as followsStatistical Computations at FreeStatistics.org, Office for Research Development and Education, URL https://freestatistics.org/blog/index.php?v=date/2009/Nov/20/t1258728291so34pda1a7drc1w.htm/, Retrieved Wed, 24 Apr 2024 20:59:31 +0000
Statistical Computations at FreeStatistics.org, Office for Research Development and Education, URL https://freestatistics.org/blog/index.php?pk=58224, Retrieved Wed, 24 Apr 2024 20:59:31 +0000
QR Codes:

Original text written by user:
IsPrivate?No (this computation is public)
User-defined keywords
Estimated Impact127
Family? (F = Feedback message, R = changed R code, M = changed R Module, P = changed Parameters, D = changed Data)
-     [Multiple Regression] [Q1 The Seatbeltlaw] [2007-11-14 19:27:43] [8cd6641b921d30ebe00b648d1481bba0]
- RMPD  [Multiple Regression] [Seatbelt] [2009-11-12 13:54:52] [b98453cac15ba1066b407e146608df68]
-   PD      [Multiple Regression] [] [2009-11-20 14:43:01] [429631dabc57c2ce83a6344a979b9063] [Current]
Feedback Forum

Post a new message
Dataseries X:
115.6	37.2
111.9	37.2
107	34.7
107.1	32.5
100.6	33.5
99.2	31.5
108.4	31.2
103	27
99.8	26.7
115	26.5
90.8	26
95.9	27.2
114.4	30.5
108.2	33.7
112.6	34.2
109.1	36.7
105	36.2
105	38.5
118.5	40
103.7	42.5
112.5	43.5
116.6	43.3
96.6	45.5
101.9	44.3
116.5	43
119.3	43.5
115.4	41.5
108.5	42.5
111.5	41.3
108.8	39.5
121.8	38.5
109.6	41
112.2	44.5
119.6	46
104.1	44
105.3	41.5
115	41.3
124.1	38
116.8	38
107.5	36.2
115.6	38.7
116.2	38.7
116.3	39.2
119	35.7
111.9	36.5
118.6	36.7
106.9	34.7
103.2	35
118.6	28.2
118.7	23.7
102.8	15
100.6	8.7
94.9	11
94.5	7.5
102.9	5.7
95.3	9.3
92.5	10.2
102.7	15.7
91.5	18.1
89.5	20.8


Summary of computational transaction
Raw Inputview raw input (R code)
Raw Outputview raw output of R engine
Computing time3 seconds
R Server'Gwilym Jenkins' @ 72.249.127.135

\begin{tabular}{lllllllll}
\hline
Summary of computational transaction \tabularnewline
Raw Input & view raw input (R code)  \tabularnewline
Raw Output & view raw output of R engine  \tabularnewline
Computing time & 3 seconds \tabularnewline
R Server & 'Gwilym Jenkins' @ 72.249.127.135 \tabularnewline
\hline
\end{tabular}
%Source: https://freestatistics.org/blog/index.php?pk=58224&T=0

[TABLE]
[ROW][C]Summary of computational transaction[/C][/ROW]
[ROW][C]Raw Input[/C][C]view raw input (R code) [/C][/ROW]
[ROW][C]Raw Output[/C][C]view raw output of R engine [/C][/ROW]
[ROW][C]Computing time[/C][C]3 seconds[/C][/ROW]
[ROW][C]R Server[/C][C]'Gwilym Jenkins' @ 72.249.127.135[/C][/ROW]
[/TABLE]
Source: https://freestatistics.org/blog/index.php?pk=58224&T=0

Globally Unique Identifier (entire table): ba.freestatistics.org/blog/index.php?pk=58224&T=0

As an alternative you can also use a QR Code:  

The GUIDs for individual cells are displayed in the table below:

Summary of computational transaction
Raw Inputview raw input (R code)
Raw Outputview raw output of R engine
Computing time3 seconds
R Server'Gwilym Jenkins' @ 72.249.127.135


Multiple Linear Regression - Estimated Regression Equation
Ipzb[t] = + 75.7409869117733 + 0.549150534516807Cvn[t] + 17.0989534888664M1[t] + 17.8337099537553M2[t] + 13.5730053380130M3[t] + 9.82430309154084M4[t] + 8.19845267982208M5[t] + 7.83205624092391M6[t] + 16.6573223851026M7[t] + 8.96292831547462M8[t] + 7.83938371132981M9[t] + 15.6769920109720M10[t] -0.989537973133346M11[t] + 0.135546973414980t + e[t]

\begin{tabular}{lllllllll}
\hline
Multiple Linear Regression - Estimated Regression Equation \tabularnewline
Ipzb[t] =  +  75.7409869117733 +  0.549150534516807Cvn[t] +  17.0989534888664M1[t] +  17.8337099537553M2[t] +  13.5730053380130M3[t] +  9.82430309154084M4[t] +  8.19845267982208M5[t] +  7.83205624092391M6[t] +  16.6573223851026M7[t] +  8.96292831547462M8[t] +  7.83938371132981M9[t] +  15.6769920109720M10[t] -0.989537973133346M11[t] +  0.135546973414980t  + e[t] \tabularnewline
\hline
\end{tabular}
%Source: https://freestatistics.org/blog/index.php?pk=58224&T=1

[TABLE]
[ROW][C]Multiple Linear Regression - Estimated Regression Equation[/C][/ROW]
[ROW][C]Ipzb[t] =  +  75.7409869117733 +  0.549150534516807Cvn[t] +  17.0989534888664M1[t] +  17.8337099537553M2[t] +  13.5730053380130M3[t] +  9.82430309154084M4[t] +  8.19845267982208M5[t] +  7.83205624092391M6[t] +  16.6573223851026M7[t] +  8.96292831547462M8[t] +  7.83938371132981M9[t] +  15.6769920109720M10[t] -0.989537973133346M11[t] +  0.135546973414980t  + e[t][/C][/ROW]
[/TABLE]
Source: https://freestatistics.org/blog/index.php?pk=58224&T=1

Globally Unique Identifier (entire table): ba.freestatistics.org/blog/index.php?pk=58224&T=1

As an alternative you can also use a QR Code:  

The GUIDs for individual cells are displayed in the table below:

Multiple Linear Regression - Estimated Regression Equation
Ipzb[t] = + 75.7409869117733 + 0.549150534516807Cvn[t] + 17.0989534888664M1[t] + 17.8337099537553M2[t] + 13.5730053380130M3[t] + 9.82430309154084M4[t] + 8.19845267982208M5[t] + 7.83205624092391M6[t] + 16.6573223851026M7[t] + 8.96292831547462M8[t] + 7.83938371132981M9[t] + 15.6769920109720M10[t] -0.989537973133346M11[t] + 0.135546973414980t + e[t]


Multiple Linear Regression - Ordinary Least Squares
VariableParameterS.D.T-STATH0: parameter = 02-tail p-value1-tail p-value
(Intercept)75.74098691177333.20880123.604100
Cvn0.5491505345168070.05486310.009500
M117.09895348886642.5623516.673100
M217.83370995375532.5592476.968300
M313.57300533801302.5625255.29673e-062e-06
M49.824303091540842.5647283.83050.0003860.000193
M58.198452679822082.5565363.20690.0024430.001222
M67.832056240923912.557513.06240.0036620.001831
M716.65732238510262.5551566.519100
M88.962928315474622.5512793.51310.0010050.000503
M97.839383711329812.5446593.08070.0034810.00174
M1015.67699201097202.5407766.170200
M11-0.9895379731333462.540027-0.38960.6986470.349323
t0.1355469734149800.0343943.9410.0002740.000137

\begin{tabular}{lllllllll}
\hline
Multiple Linear Regression - Ordinary Least Squares \tabularnewline
Variable & Parameter & S.D. & T-STATH0: parameter = 0 & 2-tail p-value & 1-tail p-value \tabularnewline
(Intercept) & 75.7409869117733 & 3.208801 & 23.6041 & 0 & 0 \tabularnewline
Cvn & 0.549150534516807 & 0.054863 & 10.0095 & 0 & 0 \tabularnewline
M1 & 17.0989534888664 & 2.562351 & 6.6731 & 0 & 0 \tabularnewline
M2 & 17.8337099537553 & 2.559247 & 6.9683 & 0 & 0 \tabularnewline
M3 & 13.5730053380130 & 2.562525 & 5.2967 & 3e-06 & 2e-06 \tabularnewline
M4 & 9.82430309154084 & 2.564728 & 3.8305 & 0.000386 & 0.000193 \tabularnewline
M5 & 8.19845267982208 & 2.556536 & 3.2069 & 0.002443 & 0.001222 \tabularnewline
M6 & 7.83205624092391 & 2.55751 & 3.0624 & 0.003662 & 0.001831 \tabularnewline
M7 & 16.6573223851026 & 2.555156 & 6.5191 & 0 & 0 \tabularnewline
M8 & 8.96292831547462 & 2.551279 & 3.5131 & 0.001005 & 0.000503 \tabularnewline
M9 & 7.83938371132981 & 2.544659 & 3.0807 & 0.003481 & 0.00174 \tabularnewline
M10 & 15.6769920109720 & 2.540776 & 6.1702 & 0 & 0 \tabularnewline
M11 & -0.989537973133346 & 2.540027 & -0.3896 & 0.698647 & 0.349323 \tabularnewline
t & 0.135546973414980 & 0.034394 & 3.941 & 0.000274 & 0.000137 \tabularnewline
\hline
\end{tabular}
%Source: https://freestatistics.org/blog/index.php?pk=58224&T=2

[TABLE]
[ROW][C]Multiple Linear Regression - Ordinary Least Squares[/C][/ROW]
[ROW][C]Variable[/C][C]Parameter[/C][C]S.D.[/C][C]T-STATH0: parameter = 0[/C][C]2-tail p-value[/C][C]1-tail p-value[/C][/ROW]
[ROW][C](Intercept)[/C][C]75.7409869117733[/C][C]3.208801[/C][C]23.6041[/C][C]0[/C][C]0[/C][/ROW]
[ROW][C]Cvn[/C][C]0.549150534516807[/C][C]0.054863[/C][C]10.0095[/C][C]0[/C][C]0[/C][/ROW]
[ROW][C]M1[/C][C]17.0989534888664[/C][C]2.562351[/C][C]6.6731[/C][C]0[/C][C]0[/C][/ROW]
[ROW][C]M2[/C][C]17.8337099537553[/C][C]2.559247[/C][C]6.9683[/C][C]0[/C][C]0[/C][/ROW]
[ROW][C]M3[/C][C]13.5730053380130[/C][C]2.562525[/C][C]5.2967[/C][C]3e-06[/C][C]2e-06[/C][/ROW]
[ROW][C]M4[/C][C]9.82430309154084[/C][C]2.564728[/C][C]3.8305[/C][C]0.000386[/C][C]0.000193[/C][/ROW]
[ROW][C]M5[/C][C]8.19845267982208[/C][C]2.556536[/C][C]3.2069[/C][C]0.002443[/C][C]0.001222[/C][/ROW]
[ROW][C]M6[/C][C]7.83205624092391[/C][C]2.55751[/C][C]3.0624[/C][C]0.003662[/C][C]0.001831[/C][/ROW]
[ROW][C]M7[/C][C]16.6573223851026[/C][C]2.555156[/C][C]6.5191[/C][C]0[/C][C]0[/C][/ROW]
[ROW][C]M8[/C][C]8.96292831547462[/C][C]2.551279[/C][C]3.5131[/C][C]0.001005[/C][C]0.000503[/C][/ROW]
[ROW][C]M9[/C][C]7.83938371132981[/C][C]2.544659[/C][C]3.0807[/C][C]0.003481[/C][C]0.00174[/C][/ROW]
[ROW][C]M10[/C][C]15.6769920109720[/C][C]2.540776[/C][C]6.1702[/C][C]0[/C][C]0[/C][/ROW]
[ROW][C]M11[/C][C]-0.989537973133346[/C][C]2.540027[/C][C]-0.3896[/C][C]0.698647[/C][C]0.349323[/C][/ROW]
[ROW][C]t[/C][C]0.135546973414980[/C][C]0.034394[/C][C]3.941[/C][C]0.000274[/C][C]0.000137[/C][/ROW]
[/TABLE]
Source: https://freestatistics.org/blog/index.php?pk=58224&T=2

Globally Unique Identifier (entire table): ba.freestatistics.org/blog/index.php?pk=58224&T=2

As an alternative you can also use a QR Code:  

The GUIDs for individual cells are displayed in the table below:

Multiple Linear Regression - Ordinary Least Squares
VariableParameterS.D.T-STATH0: parameter = 02-tail p-value1-tail p-value
(Intercept)75.74098691177333.20880123.604100
Cvn0.5491505345168070.05486310.009500
M117.09895348886642.5623516.673100
M217.83370995375532.5592476.968300
M313.57300533801302.5625255.29673e-062e-06
M49.824303091540842.5647283.83050.0003860.000193
M58.198452679822082.5565363.20690.0024430.001222
M67.832056240923912.557513.06240.0036620.001831
M716.65732238510262.5551566.519100
M88.962928315474622.5512793.51310.0010050.000503
M97.839383711329812.5446593.08070.0034810.00174
M1015.67699201097202.5407766.170200
M11-0.9895379731333462.540027-0.38960.6986470.349323
t0.1355469734149800.0343943.9410.0002740.000137


Multiple Linear Regression - Regression Statistics
Multiple R0.913511293399156
R-squared0.8345028831678
Adjusted R-squared0.787731958845656
F-TEST (value)17.8423431921081
F-TEST (DF numerator)13
F-TEST (DF denominator)46
p-value9.15933995315754e-14
Multiple Linear Regression - Residual Statistics
Residual Standard Deviation4.01570337139246
Sum Squared Residuals741.790184082586

\begin{tabular}{lllllllll}
\hline
Multiple Linear Regression - Regression Statistics \tabularnewline
Multiple R & 0.913511293399156 \tabularnewline
R-squared & 0.8345028831678 \tabularnewline
Adjusted R-squared & 0.787731958845656 \tabularnewline
F-TEST (value) & 17.8423431921081 \tabularnewline
F-TEST (DF numerator) & 13 \tabularnewline
F-TEST (DF denominator) & 46 \tabularnewline
p-value & 9.15933995315754e-14 \tabularnewline
Multiple Linear Regression - Residual Statistics \tabularnewline
Residual Standard Deviation & 4.01570337139246 \tabularnewline
Sum Squared Residuals & 741.790184082586 \tabularnewline
\hline
\end{tabular}
%Source: https://freestatistics.org/blog/index.php?pk=58224&T=3

[TABLE]
[ROW][C]Multiple Linear Regression - Regression Statistics[/C][/ROW]
[ROW][C]Multiple R[/C][C]0.913511293399156[/C][/ROW]
[ROW][C]R-squared[/C][C]0.8345028831678[/C][/ROW]
[ROW][C]Adjusted R-squared[/C][C]0.787731958845656[/C][/ROW]
[ROW][C]F-TEST (value)[/C][C]17.8423431921081[/C][/ROW]
[ROW][C]F-TEST (DF numerator)[/C][C]13[/C][/ROW]
[ROW][C]F-TEST (DF denominator)[/C][C]46[/C][/ROW]
[ROW][C]p-value[/C][C]9.15933995315754e-14[/C][/ROW]
[ROW][C]Multiple Linear Regression - Residual Statistics[/C][/ROW]
[ROW][C]Residual Standard Deviation[/C][C]4.01570337139246[/C][/ROW]
[ROW][C]Sum Squared Residuals[/C][C]741.790184082586[/C][/ROW]
[/TABLE]
Source: https://freestatistics.org/blog/index.php?pk=58224&T=3

Globally Unique Identifier (entire table): ba.freestatistics.org/blog/index.php?pk=58224&T=3

As an alternative you can also use a QR Code:  

The GUIDs for individual cells are displayed in the table below:

Multiple Linear Regression - Regression Statistics
Multiple R0.913511293399156
R-squared0.8345028831678
Adjusted R-squared0.787731958845656
F-TEST (value)17.8423431921081
F-TEST (DF numerator)13
F-TEST (DF denominator)46
p-value9.15933995315754e-14
Multiple Linear Regression - Residual Statistics
Residual Standard Deviation4.01570337139246
Sum Squared Residuals741.790184082586


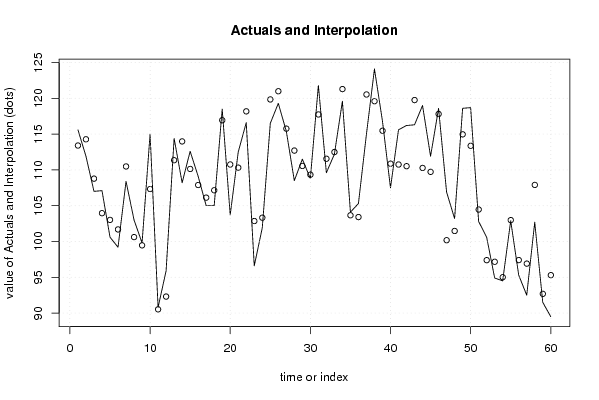
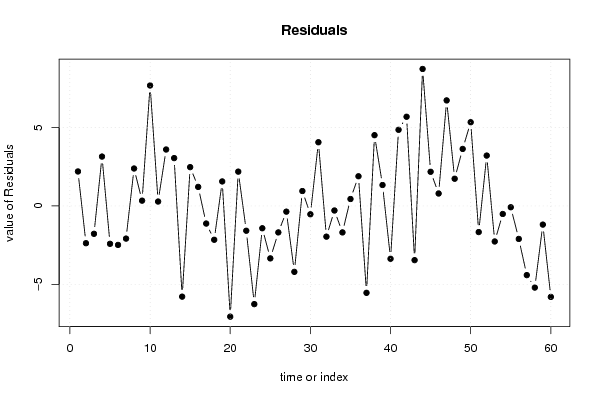
Multiple Linear Regression - Actuals, Interpolation, and Residuals
Time or IndexActualsInterpolationForecastResidualsPrediction Error
1115.6113.403887258082.19611274191999
2111.9114.274190696384-2.37419069638375
3107108.776156717764-1.77615671776442
4107.1103.9548702687703.14512973122969
5100.6103.013717364983-2.41371736498335
699.2101.684566830467-2.48456683046652
7108.4110.480634787705-2.08063478770517
8103100.6153554465222.38464455347843
999.899.46261265543670.337387344563305
10115107.3259378215907.67406217840954
1190.890.52037954364170.279620456358269
1295.992.30444513161023.59555486838979
13114.4111.3511423577973.04885764220289
14108.2113.978727506555-5.77872750655469
15112.6110.1281451314862.47185486851421
16109.1107.8878661947211.21213380527934
17105106.122987489158-1.12298748915847
18105107.155184253064-2.15518425306394
19118.5116.9397231724331.56027682756716
20103.7110.753752412512-7.05375241251183
21112.5110.3149053162992.18509468370119
22116.6118.178230482453-1.57823048245260
2396.6102.855378647699-6.25537864769924
24101.9103.321482952827-1.42148295282738
25116.5119.842087720237-3.34208772023697
26119.3120.986966425799-1.68696642579916
27115.4115.763507714438-0.363507714438231
28108.5112.699502975898-4.1995029758979
29111.5110.5502188961740.949781103826055
30108.8109.330898468561-0.53089846856051
31121.8117.7425610516374.0574389483626
32109.6111.556590291716-1.95659029171639
33112.2112.490619531795-0.290619531795379
34119.6121.287500606628-1.68750060662774
35104.1103.6582165269040.441783473096213
36105.3103.4104251371601.88957486283991
37115120.535095492538-5.53509549253816
38124.1119.5932021669364.50679783306351
39116.8115.4680445246091.33195547539082
40107.5110.866418289422-3.36641828942178
41115.6110.748991187414.85100881258998
42116.2110.5181417219275.68185827807318
43116.3119.753530106779-3.45353010677893
44119110.2726561397578.72734386024292
45111.9109.7239789366412.17602106335931
46118.6117.8069643166010.793035683398797
47106.9100.1776802368776.72231976312276
48103.2101.4675103437811.73248965621940
49118.6114.9677871713483.63221282865225
50118.7113.3669132043265.3330867956741
51102.8104.464145911702-1.66414591170238
52100.697.39134227118933.20865772881065
5394.997.1640850622742-2.26408506227422
5494.595.0112087259822-0.51120872598221
55102.9102.983550881446-0.083550881445649
5695.397.4016457094931-2.10164570949313
5792.596.9078835598284-4.40788355982843
58102.7107.901366772728-5.20136677272801
5991.592.688345044878-1.18834504487801
6089.595.2961364346217-5.79613643462172

\begin{tabular}{lllllllll}
\hline
Multiple Linear Regression - Actuals, Interpolation, and Residuals \tabularnewline
Time or Index & Actuals & InterpolationForecast & ResidualsPrediction Error \tabularnewline
1 & 115.6 & 113.40388725808 & 2.19611274191999 \tabularnewline
2 & 111.9 & 114.274190696384 & -2.37419069638375 \tabularnewline
3 & 107 & 108.776156717764 & -1.77615671776442 \tabularnewline
4 & 107.1 & 103.954870268770 & 3.14512973122969 \tabularnewline
5 & 100.6 & 103.013717364983 & -2.41371736498335 \tabularnewline
6 & 99.2 & 101.684566830467 & -2.48456683046652 \tabularnewline
7 & 108.4 & 110.480634787705 & -2.08063478770517 \tabularnewline
8 & 103 & 100.615355446522 & 2.38464455347843 \tabularnewline
9 & 99.8 & 99.4626126554367 & 0.337387344563305 \tabularnewline
10 & 115 & 107.325937821590 & 7.67406217840954 \tabularnewline
11 & 90.8 & 90.5203795436417 & 0.279620456358269 \tabularnewline
12 & 95.9 & 92.3044451316102 & 3.59555486838979 \tabularnewline
13 & 114.4 & 111.351142357797 & 3.04885764220289 \tabularnewline
14 & 108.2 & 113.978727506555 & -5.77872750655469 \tabularnewline
15 & 112.6 & 110.128145131486 & 2.47185486851421 \tabularnewline
16 & 109.1 & 107.887866194721 & 1.21213380527934 \tabularnewline
17 & 105 & 106.122987489158 & -1.12298748915847 \tabularnewline
18 & 105 & 107.155184253064 & -2.15518425306394 \tabularnewline
19 & 118.5 & 116.939723172433 & 1.56027682756716 \tabularnewline
20 & 103.7 & 110.753752412512 & -7.05375241251183 \tabularnewline
21 & 112.5 & 110.314905316299 & 2.18509468370119 \tabularnewline
22 & 116.6 & 118.178230482453 & -1.57823048245260 \tabularnewline
23 & 96.6 & 102.855378647699 & -6.25537864769924 \tabularnewline
24 & 101.9 & 103.321482952827 & -1.42148295282738 \tabularnewline
25 & 116.5 & 119.842087720237 & -3.34208772023697 \tabularnewline
26 & 119.3 & 120.986966425799 & -1.68696642579916 \tabularnewline
27 & 115.4 & 115.763507714438 & -0.363507714438231 \tabularnewline
28 & 108.5 & 112.699502975898 & -4.1995029758979 \tabularnewline
29 & 111.5 & 110.550218896174 & 0.949781103826055 \tabularnewline
30 & 108.8 & 109.330898468561 & -0.53089846856051 \tabularnewline
31 & 121.8 & 117.742561051637 & 4.0574389483626 \tabularnewline
32 & 109.6 & 111.556590291716 & -1.95659029171639 \tabularnewline
33 & 112.2 & 112.490619531795 & -0.290619531795379 \tabularnewline
34 & 119.6 & 121.287500606628 & -1.68750060662774 \tabularnewline
35 & 104.1 & 103.658216526904 & 0.441783473096213 \tabularnewline
36 & 105.3 & 103.410425137160 & 1.88957486283991 \tabularnewline
37 & 115 & 120.535095492538 & -5.53509549253816 \tabularnewline
38 & 124.1 & 119.593202166936 & 4.50679783306351 \tabularnewline
39 & 116.8 & 115.468044524609 & 1.33195547539082 \tabularnewline
40 & 107.5 & 110.866418289422 & -3.36641828942178 \tabularnewline
41 & 115.6 & 110.74899118741 & 4.85100881258998 \tabularnewline
42 & 116.2 & 110.518141721927 & 5.68185827807318 \tabularnewline
43 & 116.3 & 119.753530106779 & -3.45353010677893 \tabularnewline
44 & 119 & 110.272656139757 & 8.72734386024292 \tabularnewline
45 & 111.9 & 109.723978936641 & 2.17602106335931 \tabularnewline
46 & 118.6 & 117.806964316601 & 0.793035683398797 \tabularnewline
47 & 106.9 & 100.177680236877 & 6.72231976312276 \tabularnewline
48 & 103.2 & 101.467510343781 & 1.73248965621940 \tabularnewline
49 & 118.6 & 114.967787171348 & 3.63221282865225 \tabularnewline
50 & 118.7 & 113.366913204326 & 5.3330867956741 \tabularnewline
51 & 102.8 & 104.464145911702 & -1.66414591170238 \tabularnewline
52 & 100.6 & 97.3913422711893 & 3.20865772881065 \tabularnewline
53 & 94.9 & 97.1640850622742 & -2.26408506227422 \tabularnewline
54 & 94.5 & 95.0112087259822 & -0.51120872598221 \tabularnewline
55 & 102.9 & 102.983550881446 & -0.083550881445649 \tabularnewline
56 & 95.3 & 97.4016457094931 & -2.10164570949313 \tabularnewline
57 & 92.5 & 96.9078835598284 & -4.40788355982843 \tabularnewline
58 & 102.7 & 107.901366772728 & -5.20136677272801 \tabularnewline
59 & 91.5 & 92.688345044878 & -1.18834504487801 \tabularnewline
60 & 89.5 & 95.2961364346217 & -5.79613643462172 \tabularnewline
\hline
\end{tabular}
%Source: https://freestatistics.org/blog/index.php?pk=58224&T=4

[TABLE]
[ROW][C]Multiple Linear Regression - Actuals, Interpolation, and Residuals[/C][/ROW]
[ROW][C]Time or Index[/C][C]Actuals[/C][C]InterpolationForecast[/C][C]ResidualsPrediction Error[/C][/ROW]
[ROW][C]1[/C][C]115.6[/C][C]113.40388725808[/C][C]2.19611274191999[/C][/ROW]
[ROW][C]2[/C][C]111.9[/C][C]114.274190696384[/C][C]-2.37419069638375[/C][/ROW]
[ROW][C]3[/C][C]107[/C][C]108.776156717764[/C][C]-1.77615671776442[/C][/ROW]
[ROW][C]4[/C][C]107.1[/C][C]103.954870268770[/C][C]3.14512973122969[/C][/ROW]
[ROW][C]5[/C][C]100.6[/C][C]103.013717364983[/C][C]-2.41371736498335[/C][/ROW]
[ROW][C]6[/C][C]99.2[/C][C]101.684566830467[/C][C]-2.48456683046652[/C][/ROW]
[ROW][C]7[/C][C]108.4[/C][C]110.480634787705[/C][C]-2.08063478770517[/C][/ROW]
[ROW][C]8[/C][C]103[/C][C]100.615355446522[/C][C]2.38464455347843[/C][/ROW]
[ROW][C]9[/C][C]99.8[/C][C]99.4626126554367[/C][C]0.337387344563305[/C][/ROW]
[ROW][C]10[/C][C]115[/C][C]107.325937821590[/C][C]7.67406217840954[/C][/ROW]
[ROW][C]11[/C][C]90.8[/C][C]90.5203795436417[/C][C]0.279620456358269[/C][/ROW]
[ROW][C]12[/C][C]95.9[/C][C]92.3044451316102[/C][C]3.59555486838979[/C][/ROW]
[ROW][C]13[/C][C]114.4[/C][C]111.351142357797[/C][C]3.04885764220289[/C][/ROW]
[ROW][C]14[/C][C]108.2[/C][C]113.978727506555[/C][C]-5.77872750655469[/C][/ROW]
[ROW][C]15[/C][C]112.6[/C][C]110.128145131486[/C][C]2.47185486851421[/C][/ROW]
[ROW][C]16[/C][C]109.1[/C][C]107.887866194721[/C][C]1.21213380527934[/C][/ROW]
[ROW][C]17[/C][C]105[/C][C]106.122987489158[/C][C]-1.12298748915847[/C][/ROW]
[ROW][C]18[/C][C]105[/C][C]107.155184253064[/C][C]-2.15518425306394[/C][/ROW]
[ROW][C]19[/C][C]118.5[/C][C]116.939723172433[/C][C]1.56027682756716[/C][/ROW]
[ROW][C]20[/C][C]103.7[/C][C]110.753752412512[/C][C]-7.05375241251183[/C][/ROW]
[ROW][C]21[/C][C]112.5[/C][C]110.314905316299[/C][C]2.18509468370119[/C][/ROW]
[ROW][C]22[/C][C]116.6[/C][C]118.178230482453[/C][C]-1.57823048245260[/C][/ROW]
[ROW][C]23[/C][C]96.6[/C][C]102.855378647699[/C][C]-6.25537864769924[/C][/ROW]
[ROW][C]24[/C][C]101.9[/C][C]103.321482952827[/C][C]-1.42148295282738[/C][/ROW]
[ROW][C]25[/C][C]116.5[/C][C]119.842087720237[/C][C]-3.34208772023697[/C][/ROW]
[ROW][C]26[/C][C]119.3[/C][C]120.986966425799[/C][C]-1.68696642579916[/C][/ROW]
[ROW][C]27[/C][C]115.4[/C][C]115.763507714438[/C][C]-0.363507714438231[/C][/ROW]
[ROW][C]28[/C][C]108.5[/C][C]112.699502975898[/C][C]-4.1995029758979[/C][/ROW]
[ROW][C]29[/C][C]111.5[/C][C]110.550218896174[/C][C]0.949781103826055[/C][/ROW]
[ROW][C]30[/C][C]108.8[/C][C]109.330898468561[/C][C]-0.53089846856051[/C][/ROW]
[ROW][C]31[/C][C]121.8[/C][C]117.742561051637[/C][C]4.0574389483626[/C][/ROW]
[ROW][C]32[/C][C]109.6[/C][C]111.556590291716[/C][C]-1.95659029171639[/C][/ROW]
[ROW][C]33[/C][C]112.2[/C][C]112.490619531795[/C][C]-0.290619531795379[/C][/ROW]
[ROW][C]34[/C][C]119.6[/C][C]121.287500606628[/C][C]-1.68750060662774[/C][/ROW]
[ROW][C]35[/C][C]104.1[/C][C]103.658216526904[/C][C]0.441783473096213[/C][/ROW]
[ROW][C]36[/C][C]105.3[/C][C]103.410425137160[/C][C]1.88957486283991[/C][/ROW]
[ROW][C]37[/C][C]115[/C][C]120.535095492538[/C][C]-5.53509549253816[/C][/ROW]
[ROW][C]38[/C][C]124.1[/C][C]119.593202166936[/C][C]4.50679783306351[/C][/ROW]
[ROW][C]39[/C][C]116.8[/C][C]115.468044524609[/C][C]1.33195547539082[/C][/ROW]
[ROW][C]40[/C][C]107.5[/C][C]110.866418289422[/C][C]-3.36641828942178[/C][/ROW]
[ROW][C]41[/C][C]115.6[/C][C]110.74899118741[/C][C]4.85100881258998[/C][/ROW]
[ROW][C]42[/C][C]116.2[/C][C]110.518141721927[/C][C]5.68185827807318[/C][/ROW]
[ROW][C]43[/C][C]116.3[/C][C]119.753530106779[/C][C]-3.45353010677893[/C][/ROW]
[ROW][C]44[/C][C]119[/C][C]110.272656139757[/C][C]8.72734386024292[/C][/ROW]
[ROW][C]45[/C][C]111.9[/C][C]109.723978936641[/C][C]2.17602106335931[/C][/ROW]
[ROW][C]46[/C][C]118.6[/C][C]117.806964316601[/C][C]0.793035683398797[/C][/ROW]
[ROW][C]47[/C][C]106.9[/C][C]100.177680236877[/C][C]6.72231976312276[/C][/ROW]
[ROW][C]48[/C][C]103.2[/C][C]101.467510343781[/C][C]1.73248965621940[/C][/ROW]
[ROW][C]49[/C][C]118.6[/C][C]114.967787171348[/C][C]3.63221282865225[/C][/ROW]
[ROW][C]50[/C][C]118.7[/C][C]113.366913204326[/C][C]5.3330867956741[/C][/ROW]
[ROW][C]51[/C][C]102.8[/C][C]104.464145911702[/C][C]-1.66414591170238[/C][/ROW]
[ROW][C]52[/C][C]100.6[/C][C]97.3913422711893[/C][C]3.20865772881065[/C][/ROW]
[ROW][C]53[/C][C]94.9[/C][C]97.1640850622742[/C][C]-2.26408506227422[/C][/ROW]
[ROW][C]54[/C][C]94.5[/C][C]95.0112087259822[/C][C]-0.51120872598221[/C][/ROW]
[ROW][C]55[/C][C]102.9[/C][C]102.983550881446[/C][C]-0.083550881445649[/C][/ROW]
[ROW][C]56[/C][C]95.3[/C][C]97.4016457094931[/C][C]-2.10164570949313[/C][/ROW]
[ROW][C]57[/C][C]92.5[/C][C]96.9078835598284[/C][C]-4.40788355982843[/C][/ROW]
[ROW][C]58[/C][C]102.7[/C][C]107.901366772728[/C][C]-5.20136677272801[/C][/ROW]
[ROW][C]59[/C][C]91.5[/C][C]92.688345044878[/C][C]-1.18834504487801[/C][/ROW]
[ROW][C]60[/C][C]89.5[/C][C]95.2961364346217[/C][C]-5.79613643462172[/C][/ROW]
[/TABLE]
Source: https://freestatistics.org/blog/index.php?pk=58224&T=4

Globally Unique Identifier (entire table): ba.freestatistics.org/blog/index.php?pk=58224&T=4

As an alternative you can also use a QR Code:  

The GUIDs for individual cells are displayed in the table below:

Multiple Linear Regression - Actuals, Interpolation, and Residuals
Time or IndexActualsInterpolationForecastResidualsPrediction Error
1115.6113.403887258082.19611274191999
2111.9114.274190696384-2.37419069638375
3107108.776156717764-1.77615671776442
4107.1103.9548702687703.14512973122969
5100.6103.013717364983-2.41371736498335
699.2101.684566830467-2.48456683046652
7108.4110.480634787705-2.08063478770517
8103100.6153554465222.38464455347843
999.899.46261265543670.337387344563305
10115107.3259378215907.67406217840954
1190.890.52037954364170.279620456358269
1295.992.30444513161023.59555486838979
13114.4111.3511423577973.04885764220289
14108.2113.978727506555-5.77872750655469
15112.6110.1281451314862.47185486851421
16109.1107.8878661947211.21213380527934
17105106.122987489158-1.12298748915847
18105107.155184253064-2.15518425306394
19118.5116.9397231724331.56027682756716
20103.7110.753752412512-7.05375241251183
21112.5110.3149053162992.18509468370119
22116.6118.178230482453-1.57823048245260
2396.6102.855378647699-6.25537864769924
24101.9103.321482952827-1.42148295282738
25116.5119.842087720237-3.34208772023697
26119.3120.986966425799-1.68696642579916
27115.4115.763507714438-0.363507714438231
28108.5112.699502975898-4.1995029758979
29111.5110.5502188961740.949781103826055
30108.8109.330898468561-0.53089846856051
31121.8117.7425610516374.0574389483626
32109.6111.556590291716-1.95659029171639
33112.2112.490619531795-0.290619531795379
34119.6121.287500606628-1.68750060662774
35104.1103.6582165269040.441783473096213
36105.3103.4104251371601.88957486283991
37115120.535095492538-5.53509549253816
38124.1119.5932021669364.50679783306351
39116.8115.4680445246091.33195547539082
40107.5110.866418289422-3.36641828942178
41115.6110.748991187414.85100881258998
42116.2110.5181417219275.68185827807318
43116.3119.753530106779-3.45353010677893
44119110.2726561397578.72734386024292
45111.9109.7239789366412.17602106335931
46118.6117.8069643166010.793035683398797
47106.9100.1776802368776.72231976312276
48103.2101.4675103437811.73248965621940
49118.6114.9677871713483.63221282865225
50118.7113.3669132043265.3330867956741
51102.8104.464145911702-1.66414591170238
52100.697.39134227118933.20865772881065
5394.997.1640850622742-2.26408506227422
5494.595.0112087259822-0.51120872598221
55102.9102.983550881446-0.083550881445649
5695.397.4016457094931-2.10164570949313
5792.596.9078835598284-4.40788355982843
58102.7107.901366772728-5.20136677272801
5991.592.688345044878-1.18834504487801
6089.595.2961364346217-5.79613643462172


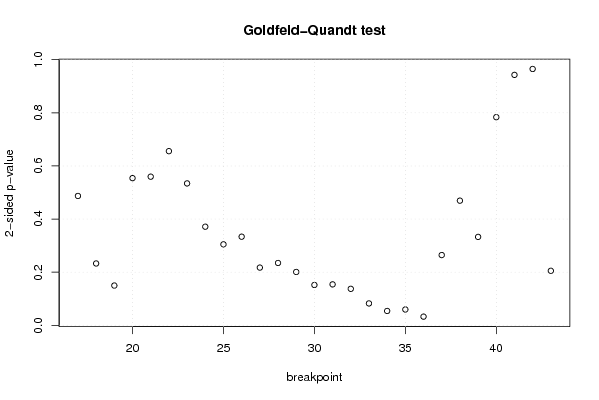
Goldfeld-Quandt test for Heteroskedasticity
p-valuesAlternative Hypothesis
breakpoint indexgreater2-sidedless
170.2434814606000320.4869629212000630.756518539399968
180.1163579590178870.2327159180357750.883642040982113
190.07480164055838890.1496032811167780.925198359441611
200.2770436564988030.5540873129976060.722956343501197
210.2798114583674220.5596229167348450.720188541632578
220.327863400315020.655726800630040.67213659968498
230.2671219537931940.5342439075863870.732878046206806
240.1856090303715830.3712180607431650.814390969628417
250.1524208940221750.3048417880443510.847579105977825
260.1668079538256350.3336159076512710.833192046174365
270.1086149124883650.2172298249767290.891385087511635
280.1173381755856360.2346763511712730.882661824414364
290.1003655015558510.2007310031117020.89963449844415
300.07592668832709010.1518533766541800.92407331167291
310.07702870516919760.1540574103383950.922971294830802
320.06863893149282780.1372778629856560.931361068507172
330.04113563905662110.08227127811324230.958864360943379
340.02693971443778010.05387942887556030.97306028556222
350.02973089898432440.05946179796864890.970269101015676
360.01623850982690180.03247701965380360.983761490173098
370.1322157638444060.2644315276888120.867784236155594
380.2346519946695690.4693039893391390.76534800533043
390.16639126381370.33278252762740.8336087361863
400.6081312886652320.7837374226695350.391868711334768
410.5285094932123940.9429810135752120.471490506787606
420.4826538546246420.9653077092492830.517346145375358
430.8974267166180840.2051465667638320.102573283381916

\begin{tabular}{lllllllll}
\hline
Goldfeld-Quandt test for Heteroskedasticity \tabularnewline
p-values & Alternative Hypothesis \tabularnewline
breakpoint index & greater & 2-sided & less \tabularnewline
17 & 0.243481460600032 & 0.486962921200063 & 0.756518539399968 \tabularnewline
18 & 0.116357959017887 & 0.232715918035775 & 0.883642040982113 \tabularnewline
19 & 0.0748016405583889 & 0.149603281116778 & 0.925198359441611 \tabularnewline
20 & 0.277043656498803 & 0.554087312997606 & 0.722956343501197 \tabularnewline
21 & 0.279811458367422 & 0.559622916734845 & 0.720188541632578 \tabularnewline
22 & 0.32786340031502 & 0.65572680063004 & 0.67213659968498 \tabularnewline
23 & 0.267121953793194 & 0.534243907586387 & 0.732878046206806 \tabularnewline
24 & 0.185609030371583 & 0.371218060743165 & 0.814390969628417 \tabularnewline
25 & 0.152420894022175 & 0.304841788044351 & 0.847579105977825 \tabularnewline
26 & 0.166807953825635 & 0.333615907651271 & 0.833192046174365 \tabularnewline
27 & 0.108614912488365 & 0.217229824976729 & 0.891385087511635 \tabularnewline
28 & 0.117338175585636 & 0.234676351171273 & 0.882661824414364 \tabularnewline
29 & 0.100365501555851 & 0.200731003111702 & 0.89963449844415 \tabularnewline
30 & 0.0759266883270901 & 0.151853376654180 & 0.92407331167291 \tabularnewline
31 & 0.0770287051691976 & 0.154057410338395 & 0.922971294830802 \tabularnewline
32 & 0.0686389314928278 & 0.137277862985656 & 0.931361068507172 \tabularnewline
33 & 0.0411356390566211 & 0.0822712781132423 & 0.958864360943379 \tabularnewline
34 & 0.0269397144377801 & 0.0538794288755603 & 0.97306028556222 \tabularnewline
35 & 0.0297308989843244 & 0.0594617979686489 & 0.970269101015676 \tabularnewline
36 & 0.0162385098269018 & 0.0324770196538036 & 0.983761490173098 \tabularnewline
37 & 0.132215763844406 & 0.264431527688812 & 0.867784236155594 \tabularnewline
38 & 0.234651994669569 & 0.469303989339139 & 0.76534800533043 \tabularnewline
39 & 0.1663912638137 & 0.3327825276274 & 0.8336087361863 \tabularnewline
40 & 0.608131288665232 & 0.783737422669535 & 0.391868711334768 \tabularnewline
41 & 0.528509493212394 & 0.942981013575212 & 0.471490506787606 \tabularnewline
42 & 0.482653854624642 & 0.965307709249283 & 0.517346145375358 \tabularnewline
43 & 0.897426716618084 & 0.205146566763832 & 0.102573283381916 \tabularnewline
\hline
\end{tabular}
%Source: https://freestatistics.org/blog/index.php?pk=58224&T=5

[TABLE]
[ROW][C]Goldfeld-Quandt test for Heteroskedasticity[/C][/ROW]
[ROW][C]p-values[/C][C]Alternative Hypothesis[/C][/ROW]
[ROW][C]breakpoint index[/C][C]greater[/C][C]2-sided[/C][C]less[/C][/ROW]
[ROW][C]17[/C][C]0.243481460600032[/C][C]0.486962921200063[/C][C]0.756518539399968[/C][/ROW]
[ROW][C]18[/C][C]0.116357959017887[/C][C]0.232715918035775[/C][C]0.883642040982113[/C][/ROW]
[ROW][C]19[/C][C]0.0748016405583889[/C][C]0.149603281116778[/C][C]0.925198359441611[/C][/ROW]
[ROW][C]20[/C][C]0.277043656498803[/C][C]0.554087312997606[/C][C]0.722956343501197[/C][/ROW]
[ROW][C]21[/C][C]0.279811458367422[/C][C]0.559622916734845[/C][C]0.720188541632578[/C][/ROW]
[ROW][C]22[/C][C]0.32786340031502[/C][C]0.65572680063004[/C][C]0.67213659968498[/C][/ROW]
[ROW][C]23[/C][C]0.267121953793194[/C][C]0.534243907586387[/C][C]0.732878046206806[/C][/ROW]
[ROW][C]24[/C][C]0.185609030371583[/C][C]0.371218060743165[/C][C]0.814390969628417[/C][/ROW]
[ROW][C]25[/C][C]0.152420894022175[/C][C]0.304841788044351[/C][C]0.847579105977825[/C][/ROW]
[ROW][C]26[/C][C]0.166807953825635[/C][C]0.333615907651271[/C][C]0.833192046174365[/C][/ROW]
[ROW][C]27[/C][C]0.108614912488365[/C][C]0.217229824976729[/C][C]0.891385087511635[/C][/ROW]
[ROW][C]28[/C][C]0.117338175585636[/C][C]0.234676351171273[/C][C]0.882661824414364[/C][/ROW]
[ROW][C]29[/C][C]0.100365501555851[/C][C]0.200731003111702[/C][C]0.89963449844415[/C][/ROW]
[ROW][C]30[/C][C]0.0759266883270901[/C][C]0.151853376654180[/C][C]0.92407331167291[/C][/ROW]
[ROW][C]31[/C][C]0.0770287051691976[/C][C]0.154057410338395[/C][C]0.922971294830802[/C][/ROW]
[ROW][C]32[/C][C]0.0686389314928278[/C][C]0.137277862985656[/C][C]0.931361068507172[/C][/ROW]
[ROW][C]33[/C][C]0.0411356390566211[/C][C]0.0822712781132423[/C][C]0.958864360943379[/C][/ROW]
[ROW][C]34[/C][C]0.0269397144377801[/C][C]0.0538794288755603[/C][C]0.97306028556222[/C][/ROW]
[ROW][C]35[/C][C]0.0297308989843244[/C][C]0.0594617979686489[/C][C]0.970269101015676[/C][/ROW]
[ROW][C]36[/C][C]0.0162385098269018[/C][C]0.0324770196538036[/C][C]0.983761490173098[/C][/ROW]
[ROW][C]37[/C][C]0.132215763844406[/C][C]0.264431527688812[/C][C]0.867784236155594[/C][/ROW]
[ROW][C]38[/C][C]0.234651994669569[/C][C]0.469303989339139[/C][C]0.76534800533043[/C][/ROW]
[ROW][C]39[/C][C]0.1663912638137[/C][C]0.3327825276274[/C][C]0.8336087361863[/C][/ROW]
[ROW][C]40[/C][C]0.608131288665232[/C][C]0.783737422669535[/C][C]0.391868711334768[/C][/ROW]
[ROW][C]41[/C][C]0.528509493212394[/C][C]0.942981013575212[/C][C]0.471490506787606[/C][/ROW]
[ROW][C]42[/C][C]0.482653854624642[/C][C]0.965307709249283[/C][C]0.517346145375358[/C][/ROW]
[ROW][C]43[/C][C]0.897426716618084[/C][C]0.205146566763832[/C][C]0.102573283381916[/C][/ROW]
[/TABLE]
Source: https://freestatistics.org/blog/index.php?pk=58224&T=5

Globally Unique Identifier (entire table): ba.freestatistics.org/blog/index.php?pk=58224&T=5

As an alternative you can also use a QR Code:  

The GUIDs for individual cells are displayed in the table below:

Goldfeld-Quandt test for Heteroskedasticity
p-valuesAlternative Hypothesis
breakpoint indexgreater2-sidedless
170.2434814606000320.4869629212000630.756518539399968
180.1163579590178870.2327159180357750.883642040982113
190.07480164055838890.1496032811167780.925198359441611
200.2770436564988030.5540873129976060.722956343501197
210.2798114583674220.5596229167348450.720188541632578
220.327863400315020.655726800630040.67213659968498
230.2671219537931940.5342439075863870.732878046206806
240.1856090303715830.3712180607431650.814390969628417
250.1524208940221750.3048417880443510.847579105977825
260.1668079538256350.3336159076512710.833192046174365
270.1086149124883650.2172298249767290.891385087511635
280.1173381755856360.2346763511712730.882661824414364
290.1003655015558510.2007310031117020.89963449844415
300.07592668832709010.1518533766541800.92407331167291
310.07702870516919760.1540574103383950.922971294830802
320.06863893149282780.1372778629856560.931361068507172
330.04113563905662110.08227127811324230.958864360943379
340.02693971443778010.05387942887556030.97306028556222
350.02973089898432440.05946179796864890.970269101015676
360.01623850982690180.03247701965380360.983761490173098
370.1322157638444060.2644315276888120.867784236155594
380.2346519946695690.4693039893391390.76534800533043
390.16639126381370.33278252762740.8336087361863
400.6081312886652320.7837374226695350.391868711334768
410.5285094932123940.9429810135752120.471490506787606
420.4826538546246420.9653077092492830.517346145375358
430.8974267166180840.2051465667638320.102573283381916


Meta Analysis of Goldfeld-Quandt test for Heteroskedasticity
Description# significant tests% significant testsOK/NOK
1% type I error level00OK
5% type I error level10.0370370370370370OK
10% type I error level40.148148148148148NOK

\begin{tabular}{lllllllll}
\hline
Meta Analysis of Goldfeld-Quandt test for Heteroskedasticity \tabularnewline
Description & # significant tests & % significant tests & OK/NOK \tabularnewline
1% type I error level & 0 & 0 & OK \tabularnewline
5% type I error level & 1 & 0.0370370370370370 & OK \tabularnewline
10% type I error level & 4 & 0.148148148148148 & NOK \tabularnewline
\hline
\end{tabular}
%Source: https://freestatistics.org/blog/index.php?pk=58224&T=6

[TABLE]
[ROW][C]Meta Analysis of Goldfeld-Quandt test for Heteroskedasticity[/C][/ROW]
[ROW][C]Description[/C][C]# significant tests[/C][C]% significant tests[/C][C]OK/NOK[/C][/ROW]
[ROW][C]1% type I error level[/C][C]0[/C][C]0[/C][C]OK[/C][/ROW]
[ROW][C]5% type I error level[/C][C]1[/C][C]0.0370370370370370[/C][C]OK[/C][/ROW]
[ROW][C]10% type I error level[/C][C]4[/C][C]0.148148148148148[/C][C]NOK[/C][/ROW]
[/TABLE]
Source: https://freestatistics.org/blog/index.php?pk=58224&T=6

Globally Unique Identifier (entire table): ba.freestatistics.org/blog/index.php?pk=58224&T=6

As an alternative you can also use a QR Code:  

The GUIDs for individual cells are displayed in the table below:

Meta Analysis of Goldfeld-Quandt test for Heteroskedasticity
Description# significant tests% significant testsOK/NOK
1% type I error level00OK
5% type I error level10.0370370370370370OK
10% type I error level40.148148148148148NOK


Parameters (Session):
Parameters (R input):
par1 = 1 ; par2 = Include Monthly Dummies ; par3 = Linear Trend ;
R code (references can be found in the software module):
library(lattice)
library(lmtest)
n25 <- 25 #minimum number of obs. for Goldfeld-Quandt test
par1 <- as.numeric(par1)
x <- t(y)
k <- length(x[1,])
n <- length(x[,1])
x1 <- cbind(x[,par1], x[,1:k!=par1])
mycolnames <- c(colnames(x)[par1], colnames(x)[1:k!=par1])
colnames(x1) <- mycolnames #colnames(x)[par1]
x <- x1
if (par3 == 'First Differences'){
x2 <- array(0, dim=c(n-1,k), dimnames=list(1:(n-1), paste('(1-B)',colnames(x),sep='')))
for (i in 1:n-1) {
for (j in 1:k) {
x2[i,j] <- x[i+1,j] - x[i,j]
}
}
x <- x2
}
if (par2 == 'Include Monthly Dummies'){
x2 <- array(0, dim=c(n,11), dimnames=list(1:n, paste('M', seq(1:11), sep ='')))
for (i in 1:11){
x2[seq(i,n,12),i] <- 1
}
x <- cbind(x, x2)
}
if (par2 == 'Include Quarterly Dummies'){
x2 <- array(0, dim=c(n,3), dimnames=list(1:n, paste('Q', seq(1:3), sep ='')))
for (i in 1:3){
x2[seq(i,n,4),i] <- 1
}
x <- cbind(x, x2)
}
k <- length(x[1,])
if (par3 == 'Linear Trend'){
x <- cbind(x, c(1:n))
colnames(x)[k+1] <- 't'
}
x
k <- length(x[1,])
df <- as.data.frame(x)
(mylm <- lm(df))
(mysum <- summary(mylm))
if (n > n25) {
kp3 <- k + 3
nmkm3 <- n - k - 3
gqarr <- array(NA, dim=c(nmkm3-kp3+1,3))
numgqtests <- 0
numsignificant1 <- 0
numsignificant5 <- 0
numsignificant10 <- 0
for (mypoint in kp3:nmkm3) {
j <- 0
numgqtests <- numgqtests + 1
for (myalt in c('greater', 'two.sided', 'less')) {
j <- j + 1
gqarr[mypoint-kp3+1,j] <- gqtest(mylm, point=mypoint, alternative=myalt)$p.value
}
if (gqarr[mypoint-kp3+1,2] < 0.01) numsignificant1 <- numsignificant1 + 1
if (gqarr[mypoint-kp3+1,2] < 0.05) numsignificant5 <- numsignificant5 + 1
if (gqarr[mypoint-kp3+1,2] < 0.10) numsignificant10 <- numsignificant10 + 1
}
gqarr
}
bitmap(file='test0.png')
plot(x[,1], type='l', main='Actuals and Interpolation', ylab='value of Actuals and Interpolation (dots)', xlab='time or index')
points(x[,1]-mysum$resid)
grid()
dev.off()
bitmap(file='test1.png')
plot(mysum$resid, type='b', pch=19, main='Residuals', ylab='value of Residuals', xlab='time or index')
grid()
dev.off()
bitmap(file='test2.png')
hist(mysum$resid, main='Residual Histogram', xlab='values of Residuals')
grid()
dev.off()
bitmap(file='test3.png')
densityplot(~mysum$resid,col='black',main='Residual Density Plot', xlab='values of Residuals')
dev.off()
bitmap(file='test4.png')
qqnorm(mysum$resid, main='Residual Normal Q-Q Plot')
qqline(mysum$resid)
grid()
dev.off()
(myerror <- as.ts(mysum$resid))
bitmap(file='test5.png')
dum <- cbind(lag(myerror,k=1),myerror)
dum
dum1 <- dum[2:length(myerror),]
dum1
z <- as.data.frame(dum1)
z
plot(z,main=paste('Residual Lag plot, lowess, and regression line'), ylab='values of Residuals', xlab='lagged values of Residuals')
lines(lowess(z))
abline(lm(z))
grid()
dev.off()
bitmap(file='test6.png')
acf(mysum$resid, lag.max=length(mysum$resid)/2, main='Residual Autocorrelation Function')
grid()
dev.off()
bitmap(file='test7.png')
pacf(mysum$resid, lag.max=length(mysum$resid)/2, main='Residual Partial Autocorrelation Function')
grid()
dev.off()
bitmap(file='test8.png')
opar <- par(mfrow = c(2,2), oma = c(0, 0, 1.1, 0))
plot(mylm, las = 1, sub='Residual Diagnostics')
par(opar)
dev.off()
if (n > n25) {
bitmap(file='test9.png')
plot(kp3:nmkm3,gqarr[,2], main='Goldfeld-Quandt test',ylab='2-sided p-value',xlab='breakpoint')
grid()
dev.off()
}
load(file='createtable')
a<-table.start()
a<-table.row.start(a)
a<-table.element(a, 'Multiple Linear Regression - Estimated Regression Equation', 1, TRUE)
a<-table.row.end(a)
myeq <- colnames(x)[1]
myeq <- paste(myeq, '[t] = ', sep='')
for (i in 1:k){
if (mysum$coefficients[i,1] > 0) myeq <- paste(myeq, '+', '')
myeq <- paste(myeq, mysum$coefficients[i,1], sep=' ')
if (rownames(mysum$coefficients)[i] != '(Intercept)') {
myeq <- paste(myeq, rownames(mysum$coefficients)[i], sep='')
if (rownames(mysum$coefficients)[i] != 't') myeq <- paste(myeq, '[t]', sep='')
}
}
myeq <- paste(myeq, ' + e[t]')
a<-table.row.start(a)
a<-table.element(a, myeq)
a<-table.row.end(a)
a<-table.end(a)
table.save(a,file='mytable1.tab')
a<-table.start()
a<-table.row.start(a)
a<-table.element(a,hyperlink('ols1.htm','Multiple Linear Regression - Ordinary Least Squares',''), 6, TRUE)
a<-table.row.end(a)
a<-table.row.start(a)
a<-table.element(a,'Variable',header=TRUE)
a<-table.element(a,'Parameter',header=TRUE)
a<-table.element(a,'S.D.',header=TRUE)
a<-table.element(a,'T-STAT
H0: parameter = 0',header=TRUE)
a<-table.element(a,'2-tail p-value',header=TRUE)
a<-table.element(a,'1-tail p-value',header=TRUE)
a<-table.row.end(a)
for (i in 1:k){
a<-table.row.start(a)
a<-table.element(a,rownames(mysum$coefficients)[i],header=TRUE)
a<-table.element(a,mysum$coefficients[i,1])
a<-table.element(a, round(mysum$coefficients[i,2],6))
a<-table.element(a, round(mysum$coefficients[i,3],4))
a<-table.element(a, round(mysum$coefficients[i,4],6))
a<-table.element(a, round(mysum$coefficients[i,4]/2,6))
a<-table.row.end(a)
}
a<-table.end(a)
table.save(a,file='mytable2.tab')
a<-table.start()
a<-table.row.start(a)
a<-table.element(a, 'Multiple Linear Regression - Regression Statistics', 2, TRUE)
a<-table.row.end(a)
a<-table.row.start(a)
a<-table.element(a, 'Multiple R',1,TRUE)
a<-table.element(a, sqrt(mysum$r.squared))
a<-table.row.end(a)
a<-table.row.start(a)
a<-table.element(a, 'R-squared',1,TRUE)
a<-table.element(a, mysum$r.squared)
a<-table.row.end(a)
a<-table.row.start(a)
a<-table.element(a, 'Adjusted R-squared',1,TRUE)
a<-table.element(a, mysum$adj.r.squared)
a<-table.row.end(a)
a<-table.row.start(a)
a<-table.element(a, 'F-TEST (value)',1,TRUE)
a<-table.element(a, mysum$fstatistic[1])
a<-table.row.end(a)
a<-table.row.start(a)
a<-table.element(a, 'F-TEST (DF numerator)',1,TRUE)
a<-table.element(a, mysum$fstatistic[2])
a<-table.row.end(a)
a<-table.row.start(a)
a<-table.element(a, 'F-TEST (DF denominator)',1,TRUE)
a<-table.element(a, mysum$fstatistic[3])
a<-table.row.end(a)
a<-table.row.start(a)
a<-table.element(a, 'p-value',1,TRUE)
a<-table.element(a, 1-pf(mysum$fstatistic[1],mysum$fstatistic[2],mysum$fstatistic[3]))
a<-table.row.end(a)
a<-table.row.start(a)
a<-table.element(a, 'Multiple Linear Regression - Residual Statistics', 2, TRUE)
a<-table.row.end(a)
a<-table.row.start(a)
a<-table.element(a, 'Residual Standard Deviation',1,TRUE)
a<-table.element(a, mysum$sigma)
a<-table.row.end(a)
a<-table.row.start(a)
a<-table.element(a, 'Sum Squared Residuals',1,TRUE)
a<-table.element(a, sum(myerror*myerror))
a<-table.row.end(a)
a<-table.end(a)
table.save(a,file='mytable3.tab')
a<-table.start()
a<-table.row.start(a)
a<-table.element(a, 'Multiple Linear Regression - Actuals, Interpolation, and Residuals', 4, TRUE)
a<-table.row.end(a)
a<-table.row.start(a)
a<-table.element(a, 'Time or Index', 1, TRUE)
a<-table.element(a, 'Actuals', 1, TRUE)
a<-table.element(a, 'Interpolation
Forecast', 1, TRUE)
a<-table.element(a, 'Residuals
Prediction Error', 1, TRUE)
a<-table.row.end(a)
for (i in 1:n) {
a<-table.row.start(a)
a<-table.element(a,i, 1, TRUE)
a<-table.element(a,x[i])
a<-table.element(a,x[i]-mysum$resid[i])
a<-table.element(a,mysum$resid[i])
a<-table.row.end(a)
}
a<-table.end(a)
table.save(a,file='mytable4.tab')
if (n > n25) {
a<-table.start()
a<-table.row.start(a)
a<-table.element(a,'Goldfeld-Quandt test for Heteroskedasticity',4,TRUE)
a<-table.row.end(a)
a<-table.row.start(a)
a<-table.element(a,'p-values',header=TRUE)
a<-table.element(a,'Alternative Hypothesis',3,header=TRUE)
a<-table.row.end(a)
a<-table.row.start(a)
a<-table.element(a,'breakpoint index',header=TRUE)
a<-table.element(a,'greater',header=TRUE)
a<-table.element(a,'2-sided',header=TRUE)
a<-table.element(a,'less',header=TRUE)
a<-table.row.end(a)
for (mypoint in kp3:nmkm3) {
a<-table.row.start(a)
a<-table.element(a,mypoint,header=TRUE)
a<-table.element(a,gqarr[mypoint-kp3+1,1])
a<-table.element(a,gqarr[mypoint-kp3+1,2])
a<-table.element(a,gqarr[mypoint-kp3+1,3])
a<-table.row.end(a)
}
a<-table.end(a)
table.save(a,file='mytable5.tab')
a<-table.start()
a<-table.row.start(a)
a<-table.element(a,'Meta Analysis of Goldfeld-Quandt test for Heteroskedasticity',4,TRUE)
a<-table.row.end(a)
a<-table.row.start(a)
a<-table.element(a,'Description',header=TRUE)
a<-table.element(a,'# significant tests',header=TRUE)
a<-table.element(a,'% significant tests',header=TRUE)
a<-table.element(a,'OK/NOK',header=TRUE)
a<-table.row.end(a)
a<-table.row.start(a)
a<-table.element(a,'1% type I error level',header=TRUE)
a<-table.element(a,numsignificant1)
a<-table.element(a,numsignificant1/numgqtests)
if (numsignificant1/numgqtests < 0.01) dum <- 'OK' else dum <- 'NOK'
a<-table.element(a,dum)
a<-table.row.end(a)
a<-table.row.start(a)
a<-table.element(a,'5% type I error level',header=TRUE)
a<-table.element(a,numsignificant5)
a<-table.element(a,numsignificant5/numgqtests)
if (numsignificant5/numgqtests < 0.05) dum <- 'OK' else dum <- 'NOK'
a<-table.element(a,dum)
a<-table.row.end(a)
a<-table.row.start(a)
a<-table.element(a,'10% type I error level',header=TRUE)
a<-table.element(a,numsignificant10)
a<-table.element(a,numsignificant10/numgqtests)
if (numsignificant10/numgqtests < 0.1) dum <- 'OK' else dum <- 'NOK'
a<-table.element(a,dum)
a<-table.row.end(a)
a<-table.end(a)
table.save(a,file='mytable6.tab')
}