| Multiple Linear Regression - Estimated Regression Equation |
| WklBe[t] = + 78.3799061515617 + 14.6195874973145X[t] + 0.898113780807656Y1[t] -20.7234367469645M1[t] -27.0811350164046M2[t] -28.2616920464878M3[t] -11.6422490765710M4[t] -11.2092314050304M5[t] -16.9965909773283M6[t] -21.6360223524573M7[t] -18.3441303358710M8[t] -24.6650706863537M9[t] -12.0177055958290M10[t] + 37.5949348318731M11[t] -0.388490745478934t + e[t] |
| Multiple Linear Regression - Ordinary Least Squares | |||||
| Variable | Parameter | S.D. | T-STAT H0: parameter = 0 | 2-tail p-value | 1-tail p-value |
| (Intercept) | 78.3799061515617 | 26.479551 | 2.96 | 0.00485 | 0.002425 |
| X | 14.6195874973145 | 3.288852 | 4.4452 | 5.5e-05 | 2.8e-05 |
| Y1 | 0.898113780807656 | 0.039915 | 22.5009 | 0 | 0 |
| M1 | -20.7234367469645 | 3.953963 | -5.2412 | 4e-06 | 2e-06 |
| M2 | -27.0811350164046 | 4.204585 | -6.4409 | 0 | 0 |
| M3 | -28.2616920464878 | 4.32882 | -6.5287 | 0 | 0 |
| M4 | -11.6422490765710 | 4.511667 | -2.5805 | 0.013123 | 0.006562 |
| M5 | -11.2092314050304 | 4.428655 | -2.5311 | 0.014855 | 0.007427 |
| M6 | -16.9965909773283 | 4.356003 | -3.9019 | 0.000309 | 0.000155 |
| M7 | -21.6360223524573 | 4.377076 | -4.943 | 1.1e-05 | 5e-06 |
| M8 | -18.3441303358710 | 4.473265 | -4.1008 | 0.000166 | 8.3e-05 |
| M9 | -24.6650706863537 | 4.515308 | -5.4625 | 2e-06 | 1e-06 |
| M10 | -12.0177055958290 | 4.67794 | -2.569 | 0.013508 | 0.006754 |
| M11 | 37.5949348318731 | 4.590183 | 8.1903 | 0 | 0 |
| t | -0.388490745478934 | 0.11461 | -3.3897 | 0.001445 | 0.000722 |
| Multiple Linear Regression - Regression Statistics | |
| Multiple R | 0.991014050333522 |
| R-squared | 0.982108847958452 |
| Adjusted R-squared | 0.976663714728416 |
| F-TEST (value) | 180.364521209686 |
| F-TEST (DF numerator) | 14 |
| F-TEST (DF denominator) | 46 |
| p-value | 0 |
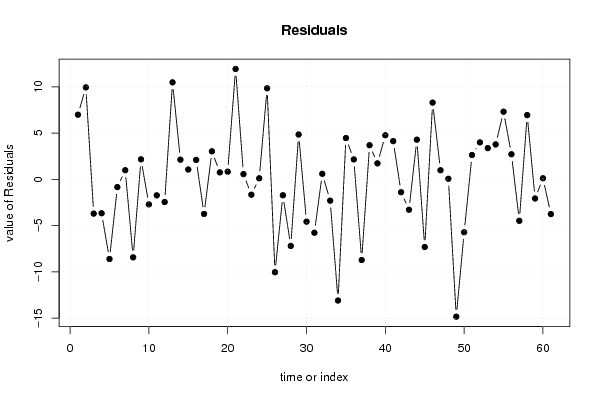
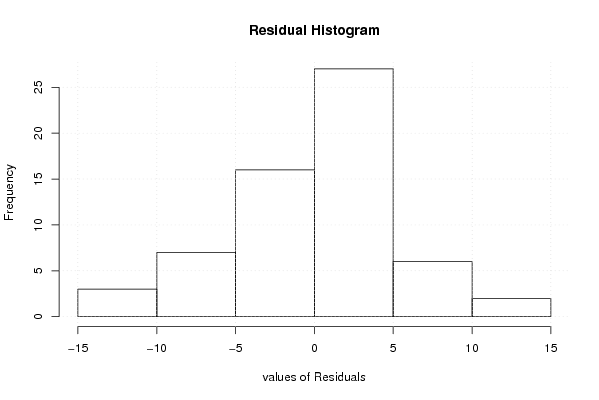
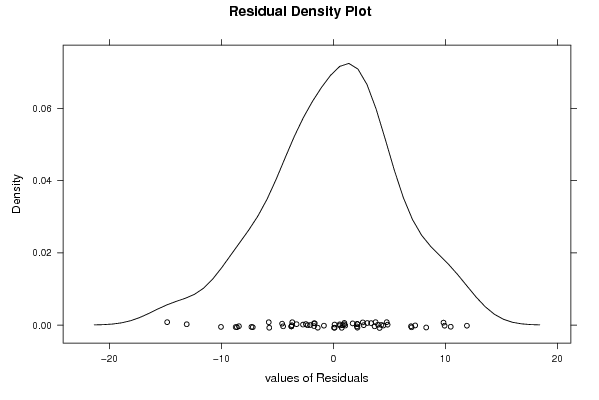
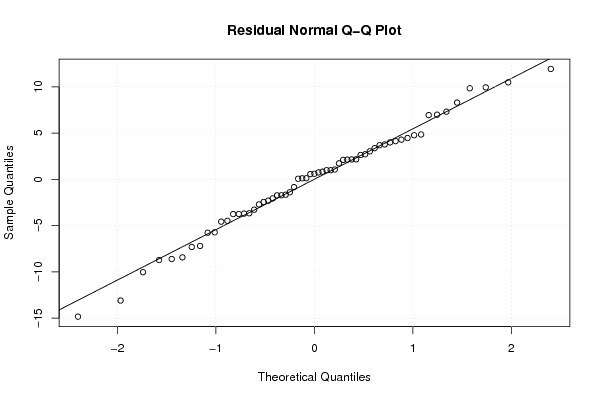
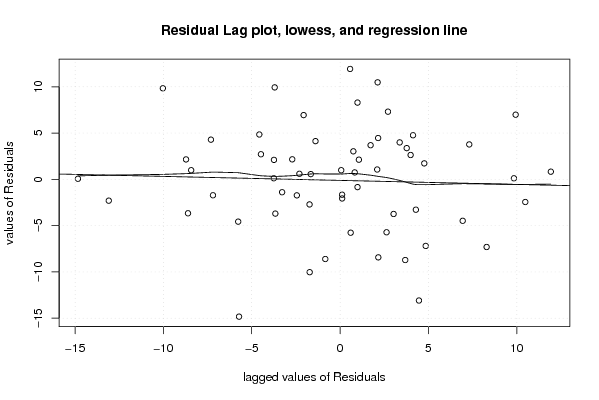
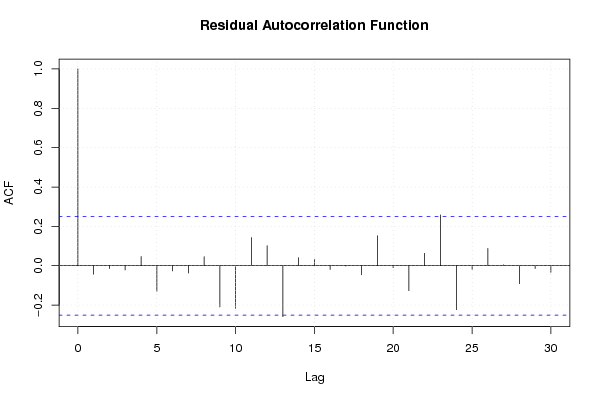
| Multiple Linear Regression - Residual Statistics | |
| Residual Standard Deviation | 6.42361458238997 |
| Sum Squared Residuals | 1898.08991794228 |
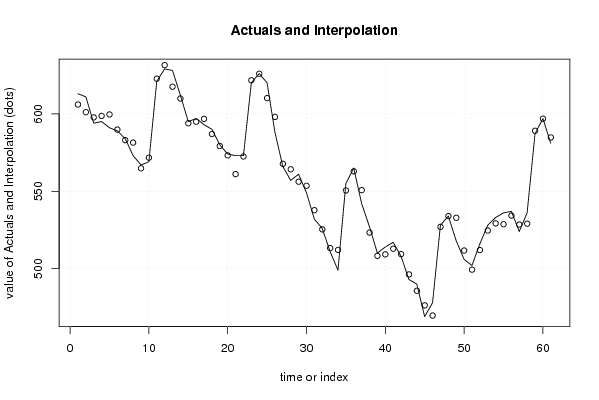
| Multiple Linear Regression - Actuals, Interpolation, and Residuals | |||
| Time or Index | Actuals | Interpolation Forecast | Residuals Prediction Error |
| 1 | 613 | 606.015498732596 | 6.98450126740352 |
| 2 | 611 | 601.065537279292 | 9.934462720708 |
| 3 | 594 | 597.700261942114 | -3.70026194211452 |
| 4 | 595 | 598.663279892822 | -3.66327989282235 |
| 5 | 591 | 599.605920599692 | -8.6059205996916 |
| 6 | 589 | 589.837615158684 | -0.837615158684151 |
| 7 | 584 | 583.013465476461 | 0.986534523539002 |
| 8 | 573 | 581.42629784353 | -8.42629784353008 |
| 9 | 567 | 564.837615158684 | 2.16238484131586 |
| 10 | 569 | 571.707806818884 | -2.70780681888394 |
| 11 | 621 | 622.728184062722 | -1.72818406272239 |
| 12 | 629 | 631.446675087369 | -2.44667508736856 |
| 13 | 628 | 617.519657841386 | 10.4803421586136 |
| 14 | 612 | 609.87535504566 | 2.12464495434040 |
| 15 | 595 | 593.936486777175 | 1.06351322282496 |
| 16 | 597 | 594.899504727883 | 2.10049527211723 |
| 17 | 593 | 596.74025921556 | -3.74025921555972 |
| 18 | 590 | 586.971953774552 | 3.02804622544775 |
| 19 | 580 | 579.249690311521 | 0.750309688478562 |
| 20 | 574 | 573.171953774552 | 0.828046225447751 |
| 21 | 573 | 561.073839993745 | 11.9261600062554 |
| 22 | 573 | 572.434600557983 | 0.565399442017315 |
| 23 | 620 | 621.658750240206 | -1.65875024020584 |
| 24 | 626 | 625.886672360814 | 0.113327639186318 |
| 25 | 620 | 610.163427553216 | 9.83657244678383 |
| 26 | 588 | 598.028555853451 | -10.0285558534512 |
| 27 | 566 | 567.719867092044 | -1.71986709204409 |
| 28 | 557 | 564.192316138714 | -7.19231613871355 |
| 29 | 561 | 556.153819037506 | 4.84618096249371 |
| 30 | 549 | 553.57042384296 | -4.57042384296006 |
| 31 | 532 | 537.76513635266 | -5.76513635266034 |
| 32 | 526 | 525.400603350038 | 0.599396649962425 |
| 33 | 511 | 513.30248956923 | -2.30248956922991 |
| 34 | 499 | 512.089657202161 | -13.0896572021608 |
| 35 | 555 | 550.536441514692 | 4.46355848530787 |
| 36 | 565 | 562.847387662569 | 2.15261233743114 |
| 37 | 542 | 550.716597978202 | -8.71659797820196 |
| 38 | 527 | 523.313792004707 | 3.68620799529316 |
| 39 | 510 | 508.27303751703 | 1.72696248297010 |
| 40 | 514 | 509.236055467738 | 4.76394453226237 |
| 41 | 517 | 512.87303751703 | 4.12696248297012 |
| 42 | 508 | 509.391528541676 | -1.39152854167601 |
| 43 | 493 | 496.280582393799 | -3.28058239379926 |
| 44 | 490 | 485.712276952792 | 4.2877230472082 |
| 45 | 469 | 476.308504514407 | -7.30850451440711 |
| 46 | 478 | 469.706989462492 | 8.2930105375079 |
| 47 | 528 | 527.014163171984 | 0.985836828015844 |
| 48 | 534 | 533.936426635015 | 0.063573364985062 |
| 49 | 518 | 532.832769324732 | -14.8327693247320 |
| 50 | 506 | 511.71675981689 | -5.71675981689042 |
| 51 | 502 | 499.370346671636 | 2.62965332836356 |
| 52 | 516 | 512.008843772844 | 3.99115622715631 |
| 53 | 528 | 524.626963630213 | 3.37303636978748 |
| 54 | 533 | 529.228478682128 | 3.77152131787247 |
| 55 | 536 | 528.691125465558 | 7.30887453444203 |
| 56 | 537 | 534.288868079088 | 2.71113192091170 |
| 57 | 524 | 528.477550763934 | -4.47755076393423 |
| 58 | 536 | 529.06094595848 | 6.93905404151954 |
| 59 | 587 | 589.062461010396 | -2.06246101039548 |
| 60 | 597 | 596.882838254234 | 0.117161745766061 |
| 61 | 581 | 584.752048569867 | -3.75204856986706 |
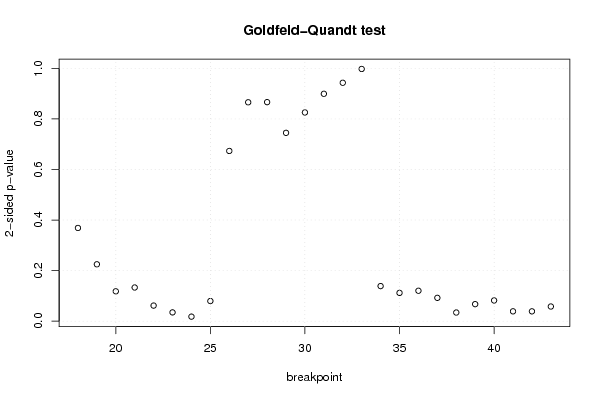
| Goldfeld-Quandt test for Heteroskedasticity | |||
| p-values | Alternative Hypothesis | ||
| breakpoint index | greater | 2-sided | less |
| 18 | 0.184311703662680 | 0.368623407325359 | 0.81568829633732 |
| 19 | 0.112462404175104 | 0.224924808350208 | 0.887537595824896 |
| 20 | 0.0590282321957096 | 0.118056464391419 | 0.94097176780429 |
| 21 | 0.0665574323850992 | 0.133114864770198 | 0.9334425676149 |
| 22 | 0.0307951655398725 | 0.0615903310797449 | 0.969204834460128 |
| 23 | 0.0173572421928665 | 0.0347144843857331 | 0.982642757807134 |
| 24 | 0.00890413147933768 | 0.0178082629586754 | 0.991095868520662 |
| 25 | 0.0397428852502019 | 0.0794857705004039 | 0.960257114749798 |
| 26 | 0.663342193988467 | 0.673315612023067 | 0.336657806011533 |
| 27 | 0.567097597544108 | 0.865804804911784 | 0.432902402455892 |
| 28 | 0.566784307602038 | 0.866431384795925 | 0.433215692397962 |
| 29 | 0.627546103508796 | 0.744907792982408 | 0.372453896491204 |
| 30 | 0.587205140439537 | 0.825589719120926 | 0.412794859560463 |
| 31 | 0.550303074322729 | 0.899393851354543 | 0.449696925677271 |
| 32 | 0.471488502244588 | 0.942977004489176 | 0.528511497755412 |
| 33 | 0.498841453065955 | 0.99768290613191 | 0.501158546934045 |
| 34 | 0.93063954398019 | 0.138720912039621 | 0.0693604560198104 |
| 35 | 0.94409004578764 | 0.111819908424721 | 0.0559099542123607 |
| 36 | 0.93986246051344 | 0.120275078973122 | 0.0601375394865612 |
| 37 | 0.953888264595582 | 0.0922234708088362 | 0.0461117354044181 |
| 38 | 0.982939448518759 | 0.0341211029624829 | 0.0170605514812415 |
| 39 | 0.96637143545757 | 0.0672571290848587 | 0.0336285645424294 |
| 40 | 0.95903041019747 | 0.081939179605061 | 0.0409695898025305 |
| 41 | 0.9805407502295 | 0.0389184995410022 | 0.0194592497705011 |
| 42 | 0.980583891790982 | 0.0388322164180356 | 0.0194161082090178 |
| 43 | 0.9710323120147 | 0.0579353759706005 | 0.0289676879853002 |
| Meta Analysis of Goldfeld-Quandt test for Heteroskedasticity | |||
| Description | # significant tests | % significant tests | OK/NOK |
| 1% type I error level | 0 | 0 | OK |
| 5% type I error level | 5 | 0.192307692307692 | NOK |
| 10% type I error level | 11 | 0.423076923076923 | NOK |