Free Statistics

of Irreproducible Research!

Author's title

Author*The author of this computation has been verified*
R Software Modulerwasp_multipleregression.wasp
Title produced by softwareMultiple Regression
Date of computationFri, 20 Nov 2009 07:21:10 -0700
Cite this page as followsStatistical Computations at FreeStatistics.org, Office for Research Development and Education, URL https://freestatistics.org/blog/index.php?v=date/2009/Nov/20/t1258728032yjst5ejacf95yvf.htm/, Retrieved Sat, 20 Apr 2024 01:40:55 +0000
Statistical Computations at FreeStatistics.org, Office for Research Development and Education, URL https://freestatistics.org/blog/index.php?pk=58219, Retrieved Sat, 20 Apr 2024 01:40:55 +0000
QR Codes:

Original text written by user:
IsPrivate?No (this computation is public)
User-defined keywords
Estimated Impact133
Family? (F = Feedback message, R = changed R code, M = changed R Module, P = changed Parameters, D = changed Data)
-     [Multiple Regression] [Q1 The Seatbeltlaw] [2007-11-14 19:27:43] [8cd6641b921d30ebe00b648d1481bba0]
- RMPD  [Multiple Regression] [Seatbelt] [2009-11-12 14:03:14] [b98453cac15ba1066b407e146608df68]
-    D      [Multiple Regression] [ws7] [2009-11-20 14:21:10] [557d56ec4b06cd0135c259898de8ce95] [Current]
-    D        [Multiple Regression] [] [2009-11-25 20:53:06] [ba905ddf7cdf9ecb063c35348c4dab2e]
Feedback Forum

Post a new message
Dataseries X:
10284.5	1.038351422	1.4
12792	0.933031106	1.3
12823.61538	0.932783124	1.3
13845.66667	0.953755367	1.2
15335.63636	1.009865664	1.1
11188.5	0.979532493	1.4
13633.25	0.98651077	1.2
12298.46667	0.964661281	1.5
15353.63636	0.946761816	1.1
12696.15385	0.959068881	1.3
12213.93333	0.985710058	1.5
13683.72727	0.92582159	1.1
11214.14286	1.036865325	1.4
13950.23077	0.944443576	1.3
11179.13333	0.944901812	1.5
11801.875	0.989151445	1.6
11188.82353	1.054361624	1.7
16456.27273	1.033478919	1.1
11110.0625	1.001368875	1.6
16530.69231	1.019812646	1.3
10038.41176	0.993902155	1.7
11681.25	0.961444482	1.6
11148.88235	0.957449711	1.7
8631	0.93308639	1.9
9386.444444	1.045170549	1.8
9764.736842	0.953166261	1.9
12043.75	0.966782226	1.6
12948.06667	0.972992606	1.5
10987.125	1.013607482	1.6
11648.3125	0.984839518	1.6
10633.35294	0.973220775	1.7
10219.3	0.957284573	2
9037.6	0.972067159	2
10296.31579	0.986878944	1.9
11705.41176	0.954654488	1.7
10681.94444	0.978986976	1.8
9362.947368	1.003056035	1.9
11306.35294	0.970081156	1.7
10984.45	0.991376354	2
10062.61905	1.022609041	2.1
8118.583333	1.089901216	2.4
8867.48	1.060373568	2.5
8346.72	0.985952627	2.5
8529.307692	1.037512164	2.6
10697.18182	1.025335152	2.2
8591.84	1.006376649	2.5
8695.607143	1.018762056	2.8
8125.571429	1.01601847	2.8
7009.758621	1.112410461	2.9
7883.466667	1.037903689	3
7527.645161	1.045436015	3.1
6763.758621	1.09935434	2.9
6682.333333	1.101920787	2.7
7855.681818	1.080574973	2.2
6738.88	1.024388761	2.5
7895.434783	1.024282249	2.3
6361.884615	0.993865289	2.6
6935.956522	0.984935203	2.3
8344.454545	1.005791114	2.2
9107.944444	0.94742834	1.8


Summary of computational transaction
Raw Inputview raw input (R code)
Raw Outputview raw output of R engine
Computing time8 seconds
R Server'Gwilym Jenkins' @ 72.249.127.135

\begin{tabular}{lllllllll}
\hline
Summary of computational transaction \tabularnewline
Raw Input & view raw input (R code)  \tabularnewline
Raw Output & view raw output of R engine  \tabularnewline
Computing time & 8 seconds \tabularnewline
R Server & 'Gwilym Jenkins' @ 72.249.127.135 \tabularnewline
\hline
\end{tabular}
%Source: https://freestatistics.org/blog/index.php?pk=58219&T=0

[TABLE]
[ROW][C]Summary of computational transaction[/C][/ROW]
[ROW][C]Raw Input[/C][C]view raw input (R code) [/C][/ROW]
[ROW][C]Raw Output[/C][C]view raw output of R engine [/C][/ROW]
[ROW][C]Computing time[/C][C]8 seconds[/C][/ROW]
[ROW][C]R Server[/C][C]'Gwilym Jenkins' @ 72.249.127.135[/C][/ROW]
[/TABLE]
Source: https://freestatistics.org/blog/index.php?pk=58219&T=0

Globally Unique Identifier (entire table): ba.freestatistics.org/blog/index.php?pk=58219&T=0

As an alternative you can also use a QR Code:  

The GUIDs for individual cells are displayed in the table below:

Summary of computational transaction
Raw Inputview raw input (R code)
Raw Outputview raw output of R engine
Computing time8 seconds
R Server'Gwilym Jenkins' @ 72.249.127.135


Multiple Linear Regression - Estimated Regression Equation
Invoer/inflatie[t] = + 609.166987055855 + 19553.7411763901`Uitvoer/inflatie`[t] -4968.06824936545Inflatie[t] -2293.74599688658M1[t] + 748.788773984817M2[t] + 652.42614918149M3[t] + 14.0241082018048M4[t] -1315.63792759216M5[t] -758.668421233577M6[t] -519.441502684909M7[t] + 555.88998307813M8[t] -60.2757250744329M9[t] -187.771360832577M10[t] + 399.126243757439M11[t] + e[t]

\begin{tabular}{lllllllll}
\hline
Multiple Linear Regression - Estimated Regression Equation \tabularnewline
Invoer/inflatie[t] =  +  609.166987055855 +  19553.7411763901`Uitvoer/inflatie`[t] -4968.06824936545Inflatie[t] -2293.74599688658M1[t] +  748.788773984817M2[t] +  652.42614918149M3[t] +  14.0241082018048M4[t] -1315.63792759216M5[t] -758.668421233577M6[t] -519.441502684909M7[t] +  555.88998307813M8[t] -60.2757250744329M9[t] -187.771360832577M10[t] +  399.126243757439M11[t]  + e[t] \tabularnewline
\hline
\end{tabular}
%Source: https://freestatistics.org/blog/index.php?pk=58219&T=1

[TABLE]
[ROW][C]Multiple Linear Regression - Estimated Regression Equation[/C][/ROW]
[ROW][C]Invoer/inflatie[t] =  +  609.166987055855 +  19553.7411763901`Uitvoer/inflatie`[t] -4968.06824936545Inflatie[t] -2293.74599688658M1[t] +  748.788773984817M2[t] +  652.42614918149M3[t] +  14.0241082018048M4[t] -1315.63792759216M5[t] -758.668421233577M6[t] -519.441502684909M7[t] +  555.88998307813M8[t] -60.2757250744329M9[t] -187.771360832577M10[t] +  399.126243757439M11[t]  + e[t][/C][/ROW]
[/TABLE]
Source: https://freestatistics.org/blog/index.php?pk=58219&T=1

Globally Unique Identifier (entire table): ba.freestatistics.org/blog/index.php?pk=58219&T=1

As an alternative you can also use a QR Code:  

The GUIDs for individual cells are displayed in the table below:

Multiple Linear Regression - Estimated Regression Equation
Invoer/inflatie[t] = + 609.166987055855 + 19553.7411763901`Uitvoer/inflatie`[t] -4968.06824936545Inflatie[t] -2293.74599688658M1[t] + 748.788773984817M2[t] + 652.42614918149M3[t] + 14.0241082018048M4[t] -1315.63792759216M5[t] -758.668421233577M6[t] -519.441502684909M7[t] + 555.88998307813M8[t] -60.2757250744329M9[t] -187.771360832577M10[t] + 399.126243757439M11[t] + e[t]


Multiple Linear Regression - Ordinary Least Squares
VariableParameterS.D.T-STATH0: parameter = 02-tail p-value1-tail p-value
(Intercept)609.1669870558556142.5148040.09920.9214320.460716
`Uitvoer/inflatie`19553.74117639017059.0106712.770.0080570.004029
Inflatie-4968.06824936545446.032479-11.138400
M1-2293.74599688658930.868751-2.46410.0175340.008767
M2748.788773984817703.4240321.06450.2926620.146331
M3652.42614918149708.0921170.92140.3616560.180828
M414.0241082018048778.8378150.0180.9857120.492856
M5-1315.63792759216958.077895-1.37320.1763450.088173
M6-758.668421233577872.449772-0.86960.3890430.194521
M7-519.441502684909737.90079-0.70390.4850150.242508
M8555.88998307813748.3965420.74280.4613950.230697
M9-60.2757250744329720.560054-0.08370.9336970.466848
M10-187.771360832577710.956807-0.26410.7928740.396437
M11399.126243757439713.5094680.55940.5786130.289306

\begin{tabular}{lllllllll}
\hline
Multiple Linear Regression - Ordinary Least Squares \tabularnewline
Variable & Parameter & S.D. & T-STATH0: parameter = 0 & 2-tail p-value & 1-tail p-value \tabularnewline
(Intercept) & 609.166987055855 & 6142.514804 & 0.0992 & 0.921432 & 0.460716 \tabularnewline
`Uitvoer/inflatie` & 19553.7411763901 & 7059.010671 & 2.77 & 0.008057 & 0.004029 \tabularnewline
Inflatie & -4968.06824936545 & 446.032479 & -11.1384 & 0 & 0 \tabularnewline
M1 & -2293.74599688658 & 930.868751 & -2.4641 & 0.017534 & 0.008767 \tabularnewline
M2 & 748.788773984817 & 703.424032 & 1.0645 & 0.292662 & 0.146331 \tabularnewline
M3 & 652.42614918149 & 708.092117 & 0.9214 & 0.361656 & 0.180828 \tabularnewline
M4 & 14.0241082018048 & 778.837815 & 0.018 & 0.985712 & 0.492856 \tabularnewline
M5 & -1315.63792759216 & 958.077895 & -1.3732 & 0.176345 & 0.088173 \tabularnewline
M6 & -758.668421233577 & 872.449772 & -0.8696 & 0.389043 & 0.194521 \tabularnewline
M7 & -519.441502684909 & 737.90079 & -0.7039 & 0.485015 & 0.242508 \tabularnewline
M8 & 555.88998307813 & 748.396542 & 0.7428 & 0.461395 & 0.230697 \tabularnewline
M9 & -60.2757250744329 & 720.560054 & -0.0837 & 0.933697 & 0.466848 \tabularnewline
M10 & -187.771360832577 & 710.956807 & -0.2641 & 0.792874 & 0.396437 \tabularnewline
M11 & 399.126243757439 & 713.509468 & 0.5594 & 0.578613 & 0.289306 \tabularnewline
\hline
\end{tabular}
%Source: https://freestatistics.org/blog/index.php?pk=58219&T=2

[TABLE]
[ROW][C]Multiple Linear Regression - Ordinary Least Squares[/C][/ROW]
[ROW][C]Variable[/C][C]Parameter[/C][C]S.D.[/C][C]T-STATH0: parameter = 0[/C][C]2-tail p-value[/C][C]1-tail p-value[/C][/ROW]
[ROW][C](Intercept)[/C][C]609.166987055855[/C][C]6142.514804[/C][C]0.0992[/C][C]0.921432[/C][C]0.460716[/C][/ROW]
[ROW][C]`Uitvoer/inflatie`[/C][C]19553.7411763901[/C][C]7059.010671[/C][C]2.77[/C][C]0.008057[/C][C]0.004029[/C][/ROW]
[ROW][C]Inflatie[/C][C]-4968.06824936545[/C][C]446.032479[/C][C]-11.1384[/C][C]0[/C][C]0[/C][/ROW]
[ROW][C]M1[/C][C]-2293.74599688658[/C][C]930.868751[/C][C]-2.4641[/C][C]0.017534[/C][C]0.008767[/C][/ROW]
[ROW][C]M2[/C][C]748.788773984817[/C][C]703.424032[/C][C]1.0645[/C][C]0.292662[/C][C]0.146331[/C][/ROW]
[ROW][C]M3[/C][C]652.42614918149[/C][C]708.092117[/C][C]0.9214[/C][C]0.361656[/C][C]0.180828[/C][/ROW]
[ROW][C]M4[/C][C]14.0241082018048[/C][C]778.837815[/C][C]0.018[/C][C]0.985712[/C][C]0.492856[/C][/ROW]
[ROW][C]M5[/C][C]-1315.63792759216[/C][C]958.077895[/C][C]-1.3732[/C][C]0.176345[/C][C]0.088173[/C][/ROW]
[ROW][C]M6[/C][C]-758.668421233577[/C][C]872.449772[/C][C]-0.8696[/C][C]0.389043[/C][C]0.194521[/C][/ROW]
[ROW][C]M7[/C][C]-519.441502684909[/C][C]737.90079[/C][C]-0.7039[/C][C]0.485015[/C][C]0.242508[/C][/ROW]
[ROW][C]M8[/C][C]555.88998307813[/C][C]748.396542[/C][C]0.7428[/C][C]0.461395[/C][C]0.230697[/C][/ROW]
[ROW][C]M9[/C][C]-60.2757250744329[/C][C]720.560054[/C][C]-0.0837[/C][C]0.933697[/C][C]0.466848[/C][/ROW]
[ROW][C]M10[/C][C]-187.771360832577[/C][C]710.956807[/C][C]-0.2641[/C][C]0.792874[/C][C]0.396437[/C][/ROW]
[ROW][C]M11[/C][C]399.126243757439[/C][C]713.509468[/C][C]0.5594[/C][C]0.578613[/C][C]0.289306[/C][/ROW]
[/TABLE]
Source: https://freestatistics.org/blog/index.php?pk=58219&T=2

Globally Unique Identifier (entire table): ba.freestatistics.org/blog/index.php?pk=58219&T=2

As an alternative you can also use a QR Code:  

The GUIDs for individual cells are displayed in the table below:

Multiple Linear Regression - Ordinary Least Squares
VariableParameterS.D.T-STATH0: parameter = 02-tail p-value1-tail p-value
(Intercept)609.1669870558556142.5148040.09920.9214320.460716
`Uitvoer/inflatie`19553.74117639017059.0106712.770.0080570.004029
Inflatie-4968.06824936545446.032479-11.138400
M1-2293.74599688658930.868751-2.46410.0175340.008767
M2748.788773984817703.4240321.06450.2926620.146331
M3652.42614918149708.0921170.92140.3616560.180828
M414.0241082018048778.8378150.0180.9857120.492856
M5-1315.63792759216958.077895-1.37320.1763450.088173
M6-758.668421233577872.449772-0.86960.3890430.194521
M7-519.441502684909737.90079-0.70390.4850150.242508
M8555.88998307813748.3965420.74280.4613950.230697
M9-60.2757250744329720.560054-0.08370.9336970.466848
M10-187.771360832577710.956807-0.26410.7928740.396437
M11399.126243757439713.5094680.55940.5786130.289306


Multiple Linear Regression - Regression Statistics
Multiple R0.918613524596436
R-squared0.843850807571488
Adjusted R-squared0.799721687972126
F-TEST (value)19.1223123242115
F-TEST (DF numerator)13
F-TEST (DF denominator)46
p-value2.55351295663786e-14
Multiple Linear Regression - Residual Statistics
Residual Standard Deviation1107.02513224762
Sum Squared Residuals56373213.5976813

\begin{tabular}{lllllllll}
\hline
Multiple Linear Regression - Regression Statistics \tabularnewline
Multiple R & 0.918613524596436 \tabularnewline
R-squared & 0.843850807571488 \tabularnewline
Adjusted R-squared & 0.799721687972126 \tabularnewline
F-TEST (value) & 19.1223123242115 \tabularnewline
F-TEST (DF numerator) & 13 \tabularnewline
F-TEST (DF denominator) & 46 \tabularnewline
p-value & 2.55351295663786e-14 \tabularnewline
Multiple Linear Regression - Residual Statistics \tabularnewline
Residual Standard Deviation & 1107.02513224762 \tabularnewline
Sum Squared Residuals & 56373213.5976813 \tabularnewline
\hline
\end{tabular}
%Source: https://freestatistics.org/blog/index.php?pk=58219&T=3

[TABLE]
[ROW][C]Multiple Linear Regression - Regression Statistics[/C][/ROW]
[ROW][C]Multiple R[/C][C]0.918613524596436[/C][/ROW]
[ROW][C]R-squared[/C][C]0.843850807571488[/C][/ROW]
[ROW][C]Adjusted R-squared[/C][C]0.799721687972126[/C][/ROW]
[ROW][C]F-TEST (value)[/C][C]19.1223123242115[/C][/ROW]
[ROW][C]F-TEST (DF numerator)[/C][C]13[/C][/ROW]
[ROW][C]F-TEST (DF denominator)[/C][C]46[/C][/ROW]
[ROW][C]p-value[/C][C]2.55351295663786e-14[/C][/ROW]
[ROW][C]Multiple Linear Regression - Residual Statistics[/C][/ROW]
[ROW][C]Residual Standard Deviation[/C][C]1107.02513224762[/C][/ROW]
[ROW][C]Sum Squared Residuals[/C][C]56373213.5976813[/C][/ROW]
[/TABLE]
Source: https://freestatistics.org/blog/index.php?pk=58219&T=3

Globally Unique Identifier (entire table): ba.freestatistics.org/blog/index.php?pk=58219&T=3

As an alternative you can also use a QR Code:  

The GUIDs for individual cells are displayed in the table below:

Multiple Linear Regression - Regression Statistics
Multiple R0.918613524596436
R-squared0.843850807571488
Adjusted R-squared0.799721687972126
F-TEST (value)19.1223123242115
F-TEST (DF numerator)13
F-TEST (DF denominator)46
p-value2.55351295663786e-14
Multiple Linear Regression - Residual Statistics
Residual Standard Deviation1107.02513224762
Sum Squared Residuals56373213.5976813


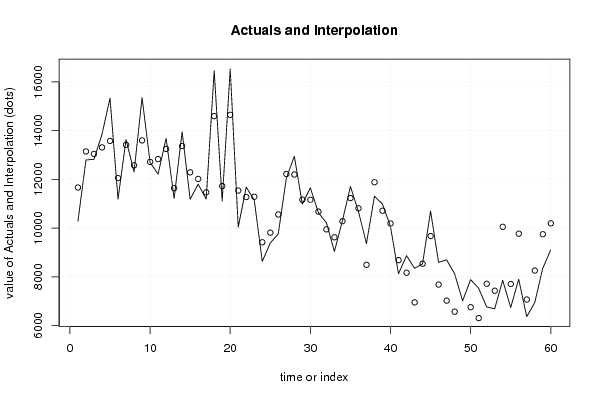
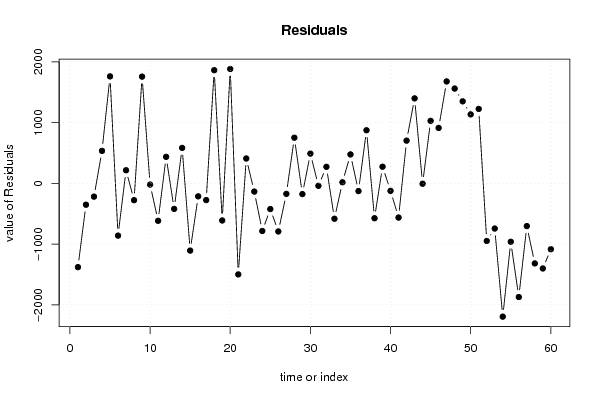
Multiple Linear Regression - Actuals, Interpolation, and Residuals
Time or IndexActualsInterpolationForecastResidualsPrediction Error
110284.511663.7803969823-1379.28039698228
21279213143.7157931106-351.715793110617
312823.6153813042.5041924629-218.888812462891
413845.6666713310.9947879301534.671882069892
515335.6363613575.30580194111760.33055805893
611188.512048.7278586968-860.227858696835
713633.2513418.0198494337215.230150566253
812298.4666712575.6916076448-277.22493764477
915353.6363613596.75169343251756.88466656747
1012696.1538512716.2915714523-20.1377214523066
1112213.9333312830.5102058616-616.576875861633
1213683.7272713247.5676591278436.159610872151
1311214.1428611634.7216408813-420.578780881293
1413950.2307713366.8722776739583.358492326066
1511179.1333312285.8562311392-1106.72290113922
1611801.87512015.8932360552-214.018236055246
1711188.8235311464.5273375568-275.703807556811
1816456.2727314594.00278490181862.26994509825
1911110.062511721.3240892292-611.261589229198
2016530.6923114647.72077425251882.97153574752
2110038.4117611537.6807315866-1499.26897158655
2211681.2511272.3229837350408.927016264954
2311148.8823511284.3010451956-135.418695195568
2486319415.16707853373-784.16707853373
259386.4444449809.89254164306-423.448097643058
269764.73684210556.5924529078-791.855610907849
2712043.7512216.8933583909-173.143358390942
2812948.0666712196.7343054748751.332364525167
2910987.12511164.4382179595-177.313217959505
3011648.312511158.8864020904489.426097909624
3110633.3529410674.1166022855-40.763662285505
3210219.39947.41524399624271.884756003761
339037.69620.3043964054-582.704396405403
3410296.3157910279.241395834117.0743941658583
3511705.4117611229.6439781233475.767781876726
3610681.9444410809.5020819589-127.557641958910
379362.9473688489.58941018105873.357957818947
3811306.3529411880.9555816368-574.602641636753
3910984.4510710.5732720158273.876727984227
4010062.6190510186.0802839407-123.461233940748
418118.5833338681.8115464835-563.2282134835
428867.488164.59824136598702.881758634016
438346.726948.617341497251398.10265850275
448529.3076928535.32384399626-6.0161519962549
4510697.181829668.279294640081028.90252535992
468591.847679.65352331848912.18647668152
478695.6071437018.311695941111677.29544705889
488125.5714296565.538081644511560.03334735549
497009.7586215659.809303312321349.94931768769
507883.4666676748.651113670851134.81555332915
517527.6451616302.766816991171224.87834400883
526763.7586217712.28339759907-948.524776599065
536682.3333337426.41865205911-744.085319059113
547855.68181810050.0317609451-2194.34994294505
556738.887700.1875575543-961.3075575543
567895.4347839767.04998511025-1871.61520211025
576361.8846157065.69843893544-703.81382393544
586935.9565228254.00668766003-1318.05016566003
598344.4545459745.52220287841-1401.06765787841
609107.94444410192.412681735-1084.46823773500

\begin{tabular}{lllllllll}
\hline
Multiple Linear Regression - Actuals, Interpolation, and Residuals \tabularnewline
Time or Index & Actuals & InterpolationForecast & ResidualsPrediction Error \tabularnewline
1 & 10284.5 & 11663.7803969823 & -1379.28039698228 \tabularnewline
2 & 12792 & 13143.7157931106 & -351.715793110617 \tabularnewline
3 & 12823.61538 & 13042.5041924629 & -218.888812462891 \tabularnewline
4 & 13845.66667 & 13310.9947879301 & 534.671882069892 \tabularnewline
5 & 15335.63636 & 13575.3058019411 & 1760.33055805893 \tabularnewline
6 & 11188.5 & 12048.7278586968 & -860.227858696835 \tabularnewline
7 & 13633.25 & 13418.0198494337 & 215.230150566253 \tabularnewline
8 & 12298.46667 & 12575.6916076448 & -277.22493764477 \tabularnewline
9 & 15353.63636 & 13596.7516934325 & 1756.88466656747 \tabularnewline
10 & 12696.15385 & 12716.2915714523 & -20.1377214523066 \tabularnewline
11 & 12213.93333 & 12830.5102058616 & -616.576875861633 \tabularnewline
12 & 13683.72727 & 13247.5676591278 & 436.159610872151 \tabularnewline
13 & 11214.14286 & 11634.7216408813 & -420.578780881293 \tabularnewline
14 & 13950.23077 & 13366.8722776739 & 583.358492326066 \tabularnewline
15 & 11179.13333 & 12285.8562311392 & -1106.72290113922 \tabularnewline
16 & 11801.875 & 12015.8932360552 & -214.018236055246 \tabularnewline
17 & 11188.82353 & 11464.5273375568 & -275.703807556811 \tabularnewline
18 & 16456.27273 & 14594.0027849018 & 1862.26994509825 \tabularnewline
19 & 11110.0625 & 11721.3240892292 & -611.261589229198 \tabularnewline
20 & 16530.69231 & 14647.7207742525 & 1882.97153574752 \tabularnewline
21 & 10038.41176 & 11537.6807315866 & -1499.26897158655 \tabularnewline
22 & 11681.25 & 11272.3229837350 & 408.927016264954 \tabularnewline
23 & 11148.88235 & 11284.3010451956 & -135.418695195568 \tabularnewline
24 & 8631 & 9415.16707853373 & -784.16707853373 \tabularnewline
25 & 9386.444444 & 9809.89254164306 & -423.448097643058 \tabularnewline
26 & 9764.736842 & 10556.5924529078 & -791.855610907849 \tabularnewline
27 & 12043.75 & 12216.8933583909 & -173.143358390942 \tabularnewline
28 & 12948.06667 & 12196.7343054748 & 751.332364525167 \tabularnewline
29 & 10987.125 & 11164.4382179595 & -177.313217959505 \tabularnewline
30 & 11648.3125 & 11158.8864020904 & 489.426097909624 \tabularnewline
31 & 10633.35294 & 10674.1166022855 & -40.763662285505 \tabularnewline
32 & 10219.3 & 9947.41524399624 & 271.884756003761 \tabularnewline
33 & 9037.6 & 9620.3043964054 & -582.704396405403 \tabularnewline
34 & 10296.31579 & 10279.2413958341 & 17.0743941658583 \tabularnewline
35 & 11705.41176 & 11229.6439781233 & 475.767781876726 \tabularnewline
36 & 10681.94444 & 10809.5020819589 & -127.557641958910 \tabularnewline
37 & 9362.947368 & 8489.58941018105 & 873.357957818947 \tabularnewline
38 & 11306.35294 & 11880.9555816368 & -574.602641636753 \tabularnewline
39 & 10984.45 & 10710.5732720158 & 273.876727984227 \tabularnewline
40 & 10062.61905 & 10186.0802839407 & -123.461233940748 \tabularnewline
41 & 8118.583333 & 8681.8115464835 & -563.2282134835 \tabularnewline
42 & 8867.48 & 8164.59824136598 & 702.881758634016 \tabularnewline
43 & 8346.72 & 6948.61734149725 & 1398.10265850275 \tabularnewline
44 & 8529.307692 & 8535.32384399626 & -6.0161519962549 \tabularnewline
45 & 10697.18182 & 9668.27929464008 & 1028.90252535992 \tabularnewline
46 & 8591.84 & 7679.65352331848 & 912.18647668152 \tabularnewline
47 & 8695.607143 & 7018.31169594111 & 1677.29544705889 \tabularnewline
48 & 8125.571429 & 6565.53808164451 & 1560.03334735549 \tabularnewline
49 & 7009.758621 & 5659.80930331232 & 1349.94931768769 \tabularnewline
50 & 7883.466667 & 6748.65111367085 & 1134.81555332915 \tabularnewline
51 & 7527.645161 & 6302.76681699117 & 1224.87834400883 \tabularnewline
52 & 6763.758621 & 7712.28339759907 & -948.524776599065 \tabularnewline
53 & 6682.333333 & 7426.41865205911 & -744.085319059113 \tabularnewline
54 & 7855.681818 & 10050.0317609451 & -2194.34994294505 \tabularnewline
55 & 6738.88 & 7700.1875575543 & -961.3075575543 \tabularnewline
56 & 7895.434783 & 9767.04998511025 & -1871.61520211025 \tabularnewline
57 & 6361.884615 & 7065.69843893544 & -703.81382393544 \tabularnewline
58 & 6935.956522 & 8254.00668766003 & -1318.05016566003 \tabularnewline
59 & 8344.454545 & 9745.52220287841 & -1401.06765787841 \tabularnewline
60 & 9107.944444 & 10192.412681735 & -1084.46823773500 \tabularnewline
\hline
\end{tabular}
%Source: https://freestatistics.org/blog/index.php?pk=58219&T=4

[TABLE]
[ROW][C]Multiple Linear Regression - Actuals, Interpolation, and Residuals[/C][/ROW]
[ROW][C]Time or Index[/C][C]Actuals[/C][C]InterpolationForecast[/C][C]ResidualsPrediction Error[/C][/ROW]
[ROW][C]1[/C][C]10284.5[/C][C]11663.7803969823[/C][C]-1379.28039698228[/C][/ROW]
[ROW][C]2[/C][C]12792[/C][C]13143.7157931106[/C][C]-351.715793110617[/C][/ROW]
[ROW][C]3[/C][C]12823.61538[/C][C]13042.5041924629[/C][C]-218.888812462891[/C][/ROW]
[ROW][C]4[/C][C]13845.66667[/C][C]13310.9947879301[/C][C]534.671882069892[/C][/ROW]
[ROW][C]5[/C][C]15335.63636[/C][C]13575.3058019411[/C][C]1760.33055805893[/C][/ROW]
[ROW][C]6[/C][C]11188.5[/C][C]12048.7278586968[/C][C]-860.227858696835[/C][/ROW]
[ROW][C]7[/C][C]13633.25[/C][C]13418.0198494337[/C][C]215.230150566253[/C][/ROW]
[ROW][C]8[/C][C]12298.46667[/C][C]12575.6916076448[/C][C]-277.22493764477[/C][/ROW]
[ROW][C]9[/C][C]15353.63636[/C][C]13596.7516934325[/C][C]1756.88466656747[/C][/ROW]
[ROW][C]10[/C][C]12696.15385[/C][C]12716.2915714523[/C][C]-20.1377214523066[/C][/ROW]
[ROW][C]11[/C][C]12213.93333[/C][C]12830.5102058616[/C][C]-616.576875861633[/C][/ROW]
[ROW][C]12[/C][C]13683.72727[/C][C]13247.5676591278[/C][C]436.159610872151[/C][/ROW]
[ROW][C]13[/C][C]11214.14286[/C][C]11634.7216408813[/C][C]-420.578780881293[/C][/ROW]
[ROW][C]14[/C][C]13950.23077[/C][C]13366.8722776739[/C][C]583.358492326066[/C][/ROW]
[ROW][C]15[/C][C]11179.13333[/C][C]12285.8562311392[/C][C]-1106.72290113922[/C][/ROW]
[ROW][C]16[/C][C]11801.875[/C][C]12015.8932360552[/C][C]-214.018236055246[/C][/ROW]
[ROW][C]17[/C][C]11188.82353[/C][C]11464.5273375568[/C][C]-275.703807556811[/C][/ROW]
[ROW][C]18[/C][C]16456.27273[/C][C]14594.0027849018[/C][C]1862.26994509825[/C][/ROW]
[ROW][C]19[/C][C]11110.0625[/C][C]11721.3240892292[/C][C]-611.261589229198[/C][/ROW]
[ROW][C]20[/C][C]16530.69231[/C][C]14647.7207742525[/C][C]1882.97153574752[/C][/ROW]
[ROW][C]21[/C][C]10038.41176[/C][C]11537.6807315866[/C][C]-1499.26897158655[/C][/ROW]
[ROW][C]22[/C][C]11681.25[/C][C]11272.3229837350[/C][C]408.927016264954[/C][/ROW]
[ROW][C]23[/C][C]11148.88235[/C][C]11284.3010451956[/C][C]-135.418695195568[/C][/ROW]
[ROW][C]24[/C][C]8631[/C][C]9415.16707853373[/C][C]-784.16707853373[/C][/ROW]
[ROW][C]25[/C][C]9386.444444[/C][C]9809.89254164306[/C][C]-423.448097643058[/C][/ROW]
[ROW][C]26[/C][C]9764.736842[/C][C]10556.5924529078[/C][C]-791.855610907849[/C][/ROW]
[ROW][C]27[/C][C]12043.75[/C][C]12216.8933583909[/C][C]-173.143358390942[/C][/ROW]
[ROW][C]28[/C][C]12948.06667[/C][C]12196.7343054748[/C][C]751.332364525167[/C][/ROW]
[ROW][C]29[/C][C]10987.125[/C][C]11164.4382179595[/C][C]-177.313217959505[/C][/ROW]
[ROW][C]30[/C][C]11648.3125[/C][C]11158.8864020904[/C][C]489.426097909624[/C][/ROW]
[ROW][C]31[/C][C]10633.35294[/C][C]10674.1166022855[/C][C]-40.763662285505[/C][/ROW]
[ROW][C]32[/C][C]10219.3[/C][C]9947.41524399624[/C][C]271.884756003761[/C][/ROW]
[ROW][C]33[/C][C]9037.6[/C][C]9620.3043964054[/C][C]-582.704396405403[/C][/ROW]
[ROW][C]34[/C][C]10296.31579[/C][C]10279.2413958341[/C][C]17.0743941658583[/C][/ROW]
[ROW][C]35[/C][C]11705.41176[/C][C]11229.6439781233[/C][C]475.767781876726[/C][/ROW]
[ROW][C]36[/C][C]10681.94444[/C][C]10809.5020819589[/C][C]-127.557641958910[/C][/ROW]
[ROW][C]37[/C][C]9362.947368[/C][C]8489.58941018105[/C][C]873.357957818947[/C][/ROW]
[ROW][C]38[/C][C]11306.35294[/C][C]11880.9555816368[/C][C]-574.602641636753[/C][/ROW]
[ROW][C]39[/C][C]10984.45[/C][C]10710.5732720158[/C][C]273.876727984227[/C][/ROW]
[ROW][C]40[/C][C]10062.61905[/C][C]10186.0802839407[/C][C]-123.461233940748[/C][/ROW]
[ROW][C]41[/C][C]8118.583333[/C][C]8681.8115464835[/C][C]-563.2282134835[/C][/ROW]
[ROW][C]42[/C][C]8867.48[/C][C]8164.59824136598[/C][C]702.881758634016[/C][/ROW]
[ROW][C]43[/C][C]8346.72[/C][C]6948.61734149725[/C][C]1398.10265850275[/C][/ROW]
[ROW][C]44[/C][C]8529.307692[/C][C]8535.32384399626[/C][C]-6.0161519962549[/C][/ROW]
[ROW][C]45[/C][C]10697.18182[/C][C]9668.27929464008[/C][C]1028.90252535992[/C][/ROW]
[ROW][C]46[/C][C]8591.84[/C][C]7679.65352331848[/C][C]912.18647668152[/C][/ROW]
[ROW][C]47[/C][C]8695.607143[/C][C]7018.31169594111[/C][C]1677.29544705889[/C][/ROW]
[ROW][C]48[/C][C]8125.571429[/C][C]6565.53808164451[/C][C]1560.03334735549[/C][/ROW]
[ROW][C]49[/C][C]7009.758621[/C][C]5659.80930331232[/C][C]1349.94931768769[/C][/ROW]
[ROW][C]50[/C][C]7883.466667[/C][C]6748.65111367085[/C][C]1134.81555332915[/C][/ROW]
[ROW][C]51[/C][C]7527.645161[/C][C]6302.76681699117[/C][C]1224.87834400883[/C][/ROW]
[ROW][C]52[/C][C]6763.758621[/C][C]7712.28339759907[/C][C]-948.524776599065[/C][/ROW]
[ROW][C]53[/C][C]6682.333333[/C][C]7426.41865205911[/C][C]-744.085319059113[/C][/ROW]
[ROW][C]54[/C][C]7855.681818[/C][C]10050.0317609451[/C][C]-2194.34994294505[/C][/ROW]
[ROW][C]55[/C][C]6738.88[/C][C]7700.1875575543[/C][C]-961.3075575543[/C][/ROW]
[ROW][C]56[/C][C]7895.434783[/C][C]9767.04998511025[/C][C]-1871.61520211025[/C][/ROW]
[ROW][C]57[/C][C]6361.884615[/C][C]7065.69843893544[/C][C]-703.81382393544[/C][/ROW]
[ROW][C]58[/C][C]6935.956522[/C][C]8254.00668766003[/C][C]-1318.05016566003[/C][/ROW]
[ROW][C]59[/C][C]8344.454545[/C][C]9745.52220287841[/C][C]-1401.06765787841[/C][/ROW]
[ROW][C]60[/C][C]9107.944444[/C][C]10192.412681735[/C][C]-1084.46823773500[/C][/ROW]
[/TABLE]
Source: https://freestatistics.org/blog/index.php?pk=58219&T=4

Globally Unique Identifier (entire table): ba.freestatistics.org/blog/index.php?pk=58219&T=4

As an alternative you can also use a QR Code:  

The GUIDs for individual cells are displayed in the table below:

Multiple Linear Regression - Actuals, Interpolation, and Residuals
Time or IndexActualsInterpolationForecastResidualsPrediction Error
110284.511663.7803969823-1379.28039698228
21279213143.7157931106-351.715793110617
312823.6153813042.5041924629-218.888812462891
413845.6666713310.9947879301534.671882069892
515335.6363613575.30580194111760.33055805893
611188.512048.7278586968-860.227858696835
713633.2513418.0198494337215.230150566253
812298.4666712575.6916076448-277.22493764477
915353.6363613596.75169343251756.88466656747
1012696.1538512716.2915714523-20.1377214523066
1112213.9333312830.5102058616-616.576875861633
1213683.7272713247.5676591278436.159610872151
1311214.1428611634.7216408813-420.578780881293
1413950.2307713366.8722776739583.358492326066
1511179.1333312285.8562311392-1106.72290113922
1611801.87512015.8932360552-214.018236055246
1711188.8235311464.5273375568-275.703807556811
1816456.2727314594.00278490181862.26994509825
1911110.062511721.3240892292-611.261589229198
2016530.6923114647.72077425251882.97153574752
2110038.4117611537.6807315866-1499.26897158655
2211681.2511272.3229837350408.927016264954
2311148.8823511284.3010451956-135.418695195568
2486319415.16707853373-784.16707853373
259386.4444449809.89254164306-423.448097643058
269764.73684210556.5924529078-791.855610907849
2712043.7512216.8933583909-173.143358390942
2812948.0666712196.7343054748751.332364525167
2910987.12511164.4382179595-177.313217959505
3011648.312511158.8864020904489.426097909624
3110633.3529410674.1166022855-40.763662285505
3210219.39947.41524399624271.884756003761
339037.69620.3043964054-582.704396405403
3410296.3157910279.241395834117.0743941658583
3511705.4117611229.6439781233475.767781876726
3610681.9444410809.5020819589-127.557641958910
379362.9473688489.58941018105873.357957818947
3811306.3529411880.9555816368-574.602641636753
3910984.4510710.5732720158273.876727984227
4010062.6190510186.0802839407-123.461233940748
418118.5833338681.8115464835-563.2282134835
428867.488164.59824136598702.881758634016
438346.726948.617341497251398.10265850275
448529.3076928535.32384399626-6.0161519962549
4510697.181829668.279294640081028.90252535992
468591.847679.65352331848912.18647668152
478695.6071437018.311695941111677.29544705889
488125.5714296565.538081644511560.03334735549
497009.7586215659.809303312321349.94931768769
507883.4666676748.651113670851134.81555332915
517527.6451616302.766816991171224.87834400883
526763.7586217712.28339759907-948.524776599065
536682.3333337426.41865205911-744.085319059113
547855.68181810050.0317609451-2194.34994294505
556738.887700.1875575543-961.3075575543
567895.4347839767.04998511025-1871.61520211025
576361.8846157065.69843893544-703.81382393544
586935.9565228254.00668766003-1318.05016566003
598344.4545459745.52220287841-1401.06765787841
609107.94444410192.412681735-1084.46823773500


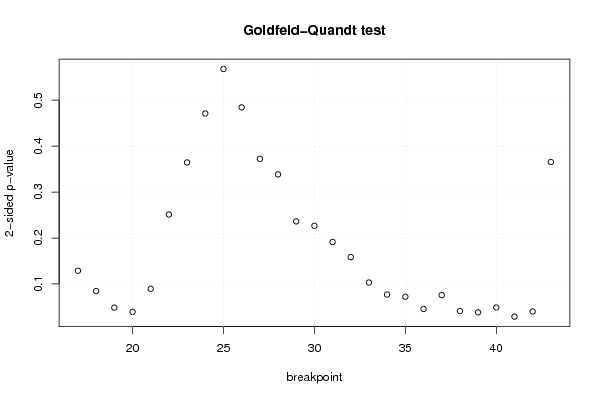
Goldfeld-Quandt test for Heteroskedasticity
p-valuesAlternative Hypothesis
breakpoint indexgreater2-sidedless
170.0643966759423020.1287933518846040.935603324057698
180.04227392273082810.08454784546165630.957726077269172
190.02425776319199420.04851552638398830.975742236808006
200.01964686996492090.03929373992984170.98035313003508
210.04473810409108480.08947620818216970.955261895908915
220.1255756342361090.2511512684722180.874424365763891
230.182257522285220.364515044570440.81774247771478
240.2355171528418670.4710343056837330.764482847158133
250.284042299896650.56808459979330.71595770010335
260.2422547401231070.4845094802462140.757745259876893
270.1862637860764810.3725275721529610.81373621392352
280.1693257624591020.3386515249182030.830674237540898
290.1181220416167230.2362440832334470.881877958383277
300.1133139885369470.2266279770738940.886686011463053
310.09571177628304440.1914235525660890.904288223716956
320.0791928505703480.1583857011406960.920807149429652
330.05156334990464750.1031266998092950.948436650095352
340.03845913259193300.07691826518386610.961540867408067
350.03609931098992700.07219862197985410.963900689010073
360.02270864041708300.04541728083416610.977291359582917
370.03788234456066270.07576468912132540.962117655439337
380.02045381773448790.04090763546897570.979546182265512
390.01913792810630760.03827585621261520.980862071893692
400.02437443023518980.04874886047037960.97562556976481
410.01441744214382120.02883488428764230.985582557856179
420.02005142669942480.04010285339884950.979948573300575
430.1827474421199520.3654948842399040.817252557880048

\begin{tabular}{lllllllll}
\hline
Goldfeld-Quandt test for Heteroskedasticity \tabularnewline
p-values & Alternative Hypothesis \tabularnewline
breakpoint index & greater & 2-sided & less \tabularnewline
17 & 0.064396675942302 & 0.128793351884604 & 0.935603324057698 \tabularnewline
18 & 0.0422739227308281 & 0.0845478454616563 & 0.957726077269172 \tabularnewline
19 & 0.0242577631919942 & 0.0485155263839883 & 0.975742236808006 \tabularnewline
20 & 0.0196468699649209 & 0.0392937399298417 & 0.98035313003508 \tabularnewline
21 & 0.0447381040910848 & 0.0894762081821697 & 0.955261895908915 \tabularnewline
22 & 0.125575634236109 & 0.251151268472218 & 0.874424365763891 \tabularnewline
23 & 0.18225752228522 & 0.36451504457044 & 0.81774247771478 \tabularnewline
24 & 0.235517152841867 & 0.471034305683733 & 0.764482847158133 \tabularnewline
25 & 0.28404229989665 & 0.5680845997933 & 0.71595770010335 \tabularnewline
26 & 0.242254740123107 & 0.484509480246214 & 0.757745259876893 \tabularnewline
27 & 0.186263786076481 & 0.372527572152961 & 0.81373621392352 \tabularnewline
28 & 0.169325762459102 & 0.338651524918203 & 0.830674237540898 \tabularnewline
29 & 0.118122041616723 & 0.236244083233447 & 0.881877958383277 \tabularnewline
30 & 0.113313988536947 & 0.226627977073894 & 0.886686011463053 \tabularnewline
31 & 0.0957117762830444 & 0.191423552566089 & 0.904288223716956 \tabularnewline
32 & 0.079192850570348 & 0.158385701140696 & 0.920807149429652 \tabularnewline
33 & 0.0515633499046475 & 0.103126699809295 & 0.948436650095352 \tabularnewline
34 & 0.0384591325919330 & 0.0769182651838661 & 0.961540867408067 \tabularnewline
35 & 0.0360993109899270 & 0.0721986219798541 & 0.963900689010073 \tabularnewline
36 & 0.0227086404170830 & 0.0454172808341661 & 0.977291359582917 \tabularnewline
37 & 0.0378823445606627 & 0.0757646891213254 & 0.962117655439337 \tabularnewline
38 & 0.0204538177344879 & 0.0409076354689757 & 0.979546182265512 \tabularnewline
39 & 0.0191379281063076 & 0.0382758562126152 & 0.980862071893692 \tabularnewline
40 & 0.0243744302351898 & 0.0487488604703796 & 0.97562556976481 \tabularnewline
41 & 0.0144174421438212 & 0.0288348842876423 & 0.985582557856179 \tabularnewline
42 & 0.0200514266994248 & 0.0401028533988495 & 0.979948573300575 \tabularnewline
43 & 0.182747442119952 & 0.365494884239904 & 0.817252557880048 \tabularnewline
\hline
\end{tabular}
%Source: https://freestatistics.org/blog/index.php?pk=58219&T=5

[TABLE]
[ROW][C]Goldfeld-Quandt test for Heteroskedasticity[/C][/ROW]
[ROW][C]p-values[/C][C]Alternative Hypothesis[/C][/ROW]
[ROW][C]breakpoint index[/C][C]greater[/C][C]2-sided[/C][C]less[/C][/ROW]
[ROW][C]17[/C][C]0.064396675942302[/C][C]0.128793351884604[/C][C]0.935603324057698[/C][/ROW]
[ROW][C]18[/C][C]0.0422739227308281[/C][C]0.0845478454616563[/C][C]0.957726077269172[/C][/ROW]
[ROW][C]19[/C][C]0.0242577631919942[/C][C]0.0485155263839883[/C][C]0.975742236808006[/C][/ROW]
[ROW][C]20[/C][C]0.0196468699649209[/C][C]0.0392937399298417[/C][C]0.98035313003508[/C][/ROW]
[ROW][C]21[/C][C]0.0447381040910848[/C][C]0.0894762081821697[/C][C]0.955261895908915[/C][/ROW]
[ROW][C]22[/C][C]0.125575634236109[/C][C]0.251151268472218[/C][C]0.874424365763891[/C][/ROW]
[ROW][C]23[/C][C]0.18225752228522[/C][C]0.36451504457044[/C][C]0.81774247771478[/C][/ROW]
[ROW][C]24[/C][C]0.235517152841867[/C][C]0.471034305683733[/C][C]0.764482847158133[/C][/ROW]
[ROW][C]25[/C][C]0.28404229989665[/C][C]0.5680845997933[/C][C]0.71595770010335[/C][/ROW]
[ROW][C]26[/C][C]0.242254740123107[/C][C]0.484509480246214[/C][C]0.757745259876893[/C][/ROW]
[ROW][C]27[/C][C]0.186263786076481[/C][C]0.372527572152961[/C][C]0.81373621392352[/C][/ROW]
[ROW][C]28[/C][C]0.169325762459102[/C][C]0.338651524918203[/C][C]0.830674237540898[/C][/ROW]
[ROW][C]29[/C][C]0.118122041616723[/C][C]0.236244083233447[/C][C]0.881877958383277[/C][/ROW]
[ROW][C]30[/C][C]0.113313988536947[/C][C]0.226627977073894[/C][C]0.886686011463053[/C][/ROW]
[ROW][C]31[/C][C]0.0957117762830444[/C][C]0.191423552566089[/C][C]0.904288223716956[/C][/ROW]
[ROW][C]32[/C][C]0.079192850570348[/C][C]0.158385701140696[/C][C]0.920807149429652[/C][/ROW]
[ROW][C]33[/C][C]0.0515633499046475[/C][C]0.103126699809295[/C][C]0.948436650095352[/C][/ROW]
[ROW][C]34[/C][C]0.0384591325919330[/C][C]0.0769182651838661[/C][C]0.961540867408067[/C][/ROW]
[ROW][C]35[/C][C]0.0360993109899270[/C][C]0.0721986219798541[/C][C]0.963900689010073[/C][/ROW]
[ROW][C]36[/C][C]0.0227086404170830[/C][C]0.0454172808341661[/C][C]0.977291359582917[/C][/ROW]
[ROW][C]37[/C][C]0.0378823445606627[/C][C]0.0757646891213254[/C][C]0.962117655439337[/C][/ROW]
[ROW][C]38[/C][C]0.0204538177344879[/C][C]0.0409076354689757[/C][C]0.979546182265512[/C][/ROW]
[ROW][C]39[/C][C]0.0191379281063076[/C][C]0.0382758562126152[/C][C]0.980862071893692[/C][/ROW]
[ROW][C]40[/C][C]0.0243744302351898[/C][C]0.0487488604703796[/C][C]0.97562556976481[/C][/ROW]
[ROW][C]41[/C][C]0.0144174421438212[/C][C]0.0288348842876423[/C][C]0.985582557856179[/C][/ROW]
[ROW][C]42[/C][C]0.0200514266994248[/C][C]0.0401028533988495[/C][C]0.979948573300575[/C][/ROW]
[ROW][C]43[/C][C]0.182747442119952[/C][C]0.365494884239904[/C][C]0.817252557880048[/C][/ROW]
[/TABLE]
Source: https://freestatistics.org/blog/index.php?pk=58219&T=5

Globally Unique Identifier (entire table): ba.freestatistics.org/blog/index.php?pk=58219&T=5

As an alternative you can also use a QR Code:  

The GUIDs for individual cells are displayed in the table below:

Goldfeld-Quandt test for Heteroskedasticity
p-valuesAlternative Hypothesis
breakpoint indexgreater2-sidedless
170.0643966759423020.1287933518846040.935603324057698
180.04227392273082810.08454784546165630.957726077269172
190.02425776319199420.04851552638398830.975742236808006
200.01964686996492090.03929373992984170.98035313003508
210.04473810409108480.08947620818216970.955261895908915
220.1255756342361090.2511512684722180.874424365763891
230.182257522285220.364515044570440.81774247771478
240.2355171528418670.4710343056837330.764482847158133
250.284042299896650.56808459979330.71595770010335
260.2422547401231070.4845094802462140.757745259876893
270.1862637860764810.3725275721529610.81373621392352
280.1693257624591020.3386515249182030.830674237540898
290.1181220416167230.2362440832334470.881877958383277
300.1133139885369470.2266279770738940.886686011463053
310.09571177628304440.1914235525660890.904288223716956
320.0791928505703480.1583857011406960.920807149429652
330.05156334990464750.1031266998092950.948436650095352
340.03845913259193300.07691826518386610.961540867408067
350.03609931098992700.07219862197985410.963900689010073
360.02270864041708300.04541728083416610.977291359582917
370.03788234456066270.07576468912132540.962117655439337
380.02045381773448790.04090763546897570.979546182265512
390.01913792810630760.03827585621261520.980862071893692
400.02437443023518980.04874886047037960.97562556976481
410.01441744214382120.02883488428764230.985582557856179
420.02005142669942480.04010285339884950.979948573300575
430.1827474421199520.3654948842399040.817252557880048


Meta Analysis of Goldfeld-Quandt test for Heteroskedasticity
Description# significant tests% significant testsOK/NOK
1% type I error level00OK
5% type I error level80.296296296296296NOK
10% type I error level130.481481481481481NOK

\begin{tabular}{lllllllll}
\hline
Meta Analysis of Goldfeld-Quandt test for Heteroskedasticity \tabularnewline
Description & # significant tests & % significant tests & OK/NOK \tabularnewline
1% type I error level & 0 & 0 & OK \tabularnewline
5% type I error level & 8 & 0.296296296296296 & NOK \tabularnewline
10% type I error level & 13 & 0.481481481481481 & NOK \tabularnewline
\hline
\end{tabular}
%Source: https://freestatistics.org/blog/index.php?pk=58219&T=6

[TABLE]
[ROW][C]Meta Analysis of Goldfeld-Quandt test for Heteroskedasticity[/C][/ROW]
[ROW][C]Description[/C][C]# significant tests[/C][C]% significant tests[/C][C]OK/NOK[/C][/ROW]
[ROW][C]1% type I error level[/C][C]0[/C][C]0[/C][C]OK[/C][/ROW]
[ROW][C]5% type I error level[/C][C]8[/C][C]0.296296296296296[/C][C]NOK[/C][/ROW]
[ROW][C]10% type I error level[/C][C]13[/C][C]0.481481481481481[/C][C]NOK[/C][/ROW]
[/TABLE]
Source: https://freestatistics.org/blog/index.php?pk=58219&T=6

Globally Unique Identifier (entire table): ba.freestatistics.org/blog/index.php?pk=58219&T=6

As an alternative you can also use a QR Code:  

The GUIDs for individual cells are displayed in the table below:

Meta Analysis of Goldfeld-Quandt test for Heteroskedasticity
Description# significant tests% significant testsOK/NOK
1% type I error level00OK
5% type I error level80.296296296296296NOK
10% type I error level130.481481481481481NOK


Parameters (Session):
par1 = 1 ; par2 = Include Monthly Dummies ; par3 = No Linear Trend ;
Parameters (R input):
par1 = 1 ; par2 = Include Monthly Dummies ; par3 = No Linear Trend ;
R code (references can be found in the software module):
library(lattice)
library(lmtest)
n25 <- 25 #minimum number of obs. for Goldfeld-Quandt test
par1 <- as.numeric(par1)
x <- t(y)
k <- length(x[1,])
n <- length(x[,1])
x1 <- cbind(x[,par1], x[,1:k!=par1])
mycolnames <- c(colnames(x)[par1], colnames(x)[1:k!=par1])
colnames(x1) <- mycolnames #colnames(x)[par1]
x <- x1
if (par3 == 'First Differences'){
x2 <- array(0, dim=c(n-1,k), dimnames=list(1:(n-1), paste('(1-B)',colnames(x),sep='')))
for (i in 1:n-1) {
for (j in 1:k) {
x2[i,j] <- x[i+1,j] - x[i,j]
}
}
x <- x2
}
if (par2 == 'Include Monthly Dummies'){
x2 <- array(0, dim=c(n,11), dimnames=list(1:n, paste('M', seq(1:11), sep ='')))
for (i in 1:11){
x2[seq(i,n,12),i] <- 1
}
x <- cbind(x, x2)
}
if (par2 == 'Include Quarterly Dummies'){
x2 <- array(0, dim=c(n,3), dimnames=list(1:n, paste('Q', seq(1:3), sep ='')))
for (i in 1:3){
x2[seq(i,n,4),i] <- 1
}
x <- cbind(x, x2)
}
k <- length(x[1,])
if (par3 == 'Linear Trend'){
x <- cbind(x, c(1:n))
colnames(x)[k+1] <- 't'
}
x
k <- length(x[1,])
df <- as.data.frame(x)
(mylm <- lm(df))
(mysum <- summary(mylm))
if (n > n25) {
kp3 <- k + 3
nmkm3 <- n - k - 3
gqarr <- array(NA, dim=c(nmkm3-kp3+1,3))
numgqtests <- 0
numsignificant1 <- 0
numsignificant5 <- 0
numsignificant10 <- 0
for (mypoint in kp3:nmkm3) {
j <- 0
numgqtests <- numgqtests + 1
for (myalt in c('greater', 'two.sided', 'less')) {
j <- j + 1
gqarr[mypoint-kp3+1,j] <- gqtest(mylm, point=mypoint, alternative=myalt)$p.value
}
if (gqarr[mypoint-kp3+1,2] < 0.01) numsignificant1 <- numsignificant1 + 1
if (gqarr[mypoint-kp3+1,2] < 0.05) numsignificant5 <- numsignificant5 + 1
if (gqarr[mypoint-kp3+1,2] < 0.10) numsignificant10 <- numsignificant10 + 1
}
gqarr
}
bitmap(file='test0.png')
plot(x[,1], type='l', main='Actuals and Interpolation', ylab='value of Actuals and Interpolation (dots)', xlab='time or index')
points(x[,1]-mysum$resid)
grid()
dev.off()
bitmap(file='test1.png')
plot(mysum$resid, type='b', pch=19, main='Residuals', ylab='value of Residuals', xlab='time or index')
grid()
dev.off()
bitmap(file='test2.png')
hist(mysum$resid, main='Residual Histogram', xlab='values of Residuals')
grid()
dev.off()
bitmap(file='test3.png')
densityplot(~mysum$resid,col='black',main='Residual Density Plot', xlab='values of Residuals')
dev.off()
bitmap(file='test4.png')
qqnorm(mysum$resid, main='Residual Normal Q-Q Plot')
qqline(mysum$resid)
grid()
dev.off()
(myerror <- as.ts(mysum$resid))
bitmap(file='test5.png')
dum <- cbind(lag(myerror,k=1),myerror)
dum
dum1 <- dum[2:length(myerror),]
dum1
z <- as.data.frame(dum1)
z
plot(z,main=paste('Residual Lag plot, lowess, and regression line'), ylab='values of Residuals', xlab='lagged values of Residuals')
lines(lowess(z))
abline(lm(z))
grid()
dev.off()
bitmap(file='test6.png')
acf(mysum$resid, lag.max=length(mysum$resid)/2, main='Residual Autocorrelation Function')
grid()
dev.off()
bitmap(file='test7.png')
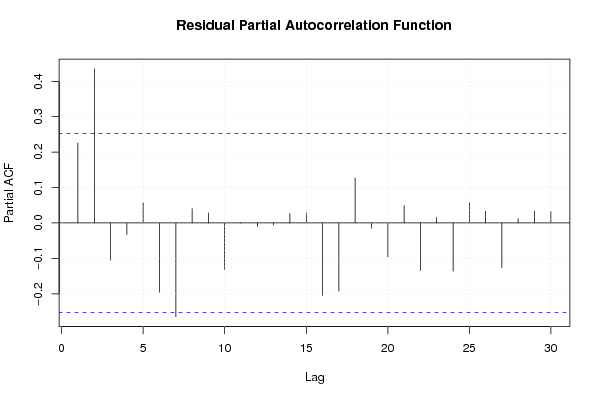
pacf(mysum$resid, lag.max=length(mysum$resid)/2, main='Residual Partial Autocorrelation Function')
grid()
dev.off()
bitmap(file='test8.png')
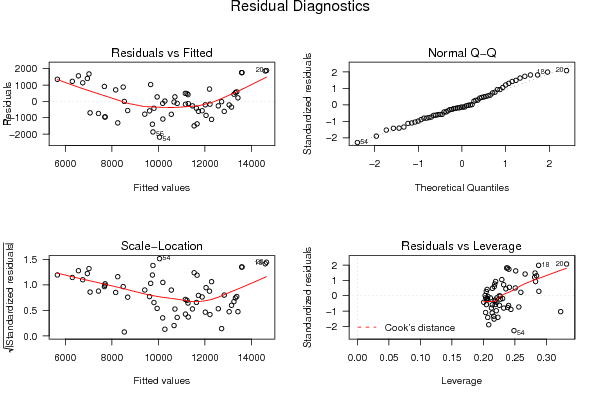
opar <- par(mfrow = c(2,2), oma = c(0, 0, 1.1, 0))
plot(mylm, las = 1, sub='Residual Diagnostics')
par(opar)
dev.off()
if (n > n25) {
bitmap(file='test9.png')
plot(kp3:nmkm3,gqarr[,2], main='Goldfeld-Quandt test',ylab='2-sided p-value',xlab='breakpoint')
grid()
dev.off()
}
load(file='createtable')
a<-table.start()
a<-table.row.start(a)
a<-table.element(a, 'Multiple Linear Regression - Estimated Regression Equation', 1, TRUE)
a<-table.row.end(a)
myeq <- colnames(x)[1]
myeq <- paste(myeq, '[t] = ', sep='')
for (i in 1:k){
if (mysum$coefficients[i,1] > 0) myeq <- paste(myeq, '+', '')
myeq <- paste(myeq, mysum$coefficients[i,1], sep=' ')
if (rownames(mysum$coefficients)[i] != '(Intercept)') {
myeq <- paste(myeq, rownames(mysum$coefficients)[i], sep='')
if (rownames(mysum$coefficients)[i] != 't') myeq <- paste(myeq, '[t]', sep='')
}
}
myeq <- paste(myeq, ' + e[t]')
a<-table.row.start(a)
a<-table.element(a, myeq)
a<-table.row.end(a)
a<-table.end(a)
table.save(a,file='mytable1.tab')
a<-table.start()
a<-table.row.start(a)
a<-table.element(a,hyperlink('ols1.htm','Multiple Linear Regression - Ordinary Least Squares',''), 6, TRUE)
a<-table.row.end(a)
a<-table.row.start(a)
a<-table.element(a,'Variable',header=TRUE)
a<-table.element(a,'Parameter',header=TRUE)
a<-table.element(a,'S.D.',header=TRUE)
a<-table.element(a,'T-STAT
H0: parameter = 0',header=TRUE)
a<-table.element(a,'2-tail p-value',header=TRUE)
a<-table.element(a,'1-tail p-value',header=TRUE)
a<-table.row.end(a)
for (i in 1:k){
a<-table.row.start(a)
a<-table.element(a,rownames(mysum$coefficients)[i],header=TRUE)
a<-table.element(a,mysum$coefficients[i,1])
a<-table.element(a, round(mysum$coefficients[i,2],6))
a<-table.element(a, round(mysum$coefficients[i,3],4))
a<-table.element(a, round(mysum$coefficients[i,4],6))
a<-table.element(a, round(mysum$coefficients[i,4]/2,6))
a<-table.row.end(a)
}
a<-table.end(a)
table.save(a,file='mytable2.tab')
a<-table.start()
a<-table.row.start(a)
a<-table.element(a, 'Multiple Linear Regression - Regression Statistics', 2, TRUE)
a<-table.row.end(a)
a<-table.row.start(a)
a<-table.element(a, 'Multiple R',1,TRUE)
a<-table.element(a, sqrt(mysum$r.squared))
a<-table.row.end(a)
a<-table.row.start(a)
a<-table.element(a, 'R-squared',1,TRUE)
a<-table.element(a, mysum$r.squared)
a<-table.row.end(a)
a<-table.row.start(a)
a<-table.element(a, 'Adjusted R-squared',1,TRUE)
a<-table.element(a, mysum$adj.r.squared)
a<-table.row.end(a)
a<-table.row.start(a)
a<-table.element(a, 'F-TEST (value)',1,TRUE)
a<-table.element(a, mysum$fstatistic[1])
a<-table.row.end(a)
a<-table.row.start(a)
a<-table.element(a, 'F-TEST (DF numerator)',1,TRUE)
a<-table.element(a, mysum$fstatistic[2])
a<-table.row.end(a)
a<-table.row.start(a)
a<-table.element(a, 'F-TEST (DF denominator)',1,TRUE)
a<-table.element(a, mysum$fstatistic[3])
a<-table.row.end(a)
a<-table.row.start(a)
a<-table.element(a, 'p-value',1,TRUE)
a<-table.element(a, 1-pf(mysum$fstatistic[1],mysum$fstatistic[2],mysum$fstatistic[3]))
a<-table.row.end(a)
a<-table.row.start(a)
a<-table.element(a, 'Multiple Linear Regression - Residual Statistics', 2, TRUE)
a<-table.row.end(a)
a<-table.row.start(a)
a<-table.element(a, 'Residual Standard Deviation',1,TRUE)
a<-table.element(a, mysum$sigma)
a<-table.row.end(a)
a<-table.row.start(a)
a<-table.element(a, 'Sum Squared Residuals',1,TRUE)
a<-table.element(a, sum(myerror*myerror))
a<-table.row.end(a)
a<-table.end(a)
table.save(a,file='mytable3.tab')
a<-table.start()
a<-table.row.start(a)
a<-table.element(a, 'Multiple Linear Regression - Actuals, Interpolation, and Residuals', 4, TRUE)
a<-table.row.end(a)
a<-table.row.start(a)
a<-table.element(a, 'Time or Index', 1, TRUE)
a<-table.element(a, 'Actuals', 1, TRUE)
a<-table.element(a, 'Interpolation
Forecast', 1, TRUE)
a<-table.element(a, 'Residuals
Prediction Error', 1, TRUE)
a<-table.row.end(a)
for (i in 1:n) {
a<-table.row.start(a)
a<-table.element(a,i, 1, TRUE)
a<-table.element(a,x[i])
a<-table.element(a,x[i]-mysum$resid[i])
a<-table.element(a,mysum$resid[i])
a<-table.row.end(a)
}
a<-table.end(a)
table.save(a,file='mytable4.tab')
if (n > n25) {
a<-table.start()
a<-table.row.start(a)
a<-table.element(a,'Goldfeld-Quandt test for Heteroskedasticity',4,TRUE)
a<-table.row.end(a)
a<-table.row.start(a)
a<-table.element(a,'p-values',header=TRUE)
a<-table.element(a,'Alternative Hypothesis',3,header=TRUE)
a<-table.row.end(a)
a<-table.row.start(a)
a<-table.element(a,'breakpoint index',header=TRUE)
a<-table.element(a,'greater',header=TRUE)
a<-table.element(a,'2-sided',header=TRUE)
a<-table.element(a,'less',header=TRUE)
a<-table.row.end(a)
for (mypoint in kp3:nmkm3) {
a<-table.row.start(a)
a<-table.element(a,mypoint,header=TRUE)
a<-table.element(a,gqarr[mypoint-kp3+1,1])
a<-table.element(a,gqarr[mypoint-kp3+1,2])
a<-table.element(a,gqarr[mypoint-kp3+1,3])
a<-table.row.end(a)
}
a<-table.end(a)
table.save(a,file='mytable5.tab')
a<-table.start()
a<-table.row.start(a)
a<-table.element(a,'Meta Analysis of Goldfeld-Quandt test for Heteroskedasticity',4,TRUE)
a<-table.row.end(a)
a<-table.row.start(a)
a<-table.element(a,'Description',header=TRUE)
a<-table.element(a,'# significant tests',header=TRUE)
a<-table.element(a,'% significant tests',header=TRUE)
a<-table.element(a,'OK/NOK',header=TRUE)
a<-table.row.end(a)
a<-table.row.start(a)
a<-table.element(a,'1% type I error level',header=TRUE)
a<-table.element(a,numsignificant1)
a<-table.element(a,numsignificant1/numgqtests)
if (numsignificant1/numgqtests < 0.01) dum <- 'OK' else dum <- 'NOK'
a<-table.element(a,dum)
a<-table.row.end(a)
a<-table.row.start(a)
a<-table.element(a,'5% type I error level',header=TRUE)
a<-table.element(a,numsignificant5)
a<-table.element(a,numsignificant5/numgqtests)
if (numsignificant5/numgqtests < 0.05) dum <- 'OK' else dum <- 'NOK'
a<-table.element(a,dum)
a<-table.row.end(a)
a<-table.row.start(a)
a<-table.element(a,'10% type I error level',header=TRUE)
a<-table.element(a,numsignificant10)
a<-table.element(a,numsignificant10/numgqtests)
if (numsignificant10/numgqtests < 0.1) dum <- 'OK' else dum <- 'NOK'
a<-table.element(a,dum)
a<-table.row.end(a)
a<-table.end(a)
table.save(a,file='mytable6.tab')
}