| Multiple Linear Regression - Estimated Regression Equation |
| Y[t] = -620.645522131992 + 1.12559599862179X[t] + 0.588250430193732`Y-1`[t] + 0.202239932456929`Y-2`[t] -0.119445465275896`Y-3`[t] -0.0445844438979129`Y-4`[t] -3.14891715732790M1[t] + 121.751080764899M2[t] + 45.263293361877M3[t] + 74.9696221902687M4[t] + 280.845825566085M5[t] + 64.0656486594804M6[t] -16.3205169905858M7[t] + 35.6389122153682M8[t] -1.96193224239403M9[t] + 75.2337682511196M10[t] + 193.584054612444M11[t] + 0.18436507248157t + e[t] |
| Multiple Linear Regression - Ordinary Least Squares | |||||
| Variable | Parameter | S.D. | T-STAT H0: parameter = 0 | 2-tail p-value | 1-tail p-value |
| (Intercept) | -620.645522131992 | 275.31328 | -2.2543 | 0.030022 | 0.015011 |
| X | 1.12559599862179 | 0.188956 | 5.9569 | 1e-06 | 0 |
| `Y-1` | 0.588250430193732 | 0.137351 | 4.2828 | 0.000121 | 6e-05 |
| `Y-2` | 0.202239932456929 | 0.16725 | 1.2092 | 0.234054 | 0.117027 |
| `Y-3` | -0.119445465275896 | 0.166839 | -0.7159 | 0.47841 | 0.239205 |
| `Y-4` | -0.0445844438979129 | 0.12344 | -0.3612 | 0.719963 | 0.359982 |
| M1 | -3.14891715732790 | 77.242578 | -0.0408 | 0.967695 | 0.483848 |
| M2 | 121.751080764899 | 89.33078 | 1.3629 | 0.180929 | 0.090464 |
| M3 | 45.263293361877 | 75.025065 | 0.6033 | 0.549888 | 0.274944 |
| M4 | 74.9696221902687 | 78.713692 | 0.9524 | 0.346896 | 0.173448 |
| M5 | 280.845825566085 | 78.656329 | 3.5705 | 0.000986 | 0.000493 |
| M6 | 64.0656486594804 | 62.499966 | 1.0251 | 0.31182 | 0.15591 |
| M7 | -16.3205169905858 | 73.532638 | -0.2219 | 0.825542 | 0.412771 |
| M8 | 35.6389122153682 | 94.442939 | 0.3774 | 0.708006 | 0.354003 |
| M9 | -1.96193224239403 | 76.091243 | -0.0258 | 0.979565 | 0.489782 |
| M10 | 75.2337682511196 | 78.190287 | 0.9622 | 0.342038 | 0.171019 |
| M11 | 193.584054612444 | 69.290445 | 2.7938 | 0.008116 | 0.004058 |
| t | 0.18436507248157 | 0.998013 | 0.1847 | 0.854421 | 0.427211 |
| Multiple Linear Regression - Regression Statistics | |
| Multiple R | 0.99121820663942 |
| R-squared | 0.98251353317347 |
| Adjusted R-squared | 0.974690640119495 |
| F-TEST (value) | 125.594652310160 |
| F-TEST (DF numerator) | 17 |
| F-TEST (DF denominator) | 38 |
| p-value | 0 |
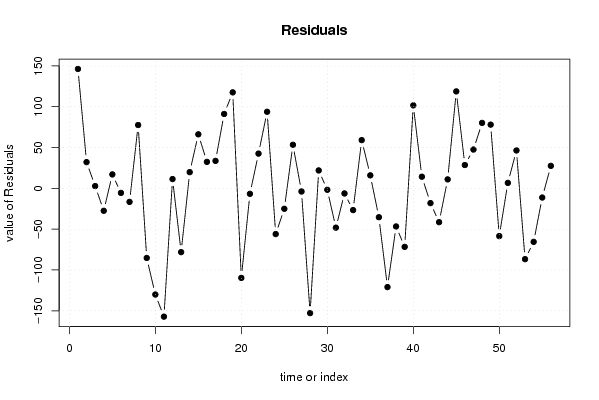
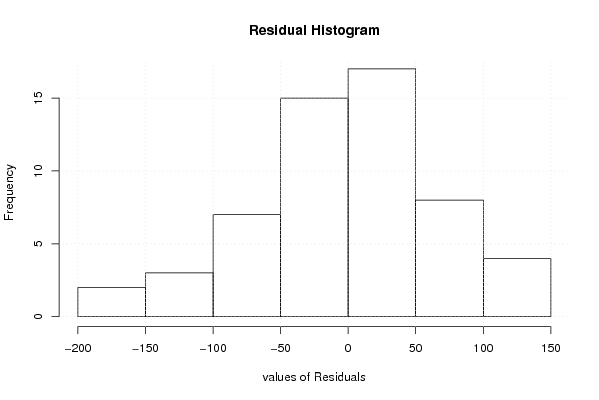
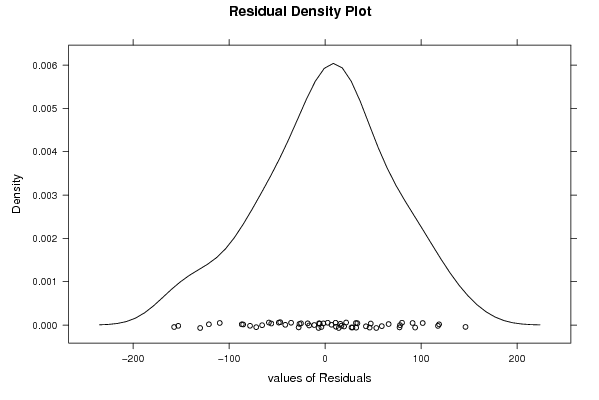
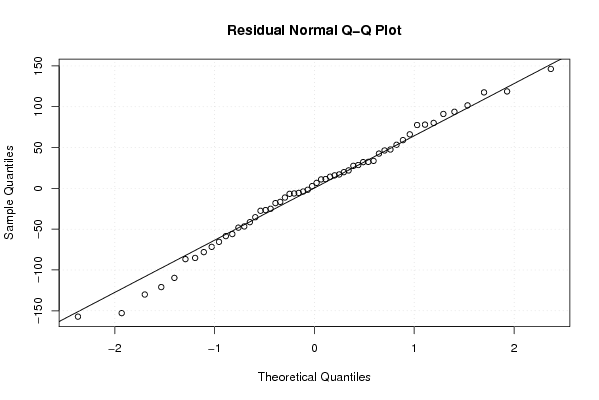
| Multiple Linear Regression - Residual Statistics | |
| Residual Standard Deviation | 82.3882273668344 |
| Sum Squared Residuals | 257937.16032867 |
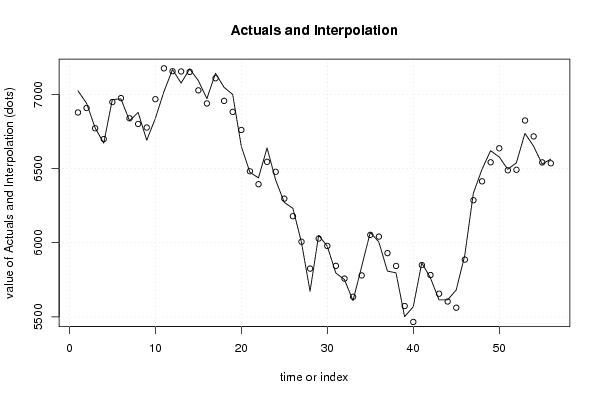
| Multiple Linear Regression - Actuals, Interpolation, and Residuals | |||
| Time or Index | Actuals | Interpolation Forecast | Residuals Prediction Error |
| 1 | 7024 | 6877.76279442965 | 146.237205570348 |
| 2 | 6940 | 6907.8915203529 | 32.1084796471026 |
| 3 | 6774 | 6771.24822640323 | 2.75177359677171 |
| 4 | 6671 | 6698.52747110258 | -27.5274711025852 |
| 5 | 6965 | 6947.98624429015 | 17.0137557098505 |
| 6 | 6969 | 6974.61414633045 | -5.61414633045086 |
| 7 | 6822 | 6838.60507639459 | -16.6050763945905 |
| 8 | 6878 | 6800.44895606305 | 77.5510439369518 |
| 9 | 6691 | 6776.29713830142 | -85.2971383014155 |
| 10 | 6837 | 6967.1080630203 | -130.108063020306 |
| 11 | 7018 | 7175.2204290395 | -157.2204290395 |
| 12 | 7167 | 7155.67020662957 | 11.3297933704273 |
| 13 | 7076 | 7154.17345363612 | -78.1734536361246 |
| 14 | 7171 | 7151.19129148897 | 19.8087085110280 |
| 15 | 7093 | 7026.84407957467 | 66.1559204253303 |
| 16 | 6971 | 6938.6148288203 | 32.3851711796947 |
| 17 | 7142 | 7108.37498717516 | 33.6250128248395 |
| 18 | 7047 | 6955.89401128631 | 91.1059887136883 |
| 19 | 6999 | 6881.44614966713 | 117.553850332872 |
| 20 | 6650 | 6759.72125344267 | -109.721253442666 |
| 21 | 6475 | 6481.75574049234 | -6.75574049234104 |
| 22 | 6437 | 6394.45355285189 | 42.5464471481121 |
| 23 | 6639 | 6545.21865639025 | 93.7813436097497 |
| 24 | 6422 | 6478.0370396859 | -56.037039685898 |
| 25 | 6272 | 6297.06098409473 | -25.0609840947254 |
| 26 | 6232 | 6178.66585820849 | 53.3341417915107 |
| 27 | 6003 | 6006.87904517082 | -3.87904517081784 |
| 28 | 5673 | 5825.88677749343 | -152.886777493429 |
| 29 | 6050 | 6028.09644436524 | 21.9035556347609 |
| 30 | 5977 | 5978.78431632814 | -1.78431632813645 |
| 31 | 5796 | 5844.18881824448 | -48.1888182444806 |
| 32 | 5752 | 5758.28484764926 | -6.28484764925505 |
| 33 | 5609 | 5635.65835719429 | -26.6583571942899 |
| 34 | 5839 | 5779.96586766858 | 59.0341323314237 |
| 35 | 6069 | 6053.09666848054 | 15.9033315194631 |
| 36 | 6006 | 6041.41704743962 | -35.4170474396174 |
| 37 | 5809 | 5930.00976530013 | -121.009765300131 |
| 38 | 5797 | 5843.71695874704 | -46.7169587470405 |
| 39 | 5502 | 5573.70761895243 | -71.7076189524322 |
| 40 | 5568 | 5466.35868936643 | 101.641310633569 |
| 41 | 5864 | 5849.77401893376 | 14.2259810662402 |
| 42 | 5764 | 5782.13025965327 | -18.1302596532649 |
| 43 | 5615 | 5656.45803036863 | -41.4580303686308 |
| 44 | 5615 | 5604.07713823259 | 10.9228617674137 |
| 45 | 5681 | 5562.28876401195 | 118.711235988046 |
| 46 | 5915 | 5886.47251645923 | 28.5274835407697 |
| 47 | 6334 | 6286.46424608971 | 47.5357539102873 |
| 48 | 6494 | 6413.87570624491 | 80.1242937550881 |
| 49 | 6620 | 6541.99300253937 | 78.0069974606331 |
| 50 | 6578 | 6636.5343712026 | -58.5343712026009 |
| 51 | 6495 | 6488.32102989885 | 6.678970101148 |
| 52 | 6538 | 6491.61223321725 | 46.3877667827503 |
| 53 | 6737 | 6823.76830523569 | -86.7683052356914 |
| 54 | 6651 | 6716.57726640184 | -65.5772664018361 |
| 55 | 6530 | 6541.30192532517 | -11.3019253251700 |
| 56 | 6563 | 6535.46780461244 | 27.5321953875558 |
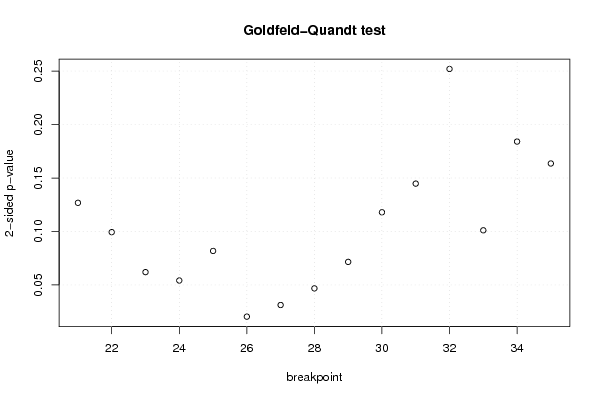
| Goldfeld-Quandt test for Heteroskedasticity | |||
| p-values | Alternative Hypothesis | ||
| breakpoint index | greater | 2-sided | less |
| 21 | 0.936606761384888 | 0.126786477230224 | 0.063393238615112 |
| 22 | 0.950322061126077 | 0.0993558777478457 | 0.0496779388739229 |
| 23 | 0.96902215359003 | 0.0619556928199387 | 0.0309778464099693 |
| 24 | 0.972947918289392 | 0.0541041634212155 | 0.0270520817106078 |
| 25 | 0.959119147625496 | 0.0817617047490081 | 0.0408808523745041 |
| 26 | 0.989853432222732 | 0.0202931355545368 | 0.0101465677772684 |
| 27 | 0.984411031073958 | 0.0311779378520843 | 0.0155889689260422 |
| 28 | 0.976625259154368 | 0.0467494816912650 | 0.0233747408456325 |
| 29 | 0.964235441310298 | 0.0715291173794042 | 0.0357645586897021 |
| 30 | 0.941026925605586 | 0.117946148788827 | 0.0589730743944137 |
| 31 | 0.92762244691465 | 0.144755106170699 | 0.0723775530853494 |
| 32 | 0.873984181385375 | 0.25203163722925 | 0.126015818614625 |
| 33 | 0.949458131786104 | 0.101083736427792 | 0.050541868213896 |
| 34 | 0.907950496457666 | 0.184099007084667 | 0.0920495035423337 |
| 35 | 0.9182035947995 | 0.163592810401002 | 0.0817964052005011 |
| Meta Analysis of Goldfeld-Quandt test for Heteroskedasticity | |||
| Description | # significant tests | % significant tests | OK/NOK |
| 1% type I error level | 0 | 0 | OK |
| 5% type I error level | 3 | 0.2 | NOK |
| 10% type I error level | 8 | 0.533333333333333 | NOK |