Free Statistics

of Irreproducible Research!

Author's title

Author*The author of this computation has been verified*
R Software Modulerwasp_multipleregression.wasp
Title produced by softwareMultiple Regression
Date of computationFri, 20 Nov 2009 07:22:29 -0700
Cite this page as followsStatistical Computations at FreeStatistics.org, Office for Research Development and Education, URL https://freestatistics.org/blog/index.php?v=date/2009/Nov/20/t1258727015i5afb97vf8x4t59.htm/, Retrieved Thu, 18 Apr 2024 06:33:50 +0000
Statistical Computations at FreeStatistics.org, Office for Research Development and Education, URL https://freestatistics.org/blog/index.php?pk=58201, Retrieved Thu, 18 Apr 2024 06:33:50 +0000
QR Codes:

Original text written by user:
IsPrivate?No (this computation is public)
User-defined keywordsshwws7
Estimated Impact120
Family? (F = Feedback message, R = changed R code, M = changed R Module, P = changed Parameters, D = changed Data)
-     [Multiple Regression] [Q1 The Seatbeltlaw] [2007-11-14 19:27:43] [8cd6641b921d30ebe00b648d1481bba0]
- RMPD  [Multiple Regression] [Seatbelt] [2009-11-12 13:54:52] [b98453cac15ba1066b407e146608df68]
-   PD    [Multiple Regression] [] [2009-11-20 14:01:59] [5482608004c1d7bbf873930172393a2d]
-    D        [Multiple Regression] [] [2009-11-20 14:22:29] [efdfe680cd785c4af09f858b30f777ec] [Current]
Feedback Forum

Post a new message
Dataseries X:
7024	2735	6981	6962	6699	6539
6940	2659	7024	6981	6962	6699
6774	2654	6940	7024	6981	6962
6671	2670	6774	6940	7024	6981
6965	2785	6671	6774	6940	7024
6969	2845	6965	6671	6774	6940
6822	2723	6969	6965	6671	6774
6878	2746	6822	6969	6965	6671
6691	2767	6878	6822	6969	6965
6837	2940	6691	6878	6822	6969
7018	2977	6837	6691	6878	6822
7167	2993	7018	6837	6691	6878
7076	2892	7167	7018	6837	6691
7171	2824	7076	7167	7018	6837
7093	2771	7171	7076	7167	7018
6971	2686	7093	7171	7076	7167
7142	2738	6971	7093	7171	7076
7047	2723	7142	6971	7093	7171
6999	2731	7047	7142	6971	7093
6650	2632	6999	7047	7142	6971
6475	2606	6650	6999	7047	7142
6437	2605	6475	6650	6999	7047
6639	2646	6437	6475	6650	6999
6422	2627	6639	6437	6475	6650
6272	2535	6422	6639	6437	6475
6232	2456	6272	6422	6639	6437
6003	2404	6232	6272	6422	6639
5673	2319	6003	6232	6272	6422
6050	2519	5673	6003	6232	6272
5977	2504	6050	5673	6003	6232
5796	2382	5977	6050	5673	6003
5752	2394	5796	5977	6050	5673
5609	2381	5752	5796	5977	6050
5839	2501	5609	5752	5796	5977
6069	2532	5839	5609	5752	5796
6006	2515	6069	5839	5609	5752
5809	2429	6006	6069	5839	5609
5797	2389	5809	6006	6069	5839
5502	2261	5797	5809	6006	6069
5568	2272	5502	5797	5809	6006
5864	2439	5568	5502	5797	5809
5764	2373	5864	5568	5502	5797
5615	2327	5764	5864	5568	5502
5615	2364	5615	5764	5864	5568
5681	2388	5615	5615	5764	5864
5915	2553	5681	5615	5615	5764
6334	2663	5915	5681	5615	5615
6494	2694	6334	5915	5681	5615
6620	2679	6494	6334	5915	5681
6578	2611	6620	6494	6334	5915
6495	2580	6578	6620	6494	6334
6538	2627	6495	6578	6620	6494
6737	2732	6538	6495	6578	6620
6651	2707	6737	6538	6495	6578
6530	2633	6651	6737	6538	6495
6563	2683	6530	6651	6737	6538


Summary of computational transaction
Raw Inputview raw input (R code)
Raw Outputview raw output of R engine
Computing time3 seconds
R Server'Gwilym Jenkins' @ 72.249.127.135

\begin{tabular}{lllllllll}
\hline
Summary of computational transaction \tabularnewline
Raw Input & view raw input (R code)  \tabularnewline
Raw Output & view raw output of R engine  \tabularnewline
Computing time & 3 seconds \tabularnewline
R Server & 'Gwilym Jenkins' @ 72.249.127.135 \tabularnewline
\hline
\end{tabular}
%Source: https://freestatistics.org/blog/index.php?pk=58201&T=0

[TABLE]
[ROW][C]Summary of computational transaction[/C][/ROW]
[ROW][C]Raw Input[/C][C]view raw input (R code) [/C][/ROW]
[ROW][C]Raw Output[/C][C]view raw output of R engine [/C][/ROW]
[ROW][C]Computing time[/C][C]3 seconds[/C][/ROW]
[ROW][C]R Server[/C][C]'Gwilym Jenkins' @ 72.249.127.135[/C][/ROW]
[/TABLE]
Source: https://freestatistics.org/blog/index.php?pk=58201&T=0

Globally Unique Identifier (entire table): ba.freestatistics.org/blog/index.php?pk=58201&T=0

As an alternative you can also use a QR Code:  

The GUIDs for individual cells are displayed in the table below:

Summary of computational transaction
Raw Inputview raw input (R code)
Raw Outputview raw output of R engine
Computing time3 seconds
R Server'Gwilym Jenkins' @ 72.249.127.135


Multiple Linear Regression - Estimated Regression Equation
Y[t] = -620.645522131992 + 1.12559599862179X[t] + 0.588250430193732`Y-1`[t] + 0.202239932456929`Y-2`[t] -0.119445465275896`Y-3`[t] -0.0445844438979129`Y-4`[t] -3.14891715732790M1[t] + 121.751080764899M2[t] + 45.263293361877M3[t] + 74.9696221902687M4[t] + 280.845825566085M5[t] + 64.0656486594804M6[t] -16.3205169905858M7[t] + 35.6389122153682M8[t] -1.96193224239403M9[t] + 75.2337682511196M10[t] + 193.584054612444M11[t] + 0.18436507248157t + e[t]

\begin{tabular}{lllllllll}
\hline
Multiple Linear Regression - Estimated Regression Equation \tabularnewline
Y[t] =  -620.645522131992 +  1.12559599862179X[t] +  0.588250430193732`Y-1`[t] +  0.202239932456929`Y-2`[t] -0.119445465275896`Y-3`[t] -0.0445844438979129`Y-4`[t] -3.14891715732790M1[t] +  121.751080764899M2[t] +  45.263293361877M3[t] +  74.9696221902687M4[t] +  280.845825566085M5[t] +  64.0656486594804M6[t] -16.3205169905858M7[t] +  35.6389122153682M8[t] -1.96193224239403M9[t] +  75.2337682511196M10[t] +  193.584054612444M11[t] +  0.18436507248157t  + e[t] \tabularnewline
\hline
\end{tabular}
%Source: https://freestatistics.org/blog/index.php?pk=58201&T=1

[TABLE]
[ROW][C]Multiple Linear Regression - Estimated Regression Equation[/C][/ROW]
[ROW][C]Y[t] =  -620.645522131992 +  1.12559599862179X[t] +  0.588250430193732`Y-1`[t] +  0.202239932456929`Y-2`[t] -0.119445465275896`Y-3`[t] -0.0445844438979129`Y-4`[t] -3.14891715732790M1[t] +  121.751080764899M2[t] +  45.263293361877M3[t] +  74.9696221902687M4[t] +  280.845825566085M5[t] +  64.0656486594804M6[t] -16.3205169905858M7[t] +  35.6389122153682M8[t] -1.96193224239403M9[t] +  75.2337682511196M10[t] +  193.584054612444M11[t] +  0.18436507248157t  + e[t][/C][/ROW]
[/TABLE]
Source: https://freestatistics.org/blog/index.php?pk=58201&T=1

Globally Unique Identifier (entire table): ba.freestatistics.org/blog/index.php?pk=58201&T=1

As an alternative you can also use a QR Code:  

The GUIDs for individual cells are displayed in the table below:

Multiple Linear Regression - Estimated Regression Equation
Y[t] = -620.645522131992 + 1.12559599862179X[t] + 0.588250430193732`Y-1`[t] + 0.202239932456929`Y-2`[t] -0.119445465275896`Y-3`[t] -0.0445844438979129`Y-4`[t] -3.14891715732790M1[t] + 121.751080764899M2[t] + 45.263293361877M3[t] + 74.9696221902687M4[t] + 280.845825566085M5[t] + 64.0656486594804M6[t] -16.3205169905858M7[t] + 35.6389122153682M8[t] -1.96193224239403M9[t] + 75.2337682511196M10[t] + 193.584054612444M11[t] + 0.18436507248157t + e[t]


Multiple Linear Regression - Ordinary Least Squares
VariableParameterS.D.T-STATH0: parameter = 02-tail p-value1-tail p-value
(Intercept)-620.645522131992275.31328-2.25430.0300220.015011
X1.125595998621790.1889565.95691e-060
`Y-1`0.5882504301937320.1373514.28280.0001216e-05
`Y-2`0.2022399324569290.167251.20920.2340540.117027
`Y-3`-0.1194454652758960.166839-0.71590.478410.239205
`Y-4`-0.04458444389791290.12344-0.36120.7199630.359982
M1-3.1489171573279077.242578-0.04080.9676950.483848
M2121.75108076489989.330781.36290.1809290.090464
M345.26329336187775.0250650.60330.5498880.274944
M474.969622190268778.7136920.95240.3468960.173448
M5280.84582556608578.6563293.57050.0009860.000493
M664.065648659480462.4999661.02510.311820.15591
M7-16.320516990585873.532638-0.22190.8255420.412771
M835.638912215368294.4429390.37740.7080060.354003
M9-1.9619322423940376.091243-0.02580.9795650.489782
M1075.233768251119678.1902870.96220.3420380.171019
M11193.58405461244469.2904452.79380.0081160.004058
t0.184365072481570.9980130.18470.8544210.427211

\begin{tabular}{lllllllll}
\hline
Multiple Linear Regression - Ordinary Least Squares \tabularnewline
Variable & Parameter & S.D. & T-STATH0: parameter = 0 & 2-tail p-value & 1-tail p-value \tabularnewline
(Intercept) & -620.645522131992 & 275.31328 & -2.2543 & 0.030022 & 0.015011 \tabularnewline
X & 1.12559599862179 & 0.188956 & 5.9569 & 1e-06 & 0 \tabularnewline
`Y-1` & 0.588250430193732 & 0.137351 & 4.2828 & 0.000121 & 6e-05 \tabularnewline
`Y-2` & 0.202239932456929 & 0.16725 & 1.2092 & 0.234054 & 0.117027 \tabularnewline
`Y-3` & -0.119445465275896 & 0.166839 & -0.7159 & 0.47841 & 0.239205 \tabularnewline
`Y-4` & -0.0445844438979129 & 0.12344 & -0.3612 & 0.719963 & 0.359982 \tabularnewline
M1 & -3.14891715732790 & 77.242578 & -0.0408 & 0.967695 & 0.483848 \tabularnewline
M2 & 121.751080764899 & 89.33078 & 1.3629 & 0.180929 & 0.090464 \tabularnewline
M3 & 45.263293361877 & 75.025065 & 0.6033 & 0.549888 & 0.274944 \tabularnewline
M4 & 74.9696221902687 & 78.713692 & 0.9524 & 0.346896 & 0.173448 \tabularnewline
M5 & 280.845825566085 & 78.656329 & 3.5705 & 0.000986 & 0.000493 \tabularnewline
M6 & 64.0656486594804 & 62.499966 & 1.0251 & 0.31182 & 0.15591 \tabularnewline
M7 & -16.3205169905858 & 73.532638 & -0.2219 & 0.825542 & 0.412771 \tabularnewline
M8 & 35.6389122153682 & 94.442939 & 0.3774 & 0.708006 & 0.354003 \tabularnewline
M9 & -1.96193224239403 & 76.091243 & -0.0258 & 0.979565 & 0.489782 \tabularnewline
M10 & 75.2337682511196 & 78.190287 & 0.9622 & 0.342038 & 0.171019 \tabularnewline
M11 & 193.584054612444 & 69.290445 & 2.7938 & 0.008116 & 0.004058 \tabularnewline
t & 0.18436507248157 & 0.998013 & 0.1847 & 0.854421 & 0.427211 \tabularnewline
\hline
\end{tabular}
%Source: https://freestatistics.org/blog/index.php?pk=58201&T=2

[TABLE]
[ROW][C]Multiple Linear Regression - Ordinary Least Squares[/C][/ROW]
[ROW][C]Variable[/C][C]Parameter[/C][C]S.D.[/C][C]T-STATH0: parameter = 0[/C][C]2-tail p-value[/C][C]1-tail p-value[/C][/ROW]
[ROW][C](Intercept)[/C][C]-620.645522131992[/C][C]275.31328[/C][C]-2.2543[/C][C]0.030022[/C][C]0.015011[/C][/ROW]
[ROW][C]X[/C][C]1.12559599862179[/C][C]0.188956[/C][C]5.9569[/C][C]1e-06[/C][C]0[/C][/ROW]
[ROW][C]`Y-1`[/C][C]0.588250430193732[/C][C]0.137351[/C][C]4.2828[/C][C]0.000121[/C][C]6e-05[/C][/ROW]
[ROW][C]`Y-2`[/C][C]0.202239932456929[/C][C]0.16725[/C][C]1.2092[/C][C]0.234054[/C][C]0.117027[/C][/ROW]
[ROW][C]`Y-3`[/C][C]-0.119445465275896[/C][C]0.166839[/C][C]-0.7159[/C][C]0.47841[/C][C]0.239205[/C][/ROW]
[ROW][C]`Y-4`[/C][C]-0.0445844438979129[/C][C]0.12344[/C][C]-0.3612[/C][C]0.719963[/C][C]0.359982[/C][/ROW]
[ROW][C]M1[/C][C]-3.14891715732790[/C][C]77.242578[/C][C]-0.0408[/C][C]0.967695[/C][C]0.483848[/C][/ROW]
[ROW][C]M2[/C][C]121.751080764899[/C][C]89.33078[/C][C]1.3629[/C][C]0.180929[/C][C]0.090464[/C][/ROW]
[ROW][C]M3[/C][C]45.263293361877[/C][C]75.025065[/C][C]0.6033[/C][C]0.549888[/C][C]0.274944[/C][/ROW]
[ROW][C]M4[/C][C]74.9696221902687[/C][C]78.713692[/C][C]0.9524[/C][C]0.346896[/C][C]0.173448[/C][/ROW]
[ROW][C]M5[/C][C]280.845825566085[/C][C]78.656329[/C][C]3.5705[/C][C]0.000986[/C][C]0.000493[/C][/ROW]
[ROW][C]M6[/C][C]64.0656486594804[/C][C]62.499966[/C][C]1.0251[/C][C]0.31182[/C][C]0.15591[/C][/ROW]
[ROW][C]M7[/C][C]-16.3205169905858[/C][C]73.532638[/C][C]-0.2219[/C][C]0.825542[/C][C]0.412771[/C][/ROW]
[ROW][C]M8[/C][C]35.6389122153682[/C][C]94.442939[/C][C]0.3774[/C][C]0.708006[/C][C]0.354003[/C][/ROW]
[ROW][C]M9[/C][C]-1.96193224239403[/C][C]76.091243[/C][C]-0.0258[/C][C]0.979565[/C][C]0.489782[/C][/ROW]
[ROW][C]M10[/C][C]75.2337682511196[/C][C]78.190287[/C][C]0.9622[/C][C]0.342038[/C][C]0.171019[/C][/ROW]
[ROW][C]M11[/C][C]193.584054612444[/C][C]69.290445[/C][C]2.7938[/C][C]0.008116[/C][C]0.004058[/C][/ROW]
[ROW][C]t[/C][C]0.18436507248157[/C][C]0.998013[/C][C]0.1847[/C][C]0.854421[/C][C]0.427211[/C][/ROW]
[/TABLE]
Source: https://freestatistics.org/blog/index.php?pk=58201&T=2

Globally Unique Identifier (entire table): ba.freestatistics.org/blog/index.php?pk=58201&T=2

As an alternative you can also use a QR Code:  

The GUIDs for individual cells are displayed in the table below:

Multiple Linear Regression - Ordinary Least Squares
VariableParameterS.D.T-STATH0: parameter = 02-tail p-value1-tail p-value
(Intercept)-620.645522131992275.31328-2.25430.0300220.015011
X1.125595998621790.1889565.95691e-060
`Y-1`0.5882504301937320.1373514.28280.0001216e-05
`Y-2`0.2022399324569290.167251.20920.2340540.117027
`Y-3`-0.1194454652758960.166839-0.71590.478410.239205
`Y-4`-0.04458444389791290.12344-0.36120.7199630.359982
M1-3.1489171573279077.242578-0.04080.9676950.483848
M2121.75108076489989.330781.36290.1809290.090464
M345.26329336187775.0250650.60330.5498880.274944
M474.969622190268778.7136920.95240.3468960.173448
M5280.84582556608578.6563293.57050.0009860.000493
M664.065648659480462.4999661.02510.311820.15591
M7-16.320516990585873.532638-0.22190.8255420.412771
M835.638912215368294.4429390.37740.7080060.354003
M9-1.9619322423940376.091243-0.02580.9795650.489782
M1075.233768251119678.1902870.96220.3420380.171019
M11193.58405461244469.2904452.79380.0081160.004058
t0.184365072481570.9980130.18470.8544210.427211


Multiple Linear Regression - Regression Statistics
Multiple R0.99121820663942
R-squared0.98251353317347
Adjusted R-squared0.974690640119495
F-TEST (value)125.594652310160
F-TEST (DF numerator)17
F-TEST (DF denominator)38
p-value0
Multiple Linear Regression - Residual Statistics
Residual Standard Deviation82.3882273668344
Sum Squared Residuals257937.16032867

\begin{tabular}{lllllllll}
\hline
Multiple Linear Regression - Regression Statistics \tabularnewline
Multiple R & 0.99121820663942 \tabularnewline
R-squared & 0.98251353317347 \tabularnewline
Adjusted R-squared & 0.974690640119495 \tabularnewline
F-TEST (value) & 125.594652310160 \tabularnewline
F-TEST (DF numerator) & 17 \tabularnewline
F-TEST (DF denominator) & 38 \tabularnewline
p-value & 0 \tabularnewline
Multiple Linear Regression - Residual Statistics \tabularnewline
Residual Standard Deviation & 82.3882273668344 \tabularnewline
Sum Squared Residuals & 257937.16032867 \tabularnewline
\hline
\end{tabular}
%Source: https://freestatistics.org/blog/index.php?pk=58201&T=3

[TABLE]
[ROW][C]Multiple Linear Regression - Regression Statistics[/C][/ROW]
[ROW][C]Multiple R[/C][C]0.99121820663942[/C][/ROW]
[ROW][C]R-squared[/C][C]0.98251353317347[/C][/ROW]
[ROW][C]Adjusted R-squared[/C][C]0.974690640119495[/C][/ROW]
[ROW][C]F-TEST (value)[/C][C]125.594652310160[/C][/ROW]
[ROW][C]F-TEST (DF numerator)[/C][C]17[/C][/ROW]
[ROW][C]F-TEST (DF denominator)[/C][C]38[/C][/ROW]
[ROW][C]p-value[/C][C]0[/C][/ROW]
[ROW][C]Multiple Linear Regression - Residual Statistics[/C][/ROW]
[ROW][C]Residual Standard Deviation[/C][C]82.3882273668344[/C][/ROW]
[ROW][C]Sum Squared Residuals[/C][C]257937.16032867[/C][/ROW]
[/TABLE]
Source: https://freestatistics.org/blog/index.php?pk=58201&T=3

Globally Unique Identifier (entire table): ba.freestatistics.org/blog/index.php?pk=58201&T=3

As an alternative you can also use a QR Code:  

The GUIDs for individual cells are displayed in the table below:

Multiple Linear Regression - Regression Statistics
Multiple R0.99121820663942
R-squared0.98251353317347
Adjusted R-squared0.974690640119495
F-TEST (value)125.594652310160
F-TEST (DF numerator)17
F-TEST (DF denominator)38
p-value0
Multiple Linear Regression - Residual Statistics
Residual Standard Deviation82.3882273668344
Sum Squared Residuals257937.16032867


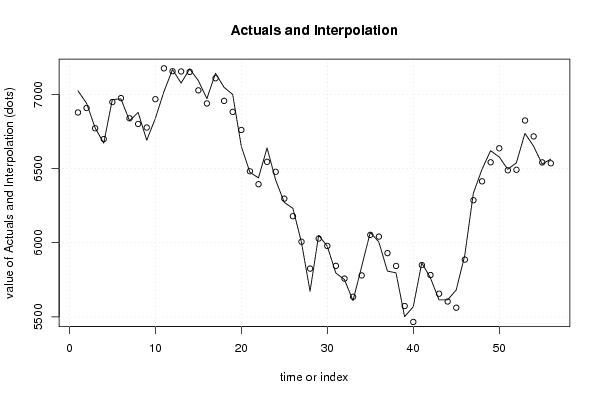
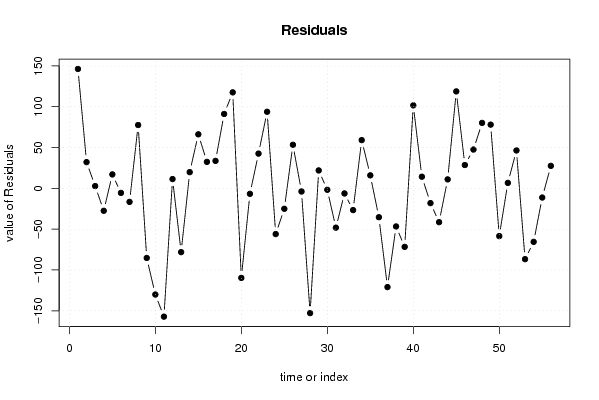
Multiple Linear Regression - Actuals, Interpolation, and Residuals
Time or IndexActualsInterpolationForecastResidualsPrediction Error
170246877.76279442965146.237205570348
269406907.891520352932.1084796471026
367746771.248226403232.75177359677171
466716698.52747110258-27.5274711025852
569656947.9862442901517.0137557098505
669696974.61414633045-5.61414633045086
768226838.60507639459-16.6050763945905
868786800.4489560630577.5510439369518
966916776.29713830142-85.2971383014155
1068376967.1080630203-130.108063020306
1170187175.2204290395-157.2204290395
1271677155.6702066295711.3297933704273
1370767154.17345363612-78.1734536361246
1471717151.1912914889719.8087085110280
1570937026.8440795746766.1559204253303
1669716938.614828820332.3851711796947
1771427108.3749871751633.6250128248395
1870476955.8940112863191.1059887136883
1969996881.44614966713117.553850332872
2066506759.72125344267-109.721253442666
2164756481.75574049234-6.75574049234104
2264376394.4535528518942.5464471481121
2366396545.2186563902593.7813436097497
2464226478.0370396859-56.037039685898
2562726297.06098409473-25.0609840947254
2662326178.6658582084953.3341417915107
2760036006.87904517082-3.87904517081784
2856735825.88677749343-152.886777493429
2960506028.0964443652421.9035556347609
3059775978.78431632814-1.78431632813645
3157965844.18881824448-48.1888182444806
3257525758.28484764926-6.28484764925505
3356095635.65835719429-26.6583571942899
3458395779.9658676685859.0341323314237
3560696053.0966684805415.9033315194631
3660066041.41704743962-35.4170474396174
3758095930.00976530013-121.009765300131
3857975843.71695874704-46.7169587470405
3955025573.70761895243-71.7076189524322
4055685466.35868936643101.641310633569
4158645849.7740189337614.2259810662402
4257645782.13025965327-18.1302596532649
4356155656.45803036863-41.4580303686308
4456155604.0771382325910.9228617674137
4556815562.28876401195118.711235988046
4659155886.4725164592328.5274835407697
4763346286.4642460897147.5357539102873
4864946413.8757062449180.1242937550881
4966206541.9930025393778.0069974606331
5065786636.5343712026-58.5343712026009
5164956488.321029898856.678970101148
5265386491.6122332172546.3877667827503
5367376823.76830523569-86.7683052356914
5466516716.57726640184-65.5772664018361
5565306541.30192532517-11.3019253251700
5665636535.4678046124427.5321953875558

\begin{tabular}{lllllllll}
\hline
Multiple Linear Regression - Actuals, Interpolation, and Residuals \tabularnewline
Time or Index & Actuals & InterpolationForecast & ResidualsPrediction Error \tabularnewline
1 & 7024 & 6877.76279442965 & 146.237205570348 \tabularnewline
2 & 6940 & 6907.8915203529 & 32.1084796471026 \tabularnewline
3 & 6774 & 6771.24822640323 & 2.75177359677171 \tabularnewline
4 & 6671 & 6698.52747110258 & -27.5274711025852 \tabularnewline
5 & 6965 & 6947.98624429015 & 17.0137557098505 \tabularnewline
6 & 6969 & 6974.61414633045 & -5.61414633045086 \tabularnewline
7 & 6822 & 6838.60507639459 & -16.6050763945905 \tabularnewline
8 & 6878 & 6800.44895606305 & 77.5510439369518 \tabularnewline
9 & 6691 & 6776.29713830142 & -85.2971383014155 \tabularnewline
10 & 6837 & 6967.1080630203 & -130.108063020306 \tabularnewline
11 & 7018 & 7175.2204290395 & -157.2204290395 \tabularnewline
12 & 7167 & 7155.67020662957 & 11.3297933704273 \tabularnewline
13 & 7076 & 7154.17345363612 & -78.1734536361246 \tabularnewline
14 & 7171 & 7151.19129148897 & 19.8087085110280 \tabularnewline
15 & 7093 & 7026.84407957467 & 66.1559204253303 \tabularnewline
16 & 6971 & 6938.6148288203 & 32.3851711796947 \tabularnewline
17 & 7142 & 7108.37498717516 & 33.6250128248395 \tabularnewline
18 & 7047 & 6955.89401128631 & 91.1059887136883 \tabularnewline
19 & 6999 & 6881.44614966713 & 117.553850332872 \tabularnewline
20 & 6650 & 6759.72125344267 & -109.721253442666 \tabularnewline
21 & 6475 & 6481.75574049234 & -6.75574049234104 \tabularnewline
22 & 6437 & 6394.45355285189 & 42.5464471481121 \tabularnewline
23 & 6639 & 6545.21865639025 & 93.7813436097497 \tabularnewline
24 & 6422 & 6478.0370396859 & -56.037039685898 \tabularnewline
25 & 6272 & 6297.06098409473 & -25.0609840947254 \tabularnewline
26 & 6232 & 6178.66585820849 & 53.3341417915107 \tabularnewline
27 & 6003 & 6006.87904517082 & -3.87904517081784 \tabularnewline
28 & 5673 & 5825.88677749343 & -152.886777493429 \tabularnewline
29 & 6050 & 6028.09644436524 & 21.9035556347609 \tabularnewline
30 & 5977 & 5978.78431632814 & -1.78431632813645 \tabularnewline
31 & 5796 & 5844.18881824448 & -48.1888182444806 \tabularnewline
32 & 5752 & 5758.28484764926 & -6.28484764925505 \tabularnewline
33 & 5609 & 5635.65835719429 & -26.6583571942899 \tabularnewline
34 & 5839 & 5779.96586766858 & 59.0341323314237 \tabularnewline
35 & 6069 & 6053.09666848054 & 15.9033315194631 \tabularnewline
36 & 6006 & 6041.41704743962 & -35.4170474396174 \tabularnewline
37 & 5809 & 5930.00976530013 & -121.009765300131 \tabularnewline
38 & 5797 & 5843.71695874704 & -46.7169587470405 \tabularnewline
39 & 5502 & 5573.70761895243 & -71.7076189524322 \tabularnewline
40 & 5568 & 5466.35868936643 & 101.641310633569 \tabularnewline
41 & 5864 & 5849.77401893376 & 14.2259810662402 \tabularnewline
42 & 5764 & 5782.13025965327 & -18.1302596532649 \tabularnewline
43 & 5615 & 5656.45803036863 & -41.4580303686308 \tabularnewline
44 & 5615 & 5604.07713823259 & 10.9228617674137 \tabularnewline
45 & 5681 & 5562.28876401195 & 118.711235988046 \tabularnewline
46 & 5915 & 5886.47251645923 & 28.5274835407697 \tabularnewline
47 & 6334 & 6286.46424608971 & 47.5357539102873 \tabularnewline
48 & 6494 & 6413.87570624491 & 80.1242937550881 \tabularnewline
49 & 6620 & 6541.99300253937 & 78.0069974606331 \tabularnewline
50 & 6578 & 6636.5343712026 & -58.5343712026009 \tabularnewline
51 & 6495 & 6488.32102989885 & 6.678970101148 \tabularnewline
52 & 6538 & 6491.61223321725 & 46.3877667827503 \tabularnewline
53 & 6737 & 6823.76830523569 & -86.7683052356914 \tabularnewline
54 & 6651 & 6716.57726640184 & -65.5772664018361 \tabularnewline
55 & 6530 & 6541.30192532517 & -11.3019253251700 \tabularnewline
56 & 6563 & 6535.46780461244 & 27.5321953875558 \tabularnewline
\hline
\end{tabular}
%Source: https://freestatistics.org/blog/index.php?pk=58201&T=4

[TABLE]
[ROW][C]Multiple Linear Regression - Actuals, Interpolation, and Residuals[/C][/ROW]
[ROW][C]Time or Index[/C][C]Actuals[/C][C]InterpolationForecast[/C][C]ResidualsPrediction Error[/C][/ROW]
[ROW][C]1[/C][C]7024[/C][C]6877.76279442965[/C][C]146.237205570348[/C][/ROW]
[ROW][C]2[/C][C]6940[/C][C]6907.8915203529[/C][C]32.1084796471026[/C][/ROW]
[ROW][C]3[/C][C]6774[/C][C]6771.24822640323[/C][C]2.75177359677171[/C][/ROW]
[ROW][C]4[/C][C]6671[/C][C]6698.52747110258[/C][C]-27.5274711025852[/C][/ROW]
[ROW][C]5[/C][C]6965[/C][C]6947.98624429015[/C][C]17.0137557098505[/C][/ROW]
[ROW][C]6[/C][C]6969[/C][C]6974.61414633045[/C][C]-5.61414633045086[/C][/ROW]
[ROW][C]7[/C][C]6822[/C][C]6838.60507639459[/C][C]-16.6050763945905[/C][/ROW]
[ROW][C]8[/C][C]6878[/C][C]6800.44895606305[/C][C]77.5510439369518[/C][/ROW]
[ROW][C]9[/C][C]6691[/C][C]6776.29713830142[/C][C]-85.2971383014155[/C][/ROW]
[ROW][C]10[/C][C]6837[/C][C]6967.1080630203[/C][C]-130.108063020306[/C][/ROW]
[ROW][C]11[/C][C]7018[/C][C]7175.2204290395[/C][C]-157.2204290395[/C][/ROW]
[ROW][C]12[/C][C]7167[/C][C]7155.67020662957[/C][C]11.3297933704273[/C][/ROW]
[ROW][C]13[/C][C]7076[/C][C]7154.17345363612[/C][C]-78.1734536361246[/C][/ROW]
[ROW][C]14[/C][C]7171[/C][C]7151.19129148897[/C][C]19.8087085110280[/C][/ROW]
[ROW][C]15[/C][C]7093[/C][C]7026.84407957467[/C][C]66.1559204253303[/C][/ROW]
[ROW][C]16[/C][C]6971[/C][C]6938.6148288203[/C][C]32.3851711796947[/C][/ROW]
[ROW][C]17[/C][C]7142[/C][C]7108.37498717516[/C][C]33.6250128248395[/C][/ROW]
[ROW][C]18[/C][C]7047[/C][C]6955.89401128631[/C][C]91.1059887136883[/C][/ROW]
[ROW][C]19[/C][C]6999[/C][C]6881.44614966713[/C][C]117.553850332872[/C][/ROW]
[ROW][C]20[/C][C]6650[/C][C]6759.72125344267[/C][C]-109.721253442666[/C][/ROW]
[ROW][C]21[/C][C]6475[/C][C]6481.75574049234[/C][C]-6.75574049234104[/C][/ROW]
[ROW][C]22[/C][C]6437[/C][C]6394.45355285189[/C][C]42.5464471481121[/C][/ROW]
[ROW][C]23[/C][C]6639[/C][C]6545.21865639025[/C][C]93.7813436097497[/C][/ROW]
[ROW][C]24[/C][C]6422[/C][C]6478.0370396859[/C][C]-56.037039685898[/C][/ROW]
[ROW][C]25[/C][C]6272[/C][C]6297.06098409473[/C][C]-25.0609840947254[/C][/ROW]
[ROW][C]26[/C][C]6232[/C][C]6178.66585820849[/C][C]53.3341417915107[/C][/ROW]
[ROW][C]27[/C][C]6003[/C][C]6006.87904517082[/C][C]-3.87904517081784[/C][/ROW]
[ROW][C]28[/C][C]5673[/C][C]5825.88677749343[/C][C]-152.886777493429[/C][/ROW]
[ROW][C]29[/C][C]6050[/C][C]6028.09644436524[/C][C]21.9035556347609[/C][/ROW]
[ROW][C]30[/C][C]5977[/C][C]5978.78431632814[/C][C]-1.78431632813645[/C][/ROW]
[ROW][C]31[/C][C]5796[/C][C]5844.18881824448[/C][C]-48.1888182444806[/C][/ROW]
[ROW][C]32[/C][C]5752[/C][C]5758.28484764926[/C][C]-6.28484764925505[/C][/ROW]
[ROW][C]33[/C][C]5609[/C][C]5635.65835719429[/C][C]-26.6583571942899[/C][/ROW]
[ROW][C]34[/C][C]5839[/C][C]5779.96586766858[/C][C]59.0341323314237[/C][/ROW]
[ROW][C]35[/C][C]6069[/C][C]6053.09666848054[/C][C]15.9033315194631[/C][/ROW]
[ROW][C]36[/C][C]6006[/C][C]6041.41704743962[/C][C]-35.4170474396174[/C][/ROW]
[ROW][C]37[/C][C]5809[/C][C]5930.00976530013[/C][C]-121.009765300131[/C][/ROW]
[ROW][C]38[/C][C]5797[/C][C]5843.71695874704[/C][C]-46.7169587470405[/C][/ROW]
[ROW][C]39[/C][C]5502[/C][C]5573.70761895243[/C][C]-71.7076189524322[/C][/ROW]
[ROW][C]40[/C][C]5568[/C][C]5466.35868936643[/C][C]101.641310633569[/C][/ROW]
[ROW][C]41[/C][C]5864[/C][C]5849.77401893376[/C][C]14.2259810662402[/C][/ROW]
[ROW][C]42[/C][C]5764[/C][C]5782.13025965327[/C][C]-18.1302596532649[/C][/ROW]
[ROW][C]43[/C][C]5615[/C][C]5656.45803036863[/C][C]-41.4580303686308[/C][/ROW]
[ROW][C]44[/C][C]5615[/C][C]5604.07713823259[/C][C]10.9228617674137[/C][/ROW]
[ROW][C]45[/C][C]5681[/C][C]5562.28876401195[/C][C]118.711235988046[/C][/ROW]
[ROW][C]46[/C][C]5915[/C][C]5886.47251645923[/C][C]28.5274835407697[/C][/ROW]
[ROW][C]47[/C][C]6334[/C][C]6286.46424608971[/C][C]47.5357539102873[/C][/ROW]
[ROW][C]48[/C][C]6494[/C][C]6413.87570624491[/C][C]80.1242937550881[/C][/ROW]
[ROW][C]49[/C][C]6620[/C][C]6541.99300253937[/C][C]78.0069974606331[/C][/ROW]
[ROW][C]50[/C][C]6578[/C][C]6636.5343712026[/C][C]-58.5343712026009[/C][/ROW]
[ROW][C]51[/C][C]6495[/C][C]6488.32102989885[/C][C]6.678970101148[/C][/ROW]
[ROW][C]52[/C][C]6538[/C][C]6491.61223321725[/C][C]46.3877667827503[/C][/ROW]
[ROW][C]53[/C][C]6737[/C][C]6823.76830523569[/C][C]-86.7683052356914[/C][/ROW]
[ROW][C]54[/C][C]6651[/C][C]6716.57726640184[/C][C]-65.5772664018361[/C][/ROW]
[ROW][C]55[/C][C]6530[/C][C]6541.30192532517[/C][C]-11.3019253251700[/C][/ROW]
[ROW][C]56[/C][C]6563[/C][C]6535.46780461244[/C][C]27.5321953875558[/C][/ROW]
[/TABLE]
Source: https://freestatistics.org/blog/index.php?pk=58201&T=4

Globally Unique Identifier (entire table): ba.freestatistics.org/blog/index.php?pk=58201&T=4

As an alternative you can also use a QR Code:  

The GUIDs for individual cells are displayed in the table below:

Multiple Linear Regression - Actuals, Interpolation, and Residuals
Time or IndexActualsInterpolationForecastResidualsPrediction Error
170246877.76279442965146.237205570348
269406907.891520352932.1084796471026
367746771.248226403232.75177359677171
466716698.52747110258-27.5274711025852
569656947.9862442901517.0137557098505
669696974.61414633045-5.61414633045086
768226838.60507639459-16.6050763945905
868786800.4489560630577.5510439369518
966916776.29713830142-85.2971383014155
1068376967.1080630203-130.108063020306
1170187175.2204290395-157.2204290395
1271677155.6702066295711.3297933704273
1370767154.17345363612-78.1734536361246
1471717151.1912914889719.8087085110280
1570937026.8440795746766.1559204253303
1669716938.614828820332.3851711796947
1771427108.3749871751633.6250128248395
1870476955.8940112863191.1059887136883
1969996881.44614966713117.553850332872
2066506759.72125344267-109.721253442666
2164756481.75574049234-6.75574049234104
2264376394.4535528518942.5464471481121
2366396545.2186563902593.7813436097497
2464226478.0370396859-56.037039685898
2562726297.06098409473-25.0609840947254
2662326178.6658582084953.3341417915107
2760036006.87904517082-3.87904517081784
2856735825.88677749343-152.886777493429
2960506028.0964443652421.9035556347609
3059775978.78431632814-1.78431632813645
3157965844.18881824448-48.1888182444806
3257525758.28484764926-6.28484764925505
3356095635.65835719429-26.6583571942899
3458395779.9658676685859.0341323314237
3560696053.0966684805415.9033315194631
3660066041.41704743962-35.4170474396174
3758095930.00976530013-121.009765300131
3857975843.71695874704-46.7169587470405
3955025573.70761895243-71.7076189524322
4055685466.35868936643101.641310633569
4158645849.7740189337614.2259810662402
4257645782.13025965327-18.1302596532649
4356155656.45803036863-41.4580303686308
4456155604.0771382325910.9228617674137
4556815562.28876401195118.711235988046
4659155886.4725164592328.5274835407697
4763346286.4642460897147.5357539102873
4864946413.8757062449180.1242937550881
4966206541.9930025393778.0069974606331
5065786636.5343712026-58.5343712026009
5164956488.321029898856.678970101148
5265386491.6122332172546.3877667827503
5367376823.76830523569-86.7683052356914
5466516716.57726640184-65.5772664018361
5565306541.30192532517-11.3019253251700
5665636535.4678046124427.5321953875558


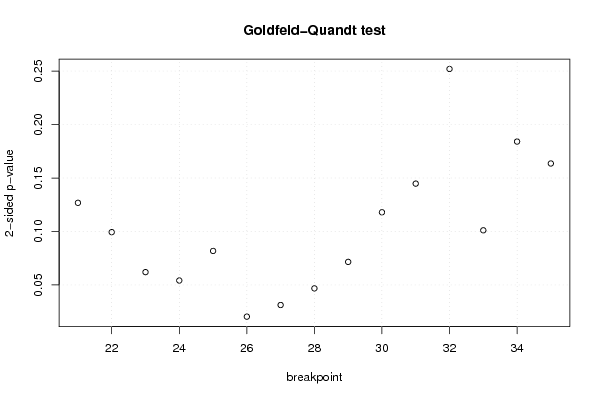
Goldfeld-Quandt test for Heteroskedasticity
p-valuesAlternative Hypothesis
breakpoint indexgreater2-sidedless
210.9366067613848880.1267864772302240.063393238615112
220.9503220611260770.09935587774784570.0496779388739229
230.969022153590030.06195569281993870.0309778464099693
240.9729479182893920.05410416342121550.0270520817106078
250.9591191476254960.08176170474900810.0408808523745041
260.9898534322227320.02029313555453680.0101465677772684
270.9844110310739580.03117793785208430.0155889689260422
280.9766252591543680.04674948169126500.0233747408456325
290.9642354413102980.07152911737940420.0357645586897021
300.9410269256055860.1179461487888270.0589730743944137
310.927622446914650.1447551061706990.0723775530853494
320.8739841813853750.252031637229250.126015818614625
330.9494581317861040.1010837364277920.050541868213896
340.9079504964576660.1840990070846670.0920495035423337
350.91820359479950.1635928104010020.0817964052005011

\begin{tabular}{lllllllll}
\hline
Goldfeld-Quandt test for Heteroskedasticity \tabularnewline
p-values & Alternative Hypothesis \tabularnewline
breakpoint index & greater & 2-sided & less \tabularnewline
21 & 0.936606761384888 & 0.126786477230224 & 0.063393238615112 \tabularnewline
22 & 0.950322061126077 & 0.0993558777478457 & 0.0496779388739229 \tabularnewline
23 & 0.96902215359003 & 0.0619556928199387 & 0.0309778464099693 \tabularnewline
24 & 0.972947918289392 & 0.0541041634212155 & 0.0270520817106078 \tabularnewline
25 & 0.959119147625496 & 0.0817617047490081 & 0.0408808523745041 \tabularnewline
26 & 0.989853432222732 & 0.0202931355545368 & 0.0101465677772684 \tabularnewline
27 & 0.984411031073958 & 0.0311779378520843 & 0.0155889689260422 \tabularnewline
28 & 0.976625259154368 & 0.0467494816912650 & 0.0233747408456325 \tabularnewline
29 & 0.964235441310298 & 0.0715291173794042 & 0.0357645586897021 \tabularnewline
30 & 0.941026925605586 & 0.117946148788827 & 0.0589730743944137 \tabularnewline
31 & 0.92762244691465 & 0.144755106170699 & 0.0723775530853494 \tabularnewline
32 & 0.873984181385375 & 0.25203163722925 & 0.126015818614625 \tabularnewline
33 & 0.949458131786104 & 0.101083736427792 & 0.050541868213896 \tabularnewline
34 & 0.907950496457666 & 0.184099007084667 & 0.0920495035423337 \tabularnewline
35 & 0.9182035947995 & 0.163592810401002 & 0.0817964052005011 \tabularnewline
\hline
\end{tabular}
%Source: https://freestatistics.org/blog/index.php?pk=58201&T=5

[TABLE]
[ROW][C]Goldfeld-Quandt test for Heteroskedasticity[/C][/ROW]
[ROW][C]p-values[/C][C]Alternative Hypothesis[/C][/ROW]
[ROW][C]breakpoint index[/C][C]greater[/C][C]2-sided[/C][C]less[/C][/ROW]
[ROW][C]21[/C][C]0.936606761384888[/C][C]0.126786477230224[/C][C]0.063393238615112[/C][/ROW]
[ROW][C]22[/C][C]0.950322061126077[/C][C]0.0993558777478457[/C][C]0.0496779388739229[/C][/ROW]
[ROW][C]23[/C][C]0.96902215359003[/C][C]0.0619556928199387[/C][C]0.0309778464099693[/C][/ROW]
[ROW][C]24[/C][C]0.972947918289392[/C][C]0.0541041634212155[/C][C]0.0270520817106078[/C][/ROW]
[ROW][C]25[/C][C]0.959119147625496[/C][C]0.0817617047490081[/C][C]0.0408808523745041[/C][/ROW]
[ROW][C]26[/C][C]0.989853432222732[/C][C]0.0202931355545368[/C][C]0.0101465677772684[/C][/ROW]
[ROW][C]27[/C][C]0.984411031073958[/C][C]0.0311779378520843[/C][C]0.0155889689260422[/C][/ROW]
[ROW][C]28[/C][C]0.976625259154368[/C][C]0.0467494816912650[/C][C]0.0233747408456325[/C][/ROW]
[ROW][C]29[/C][C]0.964235441310298[/C][C]0.0715291173794042[/C][C]0.0357645586897021[/C][/ROW]
[ROW][C]30[/C][C]0.941026925605586[/C][C]0.117946148788827[/C][C]0.0589730743944137[/C][/ROW]
[ROW][C]31[/C][C]0.92762244691465[/C][C]0.144755106170699[/C][C]0.0723775530853494[/C][/ROW]
[ROW][C]32[/C][C]0.873984181385375[/C][C]0.25203163722925[/C][C]0.126015818614625[/C][/ROW]
[ROW][C]33[/C][C]0.949458131786104[/C][C]0.101083736427792[/C][C]0.050541868213896[/C][/ROW]
[ROW][C]34[/C][C]0.907950496457666[/C][C]0.184099007084667[/C][C]0.0920495035423337[/C][/ROW]
[ROW][C]35[/C][C]0.9182035947995[/C][C]0.163592810401002[/C][C]0.0817964052005011[/C][/ROW]
[/TABLE]
Source: https://freestatistics.org/blog/index.php?pk=58201&T=5

Globally Unique Identifier (entire table): ba.freestatistics.org/blog/index.php?pk=58201&T=5

As an alternative you can also use a QR Code:  

The GUIDs for individual cells are displayed in the table below:

Goldfeld-Quandt test for Heteroskedasticity
p-valuesAlternative Hypothesis
breakpoint indexgreater2-sidedless
210.9366067613848880.1267864772302240.063393238615112
220.9503220611260770.09935587774784570.0496779388739229
230.969022153590030.06195569281993870.0309778464099693
240.9729479182893920.05410416342121550.0270520817106078
250.9591191476254960.08176170474900810.0408808523745041
260.9898534322227320.02029313555453680.0101465677772684
270.9844110310739580.03117793785208430.0155889689260422
280.9766252591543680.04674948169126500.0233747408456325
290.9642354413102980.07152911737940420.0357645586897021
300.9410269256055860.1179461487888270.0589730743944137
310.927622446914650.1447551061706990.0723775530853494
320.8739841813853750.252031637229250.126015818614625
330.9494581317861040.1010837364277920.050541868213896
340.9079504964576660.1840990070846670.0920495035423337
350.91820359479950.1635928104010020.0817964052005011


Meta Analysis of Goldfeld-Quandt test for Heteroskedasticity
Description# significant tests% significant testsOK/NOK
1% type I error level00OK
5% type I error level30.2NOK
10% type I error level80.533333333333333NOK

\begin{tabular}{lllllllll}
\hline
Meta Analysis of Goldfeld-Quandt test for Heteroskedasticity \tabularnewline
Description & # significant tests & % significant tests & OK/NOK \tabularnewline
1% type I error level & 0 & 0 & OK \tabularnewline
5% type I error level & 3 & 0.2 & NOK \tabularnewline
10% type I error level & 8 & 0.533333333333333 & NOK \tabularnewline
\hline
\end{tabular}
%Source: https://freestatistics.org/blog/index.php?pk=58201&T=6

[TABLE]
[ROW][C]Meta Analysis of Goldfeld-Quandt test for Heteroskedasticity[/C][/ROW]
[ROW][C]Description[/C][C]# significant tests[/C][C]% significant tests[/C][C]OK/NOK[/C][/ROW]
[ROW][C]1% type I error level[/C][C]0[/C][C]0[/C][C]OK[/C][/ROW]
[ROW][C]5% type I error level[/C][C]3[/C][C]0.2[/C][C]NOK[/C][/ROW]
[ROW][C]10% type I error level[/C][C]8[/C][C]0.533333333333333[/C][C]NOK[/C][/ROW]
[/TABLE]
Source: https://freestatistics.org/blog/index.php?pk=58201&T=6

Globally Unique Identifier (entire table): ba.freestatistics.org/blog/index.php?pk=58201&T=6

As an alternative you can also use a QR Code:  

The GUIDs for individual cells are displayed in the table below:

Meta Analysis of Goldfeld-Quandt test for Heteroskedasticity
Description# significant tests% significant testsOK/NOK
1% type I error level00OK
5% type I error level30.2NOK
10% type I error level80.533333333333333NOK


Parameters (Session):
par1 = 1 ; par2 = Include Monthly Dummies ; par3 = Linear Trend ;
Parameters (R input):
par1 = 1 ; par2 = Include Monthly Dummies ; par3 = Linear Trend ;
R code (references can be found in the software module):
library(lattice)
library(lmtest)
n25 <- 25 #minimum number of obs. for Goldfeld-Quandt test
par1 <- as.numeric(par1)
x <- t(y)
k <- length(x[1,])
n <- length(x[,1])
x1 <- cbind(x[,par1], x[,1:k!=par1])
mycolnames <- c(colnames(x)[par1], colnames(x)[1:k!=par1])
colnames(x1) <- mycolnames #colnames(x)[par1]
x <- x1
if (par3 == 'First Differences'){
x2 <- array(0, dim=c(n-1,k), dimnames=list(1:(n-1), paste('(1-B)',colnames(x),sep='')))
for (i in 1:n-1) {
for (j in 1:k) {
x2[i,j] <- x[i+1,j] - x[i,j]
}
}
x <- x2
}
if (par2 == 'Include Monthly Dummies'){
x2 <- array(0, dim=c(n,11), dimnames=list(1:n, paste('M', seq(1:11), sep ='')))
for (i in 1:11){
x2[seq(i,n,12),i] <- 1
}
x <- cbind(x, x2)
}
if (par2 == 'Include Quarterly Dummies'){
x2 <- array(0, dim=c(n,3), dimnames=list(1:n, paste('Q', seq(1:3), sep ='')))
for (i in 1:3){
x2[seq(i,n,4),i] <- 1
}
x <- cbind(x, x2)
}
k <- length(x[1,])
if (par3 == 'Linear Trend'){
x <- cbind(x, c(1:n))
colnames(x)[k+1] <- 't'
}
x
k <- length(x[1,])
df <- as.data.frame(x)
(mylm <- lm(df))
(mysum <- summary(mylm))
if (n > n25) {
kp3 <- k + 3
nmkm3 <- n - k - 3
gqarr <- array(NA, dim=c(nmkm3-kp3+1,3))
numgqtests <- 0
numsignificant1 <- 0
numsignificant5 <- 0
numsignificant10 <- 0
for (mypoint in kp3:nmkm3) {
j <- 0
numgqtests <- numgqtests + 1
for (myalt in c('greater', 'two.sided', 'less')) {
j <- j + 1
gqarr[mypoint-kp3+1,j] <- gqtest(mylm, point=mypoint, alternative=myalt)$p.value
}
if (gqarr[mypoint-kp3+1,2] < 0.01) numsignificant1 <- numsignificant1 + 1
if (gqarr[mypoint-kp3+1,2] < 0.05) numsignificant5 <- numsignificant5 + 1
if (gqarr[mypoint-kp3+1,2] < 0.10) numsignificant10 <- numsignificant10 + 1
}
gqarr
}
bitmap(file='test0.png')
plot(x[,1], type='l', main='Actuals and Interpolation', ylab='value of Actuals and Interpolation (dots)', xlab='time or index')
points(x[,1]-mysum$resid)
grid()
dev.off()
bitmap(file='test1.png')
plot(mysum$resid, type='b', pch=19, main='Residuals', ylab='value of Residuals', xlab='time or index')
grid()
dev.off()
bitmap(file='test2.png')
hist(mysum$resid, main='Residual Histogram', xlab='values of Residuals')
grid()
dev.off()
bitmap(file='test3.png')
densityplot(~mysum$resid,col='black',main='Residual Density Plot', xlab='values of Residuals')
dev.off()
bitmap(file='test4.png')
qqnorm(mysum$resid, main='Residual Normal Q-Q Plot')
qqline(mysum$resid)
grid()
dev.off()
(myerror <- as.ts(mysum$resid))
bitmap(file='test5.png')
dum <- cbind(lag(myerror,k=1),myerror)
dum
dum1 <- dum[2:length(myerror),]
dum1
z <- as.data.frame(dum1)
z
plot(z,main=paste('Residual Lag plot, lowess, and regression line'), ylab='values of Residuals', xlab='lagged values of Residuals')
lines(lowess(z))
abline(lm(z))
grid()
dev.off()
bitmap(file='test6.png')
acf(mysum$resid, lag.max=length(mysum$resid)/2, main='Residual Autocorrelation Function')
grid()
dev.off()
bitmap(file='test7.png')
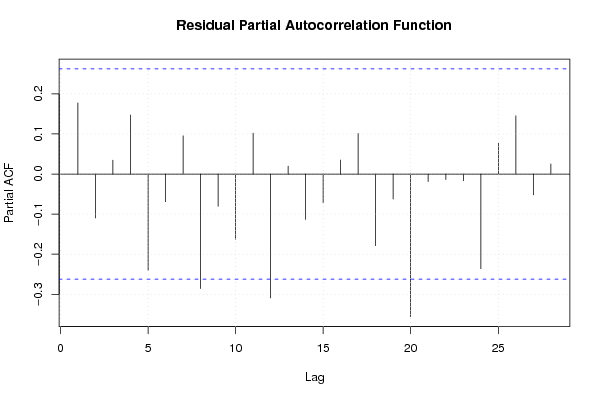
pacf(mysum$resid, lag.max=length(mysum$resid)/2, main='Residual Partial Autocorrelation Function')
grid()
dev.off()
bitmap(file='test8.png')
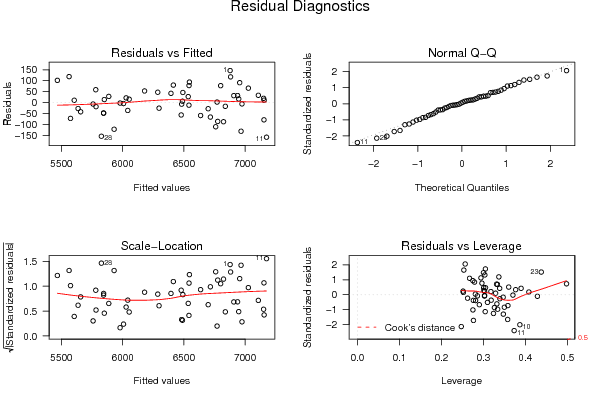
opar <- par(mfrow = c(2,2), oma = c(0, 0, 1.1, 0))
plot(mylm, las = 1, sub='Residual Diagnostics')
par(opar)
dev.off()
if (n > n25) {
bitmap(file='test9.png')
plot(kp3:nmkm3,gqarr[,2], main='Goldfeld-Quandt test',ylab='2-sided p-value',xlab='breakpoint')
grid()
dev.off()
}
load(file='createtable')
a<-table.start()
a<-table.row.start(a)
a<-table.element(a, 'Multiple Linear Regression - Estimated Regression Equation', 1, TRUE)
a<-table.row.end(a)
myeq <- colnames(x)[1]
myeq <- paste(myeq, '[t] = ', sep='')
for (i in 1:k){
if (mysum$coefficients[i,1] > 0) myeq <- paste(myeq, '+', '')
myeq <- paste(myeq, mysum$coefficients[i,1], sep=' ')
if (rownames(mysum$coefficients)[i] != '(Intercept)') {
myeq <- paste(myeq, rownames(mysum$coefficients)[i], sep='')
if (rownames(mysum$coefficients)[i] != 't') myeq <- paste(myeq, '[t]', sep='')
}
}
myeq <- paste(myeq, ' + e[t]')
a<-table.row.start(a)
a<-table.element(a, myeq)
a<-table.row.end(a)
a<-table.end(a)
table.save(a,file='mytable1.tab')
a<-table.start()
a<-table.row.start(a)
a<-table.element(a,hyperlink('ols1.htm','Multiple Linear Regression - Ordinary Least Squares',''), 6, TRUE)
a<-table.row.end(a)
a<-table.row.start(a)
a<-table.element(a,'Variable',header=TRUE)
a<-table.element(a,'Parameter',header=TRUE)
a<-table.element(a,'S.D.',header=TRUE)
a<-table.element(a,'T-STAT
H0: parameter = 0',header=TRUE)
a<-table.element(a,'2-tail p-value',header=TRUE)
a<-table.element(a,'1-tail p-value',header=TRUE)
a<-table.row.end(a)
for (i in 1:k){
a<-table.row.start(a)
a<-table.element(a,rownames(mysum$coefficients)[i],header=TRUE)
a<-table.element(a,mysum$coefficients[i,1])
a<-table.element(a, round(mysum$coefficients[i,2],6))
a<-table.element(a, round(mysum$coefficients[i,3],4))
a<-table.element(a, round(mysum$coefficients[i,4],6))
a<-table.element(a, round(mysum$coefficients[i,4]/2,6))
a<-table.row.end(a)
}
a<-table.end(a)
table.save(a,file='mytable2.tab')
a<-table.start()
a<-table.row.start(a)
a<-table.element(a, 'Multiple Linear Regression - Regression Statistics', 2, TRUE)
a<-table.row.end(a)
a<-table.row.start(a)
a<-table.element(a, 'Multiple R',1,TRUE)
a<-table.element(a, sqrt(mysum$r.squared))
a<-table.row.end(a)
a<-table.row.start(a)
a<-table.element(a, 'R-squared',1,TRUE)
a<-table.element(a, mysum$r.squared)
a<-table.row.end(a)
a<-table.row.start(a)
a<-table.element(a, 'Adjusted R-squared',1,TRUE)
a<-table.element(a, mysum$adj.r.squared)
a<-table.row.end(a)
a<-table.row.start(a)
a<-table.element(a, 'F-TEST (value)',1,TRUE)
a<-table.element(a, mysum$fstatistic[1])
a<-table.row.end(a)
a<-table.row.start(a)
a<-table.element(a, 'F-TEST (DF numerator)',1,TRUE)
a<-table.element(a, mysum$fstatistic[2])
a<-table.row.end(a)
a<-table.row.start(a)
a<-table.element(a, 'F-TEST (DF denominator)',1,TRUE)
a<-table.element(a, mysum$fstatistic[3])
a<-table.row.end(a)
a<-table.row.start(a)
a<-table.element(a, 'p-value',1,TRUE)
a<-table.element(a, 1-pf(mysum$fstatistic[1],mysum$fstatistic[2],mysum$fstatistic[3]))
a<-table.row.end(a)
a<-table.row.start(a)
a<-table.element(a, 'Multiple Linear Regression - Residual Statistics', 2, TRUE)
a<-table.row.end(a)
a<-table.row.start(a)
a<-table.element(a, 'Residual Standard Deviation',1,TRUE)
a<-table.element(a, mysum$sigma)
a<-table.row.end(a)
a<-table.row.start(a)
a<-table.element(a, 'Sum Squared Residuals',1,TRUE)
a<-table.element(a, sum(myerror*myerror))
a<-table.row.end(a)
a<-table.end(a)
table.save(a,file='mytable3.tab')
a<-table.start()
a<-table.row.start(a)
a<-table.element(a, 'Multiple Linear Regression - Actuals, Interpolation, and Residuals', 4, TRUE)
a<-table.row.end(a)
a<-table.row.start(a)
a<-table.element(a, 'Time or Index', 1, TRUE)
a<-table.element(a, 'Actuals', 1, TRUE)
a<-table.element(a, 'Interpolation
Forecast', 1, TRUE)
a<-table.element(a, 'Residuals
Prediction Error', 1, TRUE)
a<-table.row.end(a)
for (i in 1:n) {
a<-table.row.start(a)
a<-table.element(a,i, 1, TRUE)
a<-table.element(a,x[i])
a<-table.element(a,x[i]-mysum$resid[i])
a<-table.element(a,mysum$resid[i])
a<-table.row.end(a)
}
a<-table.end(a)
table.save(a,file='mytable4.tab')
if (n > n25) {
a<-table.start()
a<-table.row.start(a)
a<-table.element(a,'Goldfeld-Quandt test for Heteroskedasticity',4,TRUE)
a<-table.row.end(a)
a<-table.row.start(a)
a<-table.element(a,'p-values',header=TRUE)
a<-table.element(a,'Alternative Hypothesis',3,header=TRUE)
a<-table.row.end(a)
a<-table.row.start(a)
a<-table.element(a,'breakpoint index',header=TRUE)
a<-table.element(a,'greater',header=TRUE)
a<-table.element(a,'2-sided',header=TRUE)
a<-table.element(a,'less',header=TRUE)
a<-table.row.end(a)
for (mypoint in kp3:nmkm3) {
a<-table.row.start(a)
a<-table.element(a,mypoint,header=TRUE)
a<-table.element(a,gqarr[mypoint-kp3+1,1])
a<-table.element(a,gqarr[mypoint-kp3+1,2])
a<-table.element(a,gqarr[mypoint-kp3+1,3])
a<-table.row.end(a)
}
a<-table.end(a)
table.save(a,file='mytable5.tab')
a<-table.start()
a<-table.row.start(a)
a<-table.element(a,'Meta Analysis of Goldfeld-Quandt test for Heteroskedasticity',4,TRUE)
a<-table.row.end(a)
a<-table.row.start(a)
a<-table.element(a,'Description',header=TRUE)
a<-table.element(a,'# significant tests',header=TRUE)
a<-table.element(a,'% significant tests',header=TRUE)
a<-table.element(a,'OK/NOK',header=TRUE)
a<-table.row.end(a)
a<-table.row.start(a)
a<-table.element(a,'1% type I error level',header=TRUE)
a<-table.element(a,numsignificant1)
a<-table.element(a,numsignificant1/numgqtests)
if (numsignificant1/numgqtests < 0.01) dum <- 'OK' else dum <- 'NOK'
a<-table.element(a,dum)
a<-table.row.end(a)
a<-table.row.start(a)
a<-table.element(a,'5% type I error level',header=TRUE)
a<-table.element(a,numsignificant5)
a<-table.element(a,numsignificant5/numgqtests)
if (numsignificant5/numgqtests < 0.05) dum <- 'OK' else dum <- 'NOK'
a<-table.element(a,dum)
a<-table.row.end(a)
a<-table.row.start(a)
a<-table.element(a,'10% type I error level',header=TRUE)
a<-table.element(a,numsignificant10)
a<-table.element(a,numsignificant10/numgqtests)
if (numsignificant10/numgqtests < 0.1) dum <- 'OK' else dum <- 'NOK'
a<-table.element(a,dum)
a<-table.row.end(a)
a<-table.end(a)
table.save(a,file='mytable6.tab')
}