| Multiple Linear Regression - Estimated Regression Equation |
| WklBe[t] = + 668.809090909091 + 48.5649350649351X[t] -25.2756132756135M1[t] -45.9339105339106M2[t] -58.8805194805196M3[t] -54.0271284271285M4[t] -49.3737373737373M5[t] -51.1203463203463M6[t] -57.4669552669553M7[t] -60.0135642135643M8[t] -68.7601731601732M9[t] -64.1067821067821M10[t] -10.4533910533911M11[t] -2.45339105339105t + e[t] |
| Multiple Linear Regression - Ordinary Least Squares | |||||
| Variable | Parameter | S.D. | T-STAT H0: parameter = 0 | 2-tail p-value | 1-tail p-value |
| (Intercept) | 668.809090909091 | 12.174422 | 54.9356 | 0 | 0 |
| X | 48.5649350649351 | 10.017937 | 4.8478 | 1.4e-05 | 7e-06 |
| M1 | -25.2756132756135 | 13.53622 | -1.8673 | 0.068109 | 0.034055 |
| M2 | -45.9339105339106 | 14.124017 | -3.2522 | 0.002123 | 0.001061 |
| M3 | -58.8805194805196 | 14.086711 | -4.1799 | 0.000126 | 6.3e-05 |
| M4 | -54.0271284271285 | 14.053249 | -3.8445 | 0.000362 | 0.000181 |
| M5 | -49.3737373737373 | 14.023656 | -3.5207 | 0.000968 | 0.000484 |
| M6 | -51.1203463203463 | 13.997959 | -3.652 | 0.000653 | 0.000326 |
| M7 | -57.4669552669553 | 13.976178 | -4.1118 | 0.000156 | 7.8e-05 |
| M8 | -60.0135642135643 | 13.958332 | -4.2995 | 8.6e-05 | 4.3e-05 |
| M9 | -68.7601731601732 | 13.944437 | -4.931 | 1.1e-05 | 5e-06 |
| M10 | -64.1067821067821 | 13.934502 | -4.6006 | 3.2e-05 | 1.6e-05 |
| M11 | -10.4533910533911 | 13.928539 | -0.7505 | 0.456694 | 0.228347 |
| t | -2.45339105339105 | 0.235352 | -10.4243 | 0 | 0 |
| Multiple Linear Regression - Regression Statistics | |
| Multiple R | 0.886111711290853 |
| R-squared | 0.785193964886805 |
| Adjusted R-squared | 0.72577952964273 |
| F-TEST (value) | 13.2155420086250 |
| F-TEST (DF numerator) | 13 |
| F-TEST (DF denominator) | 47 |
| p-value | 1.37907463226838e-11 |
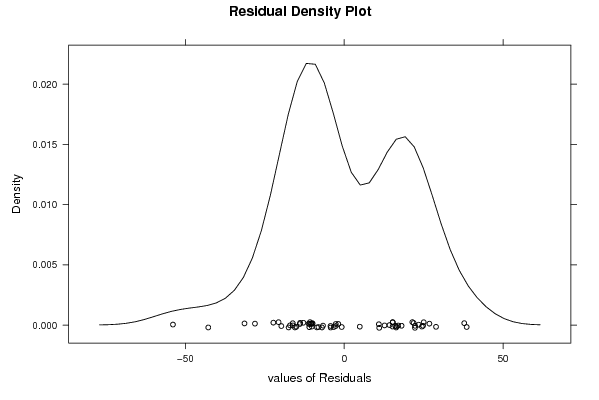
| Multiple Linear Regression - Residual Statistics | |
| Residual Standard Deviation | 22.0198090459688 |
| Sum Squared Residuals | 22788.9835497836 |
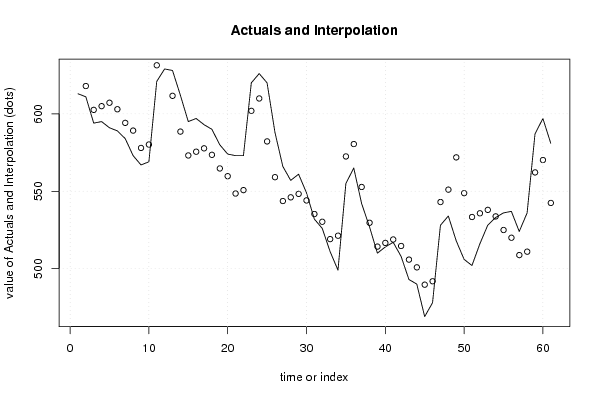
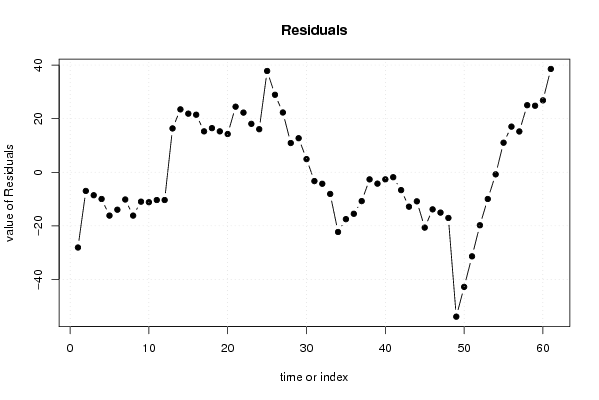
| Multiple Linear Regression - Actuals, Interpolation, and Residuals | |||
| Time or Index | Actuals | Interpolation Forecast | Residuals Prediction Error |
| 1 | 613 | 641.080086580087 | -28.0800865800875 |
| 2 | 611 | 617.968398268398 | -6.96839826839825 |
| 3 | 594 | 602.568398268398 | -8.56839826839822 |
| 4 | 595 | 604.968398268398 | -9.96839826839813 |
| 5 | 591 | 607.168398268398 | -16.1683982683981 |
| 6 | 589 | 602.968398268398 | -13.9683982683981 |
| 7 | 584 | 594.168398268398 | -10.1683982683983 |
| 8 | 573 | 589.168398268398 | -16.1683982683982 |
| 9 | 567 | 577.968398268398 | -10.9683982683983 |
| 10 | 569 | 580.168398268398 | -11.1683982683982 |
| 11 | 621 | 631.368398268398 | -10.3683982683982 |
| 12 | 629 | 639.368398268398 | -10.3683982683982 |
| 13 | 628 | 611.639393939394 | 16.3606060606063 |
| 14 | 612 | 588.527705627706 | 23.4722943722944 |
| 15 | 595 | 573.127705627706 | 21.8722943722944 |
| 16 | 597 | 575.527705627706 | 21.4722943722944 |
| 17 | 593 | 577.727705627706 | 15.2722943722944 |
| 18 | 590 | 573.527705627706 | 16.4722943722944 |
| 19 | 580 | 564.727705627706 | 15.2722943722944 |
| 20 | 574 | 559.727705627706 | 14.2722943722944 |
| 21 | 573 | 548.527705627706 | 24.4722943722944 |
| 22 | 573 | 550.727705627706 | 22.2722943722944 |
| 23 | 620 | 601.927705627706 | 18.0722943722944 |
| 24 | 626 | 609.927705627706 | 16.0722943722944 |
| 25 | 620 | 582.198701298701 | 37.8012987012989 |
| 26 | 588 | 559.087012987013 | 28.912987012987 |
| 27 | 566 | 543.687012987013 | 22.3129870129870 |
| 28 | 557 | 546.087012987013 | 10.9129870129870 |
| 29 | 561 | 548.287012987013 | 12.7129870129870 |
| 30 | 549 | 544.087012987013 | 4.91298701298698 |
| 31 | 532 | 535.287012987013 | -3.28701298701298 |
| 32 | 526 | 530.287012987013 | -4.28701298701298 |
| 33 | 511 | 519.087012987013 | -8.08701298701298 |
| 34 | 499 | 521.287012987013 | -22.287012987013 |
| 35 | 555 | 572.487012987013 | -17.487012987013 |
| 36 | 565 | 580.487012987013 | -15.4870129870130 |
| 37 | 542 | 552.758008658009 | -10.7580086580085 |
| 38 | 527 | 529.64632034632 | -2.64632034632037 |
| 39 | 510 | 514.24632034632 | -4.24632034632038 |
| 40 | 514 | 516.64632034632 | -2.64632034632038 |
| 41 | 517 | 518.84632034632 | -1.84632034632040 |
| 42 | 508 | 514.64632034632 | -6.64632034632039 |
| 43 | 493 | 505.84632034632 | -12.8463203463204 |
| 44 | 490 | 500.84632034632 | -10.8463203463204 |
| 45 | 469 | 489.64632034632 | -20.6463203463204 |
| 46 | 478 | 491.84632034632 | -13.8463203463204 |
| 47 | 528 | 543.04632034632 | -15.0463203463204 |
| 48 | 534 | 551.04632034632 | -17.0463203463204 |
| 49 | 518 | 571.882251082251 | -53.8822510822509 |
| 50 | 506 | 548.770562770563 | -42.7705627705628 |
| 51 | 502 | 533.370562770563 | -31.3705627705628 |
| 52 | 516 | 535.770562770563 | -19.7705627705628 |
| 53 | 528 | 537.970562770563 | -9.97056277056282 |
| 54 | 533 | 533.770562770563 | -0.770562770562831 |
| 55 | 536 | 524.970562770563 | 11.0294372294372 |
| 56 | 537 | 519.970562770563 | 17.0294372294372 |
| 57 | 524 | 508.770562770563 | 15.2294372294372 |
| 58 | 536 | 510.970562770563 | 25.0294372294372 |
| 59 | 587 | 562.170562770563 | 24.8294372294372 |
| 60 | 597 | 570.170562770563 | 26.8294372294372 |
| 61 | 581 | 542.441558441558 | 38.5584415584417 |
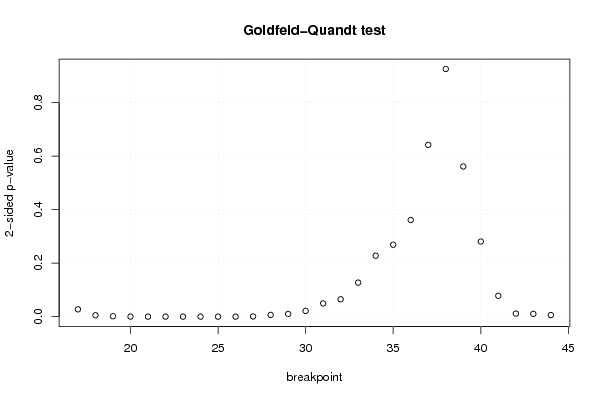
| Goldfeld-Quandt test for Heteroskedasticity | |||
| p-values | Alternative Hypothesis | ||
| breakpoint index | greater | 2-sided | less |
| 17 | 0.0137069167720528 | 0.0274138335441056 | 0.986293083227947 |
| 18 | 0.00261418502913884 | 0.00522837005827768 | 0.997385814970861 |
| 19 | 0.000810416712025571 | 0.00162083342405114 | 0.999189583287974 |
| 20 | 0.000136107809728030 | 0.000272215619456059 | 0.999863892190272 |
| 21 | 2.52444453492562e-05 | 5.04888906985124e-05 | 0.99997475555465 |
| 22 | 3.7787626663723e-06 | 7.5575253327446e-06 | 0.999996221237334 |
| 23 | 6.65012551220894e-07 | 1.33002510244179e-06 | 0.999999334987449 |
| 24 | 1.49629717717385e-07 | 2.99259435434771e-07 | 0.999999850370282 |
| 25 | 4.33471352725046e-08 | 8.66942705450092e-08 | 0.999999956652865 |
| 26 | 2.30758647195019e-05 | 4.61517294390037e-05 | 0.99997692413528 |
| 27 | 0.000345163769839914 | 0.000690327539679827 | 0.99965483623016 |
| 28 | 0.00328170832464049 | 0.00656341664928098 | 0.99671829167536 |
| 29 | 0.00507032033222853 | 0.0101406406644571 | 0.994929679667771 |
| 30 | 0.0107371342954134 | 0.0214742685908267 | 0.989262865704587 |
| 31 | 0.0247357870158941 | 0.0494715740317882 | 0.975264212984106 |
| 32 | 0.0324432626105482 | 0.0648865252210964 | 0.967556737389452 |
| 33 | 0.0635857058247206 | 0.127171411649441 | 0.93641429417528 |
| 34 | 0.113816586300741 | 0.227633172601482 | 0.886183413699259 |
| 35 | 0.134418845234776 | 0.268837690469553 | 0.865581154765223 |
| 36 | 0.180556880102299 | 0.361113760204599 | 0.8194431198977 |
| 37 | 0.320985646536842 | 0.641971293073685 | 0.679014353463158 |
| 38 | 0.537250724376461 | 0.925498551247077 | 0.462749275623539 |
| 39 | 0.719449073784487 | 0.561101852431027 | 0.280550926215513 |
| 40 | 0.859676155455267 | 0.280647689089466 | 0.140323844544733 |
| 41 | 0.960994273147536 | 0.0780114537049287 | 0.0390057268524644 |
| 42 | 0.994378350869577 | 0.0112432982608458 | 0.0056216491304229 |
| 43 | 0.994780563880792 | 0.010438872238416 | 0.005219436119208 |
| 44 | 0.997165062396721 | 0.00566987520655767 | 0.00283493760327884 |
| Meta Analysis of Goldfeld-Quandt test for Heteroskedasticity | |||
| Description | # significant tests | % significant tests | OK/NOK |
| 1% type I error level | 12 | 0.428571428571429 | NOK |
| 5% type I error level | 18 | 0.642857142857143 | NOK |
| 10% type I error level | 20 | 0.714285714285714 | NOK |