| Multiple Linear Regression - Estimated Regression Equation |
| Voeding-Mannen[t] = + 6.54533119810063 + 2.51210820360028`Landbouw-Mannen`[t] -4.28395794774435t + e[t] |
| Multiple Linear Regression - Ordinary Least Squares | |||||
| Variable | Parameter | S.D. | T-STAT H0: parameter = 0 | 2-tail p-value | 1-tail p-value |
| (Intercept) | 6.54533119810063 | 424.857623 | 0.0154 | 0.987762 | 0.493881 |
| `Landbouw-Mannen` | 2.51210820360028 | 0.152871 | 16.4329 | 0 | 0 |
| t | -4.28395794774435 | 1.53039 | -2.7993 | 0.006978 | 0.003489 |
| Multiple Linear Regression - Regression Statistics | |
| Multiple R | 0.939720653731274 |
| R-squared | 0.883074907049133 |
| Adjusted R-squared | 0.878972272208752 |
| F-TEST (value) | 215.245797251373 |
| F-TEST (DF numerator) | 2 |
| F-TEST (DF denominator) | 57 |
| p-value | 0 |
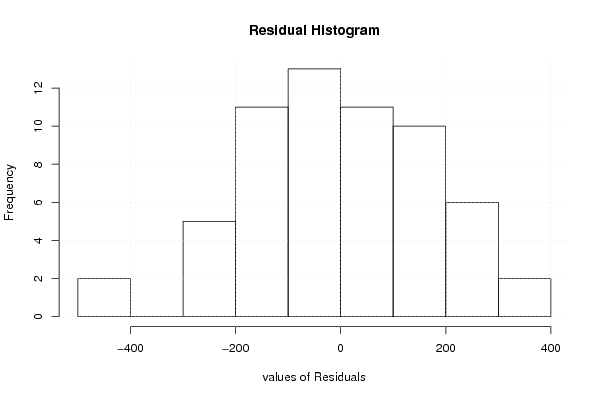
| Multiple Linear Regression - Residual Statistics | |
| Residual Standard Deviation | 178.018571346665 |
| Sum Squared Residuals | 1806364.86942554 |
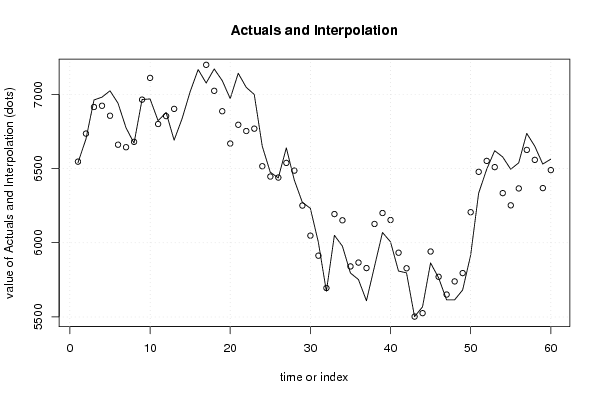
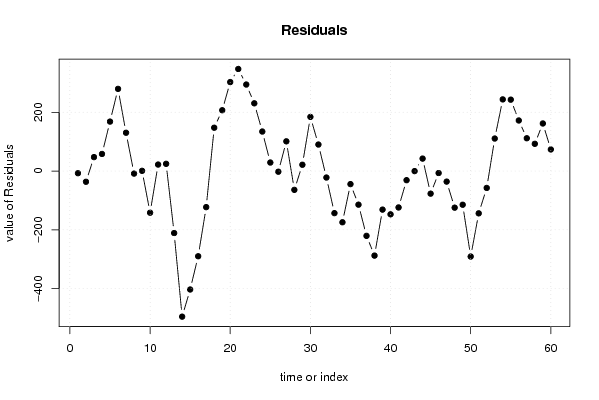
| Multiple Linear Regression - Actuals, Interpolation, and Residuals | |||
| Time or Index | Actuals | Interpolation Forecast | Residuals Prediction Error |
| 1 | 6539 | 6546.30324362909 | -7.30324362908535 |
| 2 | 6699 | 6735.45161735855 | -36.4516173585529 |
| 3 | 6962 | 6914.55155827363 | 47.4484417263707 |
| 4 | 6981 | 6922.82814134389 | 58.1718586561135 |
| 5 | 7024 | 6855.74147830613 | 168.258521693865 |
| 6 | 6940 | 6660.53729688477 | 279.46270311523 |
| 7 | 6774 | 6643.69279791902 | 130.307202080976 |
| 8 | 6671 | 6679.60257122888 | -8.60257122888425 |
| 9 | 6965 | 6964.21105669517 | 0.78894330482837 |
| 10 | 6969 | 7110.65359096344 | -141.653590963444 |
| 11 | 6822 | 6799.89243217647 | 22.1075678235342 |
| 12 | 6878 | 6853.38696291153 | 24.6130370884722 |
| 13 | 6691 | 6901.85727723939 | -210.857277239389 |
| 14 | 6837 | 7332.16803851449 | -495.168038514493 |
| 15 | 7018 | 7420.83208409996 | -402.832084099958 |
| 16 | 7167 | 7456.74185740982 | -289.741857409818 |
| 17 | 7076 | 7198.73497089845 | -122.734970898446 |
| 18 | 7171 | 7023.62765510588 | 147.372344894117 |
| 19 | 7093 | 6886.20196236732 | 206.798037632676 |
| 20 | 6971 | 6668.38880711356 | 302.611192886444 |
| 21 | 7142 | 6794.73447575303 | 347.265524246974 |
| 22 | 7047 | 6752.76889475128 | 294.231105248722 |
| 23 | 6999 | 6768.58180243234 | 230.418197567664 |
| 24 | 6650 | 6515.59913232816 | 134.400867671836 |
| 25 | 6475 | 6446.00036108681 | 28.9996389131874 |
| 26 | 6437 | 6439.20429493547 | -2.20429493546798 |
| 27 | 6639 | 6537.91677333534 | 101.083226664665 |
| 28 | 6422 | 6485.90275951919 | -63.9027595191853 |
| 29 | 6272 | 6250.50484684022 | 21.4951531597844 |
| 30 | 6232 | 6047.76434080805 | 184.235659191950 |
| 31 | 6003 | 5912.85075627309 | 90.1492437269093 |
| 32 | 5673 | 5695.03760101932 | -22.0376010193231 |
| 33 | 6050 | 6193.17528379163 | -143.175283791634 |
| 34 | 5977 | 6151.20970278989 | -174.209702789885 |
| 35 | 5796 | 5840.44854400291 | -44.4485440029074 |
| 36 | 5752 | 5866.30988449837 | -114.309884498366 |
| 37 | 5609 | 5829.36851990382 | -220.368519903818 |
| 38 | 5839 | 6126.53754638811 | -287.537546388107 |
| 39 | 6069 | 6200.12894275197 | -131.128942751971 |
| 40 | 6006 | 6153.13914534302 | -147.139145343022 |
| 41 | 5809 | 5932.81388188565 | -123.813881885654 |
| 42 | 5797 | 5828.0455957939 | -31.0455957938987 |
| 43 | 5502 | 5502.21178778532 | -0.211787785319172 |
| 44 | 5568 | 5525.56102007718 | 42.4389799228221 |
| 45 | 5864 | 5940.79913213068 | -76.7991321306796 |
| 46 | 5764 | 5770.71603274532 | -6.716032745317 |
| 47 | 5615 | 5650.87509743196 | -35.87509743196 |
| 48 | 5615 | 5739.53914301743 | -124.539143017426 |
| 49 | 5681 | 5795.54578195609 | -114.545781956088 |
| 50 | 5915 | 6205.75967760239 | -290.759677602389 |
| 51 | 6334 | 6477.80762205068 | -143.807622050675 |
| 52 | 6494 | 6551.39901841454 | -57.3990184145393 |
| 53 | 6620 | 6509.43343741279 | 110.566562587209 |
| 54 | 6578 | 6334.32612162023 | 243.673878379772 |
| 55 | 6495 | 6252.16680936088 | 242.833190639125 |
| 56 | 6538 | 6365.95193698234 | 172.048063017657 |
| 57 | 6737 | 6625.43934041263 | 111.560659587372 |
| 58 | 6651 | 6558.35267737488 | 92.6473226251232 |
| 59 | 6530 | 6368.17271236071 | 161.827287639288 |
| 60 | 6563 | 6489.49416459298 | 73.5058354070185 |
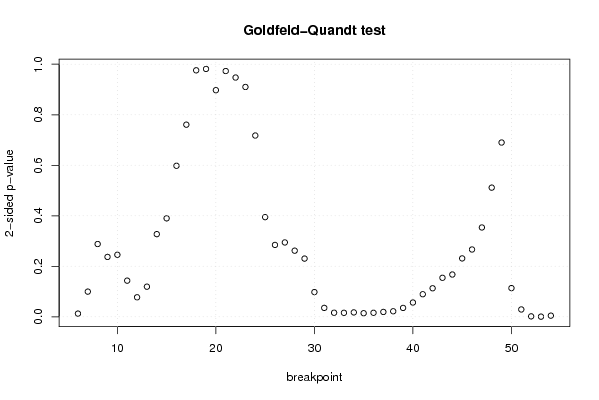
| Goldfeld-Quandt test for Heteroskedasticity | |||
| p-values | Alternative Hypothesis | ||
| breakpoint index | greater | 2-sided | less |
| 6 | 0.00633335128705453 | 0.0126667025741091 | 0.993666648712946 |
| 7 | 0.049844599387581 | 0.099689198775162 | 0.95015540061242 |
| 8 | 0.144077605761914 | 0.288155211523827 | 0.855922394238086 |
| 9 | 0.118576212878858 | 0.237152425757717 | 0.881423787121142 |
| 10 | 0.122826847046683 | 0.245653694093367 | 0.877173152953317 |
| 11 | 0.071571717240458 | 0.143143434480916 | 0.928428282759542 |
| 12 | 0.0386343273887098 | 0.0772686547774196 | 0.96136567261129 |
| 13 | 0.059640566711467 | 0.119281133422934 | 0.940359433288533 |
| 14 | 0.163637569718206 | 0.327275139436412 | 0.836362430281794 |
| 15 | 0.194943321343064 | 0.389886642686128 | 0.805056678656936 |
| 16 | 0.298981657799771 | 0.597963315599542 | 0.701018342200229 |
| 17 | 0.380338518823702 | 0.760677037647404 | 0.619661481176298 |
| 18 | 0.512033153172769 | 0.975933693654461 | 0.487966846827231 |
| 19 | 0.490665408611171 | 0.981330817222343 | 0.509334591388829 |
| 20 | 0.448617288177768 | 0.897234576355536 | 0.551382711822232 |
| 21 | 0.486497005608032 | 0.972994011216064 | 0.513502994391968 |
| 22 | 0.473630910235558 | 0.947261820471116 | 0.526369089764442 |
| 23 | 0.4549968726462 | 0.9099937452924 | 0.5450031273538 |
| 24 | 0.641132568649298 | 0.717734862701404 | 0.358867431350702 |
| 25 | 0.802695328563728 | 0.394609342872543 | 0.197304671436272 |
| 26 | 0.857735946344082 | 0.284528107311835 | 0.142264053655918 |
| 27 | 0.852793104037024 | 0.294413791925952 | 0.147206895962976 |
| 28 | 0.869095578555243 | 0.261808842889515 | 0.130904421444757 |
| 29 | 0.884767303423417 | 0.230465393153166 | 0.115232696576583 |
| 30 | 0.951079868888939 | 0.0978402622221222 | 0.0489201311110611 |
| 31 | 0.982359721681782 | 0.0352805566364367 | 0.0176402783182183 |
| 32 | 0.991966497908987 | 0.0160670041820254 | 0.00803350209101268 |
| 33 | 0.99209814370869 | 0.0158037125826217 | 0.00790185629131086 |
| 34 | 0.99130289061734 | 0.0173942187653208 | 0.0086971093826604 |
| 35 | 0.992893202977424 | 0.0142135940451523 | 0.00710679702257615 |
| 36 | 0.992059397470324 | 0.0158812050593521 | 0.00794060252967606 |
| 37 | 0.990347551444744 | 0.0193048971105116 | 0.00965244855525581 |
| 38 | 0.989030940084929 | 0.0219381198301421 | 0.0109690599150711 |
| 39 | 0.982449737447855 | 0.0351005251042903 | 0.0175502625521452 |
| 40 | 0.971722218271642 | 0.0565555634567155 | 0.0282777817283577 |
| 41 | 0.955283401375438 | 0.0894331972491234 | 0.0447165986245617 |
| 42 | 0.943523610470454 | 0.112952779059092 | 0.0564763895295459 |
| 43 | 0.922786178738778 | 0.154427642522443 | 0.0772138212612217 |
| 44 | 0.916289248134392 | 0.167421503731216 | 0.0837107518656078 |
| 45 | 0.884377634541509 | 0.231244730916983 | 0.115622365458491 |
| 46 | 0.866735931978085 | 0.266528136043830 | 0.133264068021915 |
| 47 | 0.82317054284519 | 0.353658914309619 | 0.176829457154809 |
| 48 | 0.74430219744517 | 0.51139560510966 | 0.25569780255483 |
| 49 | 0.654998739126425 | 0.69000252174715 | 0.345001260873575 |
| 50 | 0.943203039223099 | 0.113593921553801 | 0.0567969607769006 |
| 51 | 0.985445489751702 | 0.0291090204965961 | 0.0145545102482981 |
| 52 | 0.999153230437504 | 0.00169353912499198 | 0.000846769562495989 |
| 53 | 0.999701702759173 | 0.000596594481652893 | 0.000298297240826446 |
| 54 | 0.997713345237353 | 0.00457330952529497 | 0.00228665476264749 |
| Meta Analysis of Goldfeld-Quandt test for Heteroskedasticity | |||
| Description | # significant tests | % significant tests | OK/NOK |
| 1% type I error level | 3 | 0.0612244897959184 | NOK |
| 5% type I error level | 14 | 0.285714285714286 | NOK |
| 10% type I error level | 19 | 0.387755102040816 | NOK |