| Multiple Linear Regression - Estimated Regression Equation |
| Y[t] = + 633.895997338495 + 0.00669906119430542X[t] + 0.656397458381625Y1[t] -0.0466774298093399Y2[t] -0.0549640904534444Y3[t] -0.0357103741220868Y4[t] + 37.8694134566582M1[t] + 156.142482881967M2[t] + 295.305233485109M3[t] + 437.323832062408M4[t] + 588.831879163271M5[t] + 736.098639832787M6[t] + 890.325206224805M7[t] + 1078.14615314873M8[t] -2425.28631966955M9[t] + 83.7658990470096M10[t] + 65.1693704083077M11[t] + 4.86711279747431t + e[t] |
| Multiple Linear Regression - Ordinary Least Squares | |||||
| Variable | Parameter | S.D. | T-STAT H0: parameter = 0 | 2-tail p-value | 1-tail p-value |
| (Intercept) | 633.895997338495 | 540.000071 | 1.1739 | 0.247747 | 0.123874 |
| X | 0.00669906119430542 | 0.01108 | 0.6046 | 0.549036 | 0.274518 |
| Y1 | 0.656397458381625 | 0.163511 | 4.0144 | 0.000271 | 0.000135 |
| Y2 | -0.0466774298093399 | 0.194883 | -0.2395 | 0.811993 | 0.405996 |
| Y3 | -0.0549640904534444 | 0.194595 | -0.2825 | 0.779128 | 0.389564 |
| Y4 | -0.0357103741220868 | 0.15857 | -0.2252 | 0.823028 | 0.411514 |
| M1 | 37.8694134566582 | 552.399222 | 0.0686 | 0.945704 | 0.472852 |
| M2 | 156.142482881967 | 541.025196 | 0.2886 | 0.774452 | 0.387226 |
| M3 | 295.305233485109 | 531.179177 | 0.5559 | 0.581509 | 0.290754 |
| M4 | 437.323832062408 | 533.546023 | 0.8197 | 0.417524 | 0.208762 |
| M5 | 588.831879163271 | 533.396365 | 1.1039 | 0.276565 | 0.138283 |
| M6 | 736.098639832787 | 541.397555 | 1.3596 | 0.181962 | 0.090981 |
| M7 | 890.325206224805 | 552.074384 | 1.6127 | 0.115087 | 0.057544 |
| M8 | 1078.14615314873 | 568.47264 | 1.8966 | 0.065506 | 0.032753 |
| M9 | -2425.28631966955 | 586.559103 | -4.1348 | 0.000189 | 9.4e-05 |
| M10 | 83.7658990470096 | 706.011076 | 0.1186 | 0.90618 | 0.45309 |
| M11 | 65.1693704083077 | 704.191604 | 0.0925 | 0.926751 | 0.463376 |
| t | 4.86711279747431 | 1.534478 | 3.1718 | 0.002994 | 0.001497 |
| Multiple Linear Regression - Regression Statistics | |
| Multiple R | 0.998836388403883 |
| R-squared | 0.997674130799712 |
| Adjusted R-squared | 0.996633610368004 |
| F-TEST (value) | 958.82223971542 |
| F-TEST (DF numerator) | 17 |
| F-TEST (DF denominator) | 38 |
| p-value | 0 |
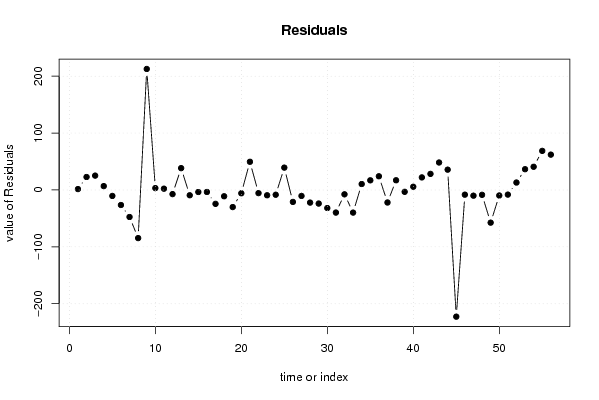
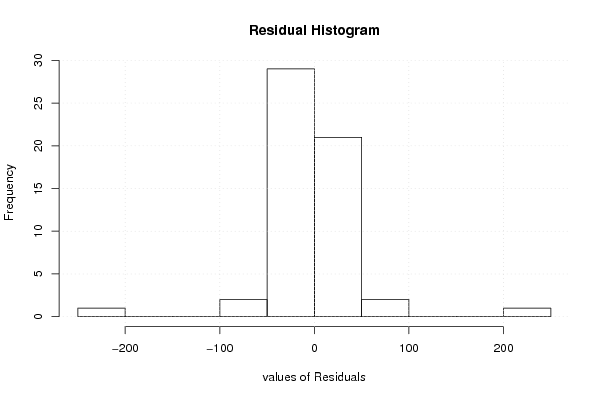
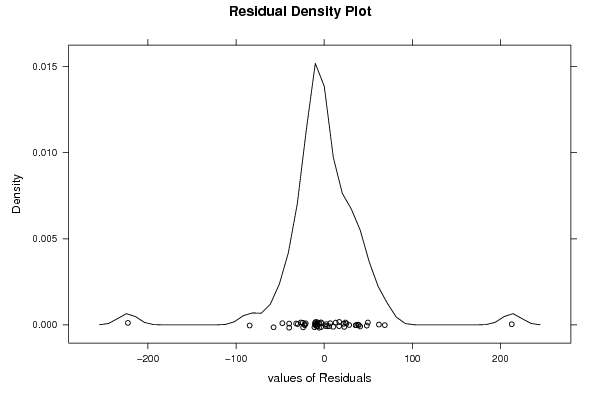
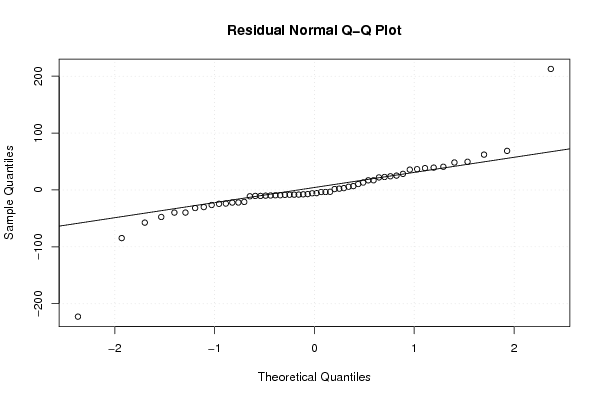
| Multiple Linear Regression - Residual Statistics | |
| Residual Standard Deviation | 61.0872216019478 |
| Sum Squared Residuals | 141802.648435728 |
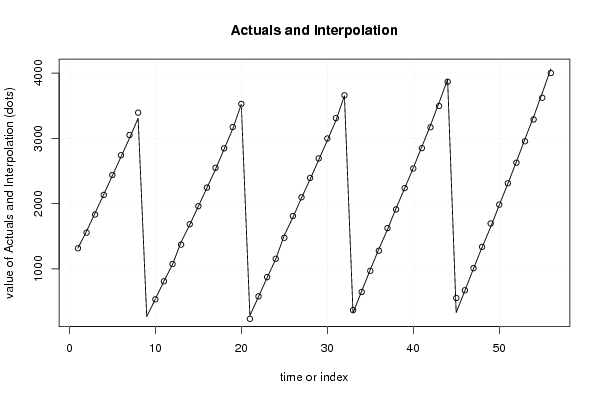
| Multiple Linear Regression - Actuals, Interpolation, and Residuals | |||
| Time or Index | Actuals | Interpolation Forecast | Residuals Prediction Error |
| 1 | 1318 | 1316.35488911912 | 1.64511088087917 |
| 2 | 1578 | 1555.13733994116 | 22.8626600588374 |
| 3 | 1859 | 1833.73503776466 | 25.2649622353445 |
| 4 | 2141 | 2134.17367241593 | 6.82632758406626 |
| 5 | 2428 | 2438.44272337777 | -10.4427233777739 |
| 6 | 2715 | 2741.38488138103 | -26.3848813810282 |
| 7 | 3004 | 3051.43430984211 | -47.4343098421122 |
| 8 | 3309 | 3393.56153591642 | -84.5615359164223 |
| 9 | 269 | 56.1797826823087 | 212.820217317691 |
| 10 | 537 | 533.697906786367 | 3.30209321363307 |
| 11 | 813 | 810.698050702226 | 2.30194929777444 |
| 12 | 1068 | 1075.21761598108 | -7.21761598107972 |
| 13 | 1411 | 1372.58550116861 | 38.4144988313882 |
| 14 | 1675 | 1684.30048745818 | -9.3004874581777 |
| 15 | 1958 | 1961.54274234898 | -3.54274234898012 |
| 16 | 2242 | 2245.49324368938 | -3.49324368937669 |
| 17 | 2524 | 2548.35658529563 | -24.3565852956338 |
| 18 | 2836 | 2847.05431784009 | -11.0543178400900 |
| 19 | 3143 | 3173.00299984029 | -30.0029998402896 |
| 20 | 3522 | 3527.77719252433 | -5.77719252433067 |
| 21 | 285 | 235.392323008476 | 49.607676991524 |
| 22 | 574 | 579.516629467582 | -5.51662946758245 |
| 23 | 865 | 874.304111848152 | -9.30411184815186 |
| 24 | 1147 | 1155.35894339907 | -8.35894339906818 |
| 25 | 1516 | 1476.67514986460 | 39.3248501353964 |
| 26 | 1789 | 1809.98406850642 | -20.9840685064161 |
| 27 | 2087 | 2097.41694795355 | -10.4169479535464 |
| 28 | 2372 | 2394.13446423062 | -22.1344642306232 |
| 29 | 2669 | 2692.86466895153 | -23.8646689515327 |
| 30 | 2966 | 2997.75727575969 | -31.7572757596936 |
| 31 | 3270 | 3309.69531748239 | -39.6953174823864 |
| 32 | 3652 | 3659.59369241783 | -7.59369241783452 |
| 33 | 329 | 368.729276295068 | -39.7292762950684 |
| 34 | 658 | 647.558435010314 | 10.4415649896860 |
| 35 | 988 | 971.017529466067 | 16.9824705339327 |
| 36 | 1303 | 1278.89715940582 | 24.1028405941785 |
| 37 | 1603 | 1624.97282375311 | -21.9728237531087 |
| 38 | 1929 | 1911.91748199048 | 17.0825180095211 |
| 39 | 2235 | 2238.19318371312 | -3.19318371312122 |
| 40 | 2544 | 2538.27893929193 | 5.72106070806572 |
| 41 | 2872 | 2849.89696893166 | 22.1030310683432 |
| 42 | 3198 | 3169.65546054025 | 28.3445394597490 |
| 43 | 3544 | 3495.64117838291 | 48.3588216170918 |
| 44 | 3903 | 3867.23753945419 | 35.7624605458114 |
| 45 | 332 | 554.698618014147 | -222.698618014147 |
| 46 | 665 | 673.227028735737 | -8.2270287357366 |
| 47 | 1001 | 1010.98030798356 | -9.9803079835553 |
| 48 | 1329 | 1337.52628121403 | -8.52628121403101 |
| 49 | 1639 | 1696.41163609455 | -57.411636094555 |
| 50 | 1975 | 1984.66062210376 | -9.66062210376465 |
| 51 | 2304 | 2312.11208821970 | -8.11208821969641 |
| 52 | 2640 | 2626.91968037213 | 13.0803196278679 |
| 53 | 2992 | 2955.4390534434 | 36.5609465565971 |
| 54 | 3330 | 3289.14806447894 | 40.8519355210629 |
| 55 | 3690 | 3621.22619445230 | 68.7738055476964 |
| 56 | 4063 | 4000.83003968722 | 62.1699603127762 |
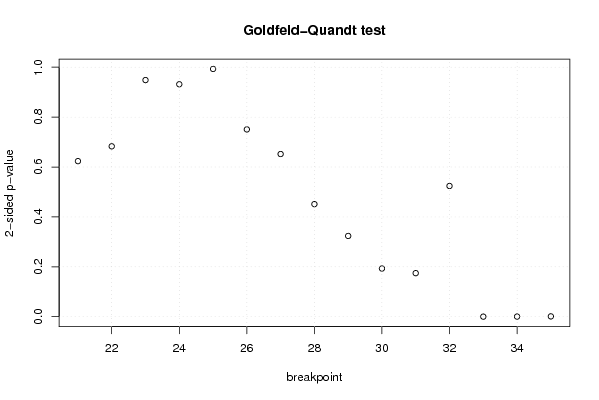
| Goldfeld-Quandt test for Heteroskedasticity | |||
| p-values | Alternative Hypothesis | ||
| breakpoint index | greater | 2-sided | less |
| 21 | 0.688204193348966 | 0.623591613302068 | 0.311795806651034 |
| 22 | 0.65850971923646 | 0.68298056152708 | 0.34149028076354 |
| 23 | 0.525704441123929 | 0.948591117752142 | 0.474295558876071 |
| 24 | 0.465882898069605 | 0.93176579613921 | 0.534117101930395 |
| 25 | 0.503415399790467 | 0.993169200419067 | 0.496584600209533 |
| 26 | 0.37537134814842 | 0.75074269629684 | 0.62462865185158 |
| 27 | 0.325985426142605 | 0.65197085228521 | 0.674014573857395 |
| 28 | 0.225590843439161 | 0.451181686878323 | 0.774409156560839 |
| 29 | 0.16177392476659 | 0.32354784953318 | 0.83822607523341 |
| 30 | 0.0965017037100377 | 0.193003407420075 | 0.903498296289962 |
| 31 | 0.0872139515837148 | 0.174427903167430 | 0.912786048416285 |
| 32 | 0.261942791266143 | 0.523885582532287 | 0.738057208733857 |
| 33 | 0.999986424780777 | 2.71504384454100e-05 | 1.35752192227050e-05 |
| 34 | 0.999872363694189 | 0.000255272611622119 | 0.000127636305811059 |
| 35 | 0.999441940340965 | 0.00111611931806926 | 0.000558059659034632 |
| Meta Analysis of Goldfeld-Quandt test for Heteroskedasticity | |||
| Description | # significant tests | % significant tests | OK/NOK |
| 1% type I error level | 3 | 0.2 | NOK |
| 5% type I error level | 3 | 0.2 | NOK |
| 10% type I error level | 3 | 0.2 | NOK |