Free Statistics

of Irreproducible Research!

Author's title

Author*The author of this computation has been verified*
R Software Modulerwasp_multipleregression.wasp
Title produced by softwareMultiple Regression
Date of computationFri, 20 Nov 2009 07:00:11 -0700
Cite this page as followsStatistical Computations at FreeStatistics.org, Office for Research Development and Education, URL https://freestatistics.org/blog/index.php?v=date/2009/Nov/20/t125872574307bpfiu7s1fvuea.htm/, Retrieved Tue, 16 Apr 2024 20:38:40 +0000
Statistical Computations at FreeStatistics.org, Office for Research Development and Education, URL https://freestatistics.org/blog/index.php?pk=58168, Retrieved Tue, 16 Apr 2024 20:38:40 +0000
QR Codes:

Original text written by user:
IsPrivate?No (this computation is public)
User-defined keywords
Estimated Impact147
Family? (F = Feedback message, R = changed R code, M = changed R Module, P = changed Parameters, D = changed Data)
-     [Multiple Regression] [Q1 The Seatbeltlaw] [2007-11-14 19:27:43] [8cd6641b921d30ebe00b648d1481bba0]
- RM D  [Multiple Regression] [Seatbelt] [2009-11-12 14:10:54] [b98453cac15ba1066b407e146608df68]
-   PD      [Multiple Regression] [] [2009-11-20 14:00:11] [c88a5f1b97e332c6387d668c465455af] [Current]
Feedback Forum

Post a new message
Dataseries X:
1318	1427	1081	831	557	280
1578	934	1318	1081	831	557
1859	709	1578	1318	1081	831
2141	1186	1859	1578	1318	1081
2428	986	2141	1859	1578	1318
2715	1033	2428	2141	1859	1578
3004	1257	2715	2428	2141	1859
3309	1105	3004	2715	2428	2141
269	1179	3309	3004	2715	2428
537	1092	269	3309	3004	2715
813	1092	537	269	3309	3004
1068	1087	813	537	269	3309
1411	2028	1068	813	537	269
1675	2039	1411	1068	813	537
1958	2010	1675	1411	1068	813
2242	754	1958	1675	1411	1068
2524	760	2242	1958	1675	1411
2836	715	2524	2242	1958	1675
3143	855	2836	2524	2242	1958
3522	971	3143	2836	2524	2242
285	815	3522	3143	2836	2524
574	915	285	3522	3143	2836
865	843	574	285	3522	3143
1147	761	865	574	285	3522
1516	1858	1147	865	574	285
1789	2968	1516	1147	865	574
2087	4061	1789	1516	1147	865
2372	3661	2087	1789	1516	1147
2669	3269	2372	2087	1789	1516
2966	2857	2669	2372	2087	1789
3270	2568	2966	2669	2372	2087
3652	2274	3270	2966	2669	2372
329	1987	3652	3270	2966	2669
658	683	329	3652	3270	2966
988	381	658	329	3652	3270
1303	71	988	658	329	3652
1603	1772	1303	988	658	329
1929	3485	1603	1303	988	658
2235	5181	1929	1603	1303	988
2544	4479	2235	1929	1603	1303
2872	3782	2544	2235	1929	1603
3198	3067	2872	2544	2235	1929
3544	2489	3198	2872	2544	2235
3903	1903	3544	3198	2872	2544
332	1330	3903	3544	3198	2872
665	736	332	3903	3544	3198
1001	483	665	332	3903	3544
1329	242	1001	665	332	3903
1639	1334	1329	1001	665	332
1975	2423	1639	1329	1001	665
2304	3523	1975	1639	1329	1001
2640	2986	2304	1975	1639	1329
2992	2462	2640	2304	1975	1639
3330	1908	2992	2640	2304	1975
3690	1575	3330	2992	2640	2304
4063	1237	3690	3330	2992	2640


Summary of computational transaction
Raw Inputview raw input (R code)
Raw Outputview raw output of R engine
Computing time3 seconds
R Server'Gwilym Jenkins' @ 72.249.127.135

\begin{tabular}{lllllllll}
\hline
Summary of computational transaction \tabularnewline
Raw Input & view raw input (R code)  \tabularnewline
Raw Output & view raw output of R engine  \tabularnewline
Computing time & 3 seconds \tabularnewline
R Server & 'Gwilym Jenkins' @ 72.249.127.135 \tabularnewline
\hline
\end{tabular}
%Source: https://freestatistics.org/blog/index.php?pk=58168&T=0

[TABLE]
[ROW][C]Summary of computational transaction[/C][/ROW]
[ROW][C]Raw Input[/C][C]view raw input (R code) [/C][/ROW]
[ROW][C]Raw Output[/C][C]view raw output of R engine [/C][/ROW]
[ROW][C]Computing time[/C][C]3 seconds[/C][/ROW]
[ROW][C]R Server[/C][C]'Gwilym Jenkins' @ 72.249.127.135[/C][/ROW]
[/TABLE]
Source: https://freestatistics.org/blog/index.php?pk=58168&T=0

Globally Unique Identifier (entire table): ba.freestatistics.org/blog/index.php?pk=58168&T=0

As an alternative you can also use a QR Code:  

The GUIDs for individual cells are displayed in the table below:

Summary of computational transaction
Raw Inputview raw input (R code)
Raw Outputview raw output of R engine
Computing time3 seconds
R Server'Gwilym Jenkins' @ 72.249.127.135


Multiple Linear Regression - Estimated Regression Equation
Y[t] = + 633.895997338495 + 0.00669906119430542X[t] + 0.656397458381625Y1[t] -0.0466774298093399Y2[t] -0.0549640904534444Y3[t] -0.0357103741220868Y4[t] + 37.8694134566582M1[t] + 156.142482881967M2[t] + 295.305233485109M3[t] + 437.323832062408M4[t] + 588.831879163271M5[t] + 736.098639832787M6[t] + 890.325206224805M7[t] + 1078.14615314873M8[t] -2425.28631966955M9[t] + 83.7658990470096M10[t] + 65.1693704083077M11[t] + 4.86711279747431t + e[t]

\begin{tabular}{lllllllll}
\hline
Multiple Linear Regression - Estimated Regression Equation \tabularnewline
Y[t] =  +  633.895997338495 +  0.00669906119430542X[t] +  0.656397458381625Y1[t] -0.0466774298093399Y2[t] -0.0549640904534444Y3[t] -0.0357103741220868Y4[t] +  37.8694134566582M1[t] +  156.142482881967M2[t] +  295.305233485109M3[t] +  437.323832062408M4[t] +  588.831879163271M5[t] +  736.098639832787M6[t] +  890.325206224805M7[t] +  1078.14615314873M8[t] -2425.28631966955M9[t] +  83.7658990470096M10[t] +  65.1693704083077M11[t] +  4.86711279747431t  + e[t] \tabularnewline
\hline
\end{tabular}
%Source: https://freestatistics.org/blog/index.php?pk=58168&T=1

[TABLE]
[ROW][C]Multiple Linear Regression - Estimated Regression Equation[/C][/ROW]
[ROW][C]Y[t] =  +  633.895997338495 +  0.00669906119430542X[t] +  0.656397458381625Y1[t] -0.0466774298093399Y2[t] -0.0549640904534444Y3[t] -0.0357103741220868Y4[t] +  37.8694134566582M1[t] +  156.142482881967M2[t] +  295.305233485109M3[t] +  437.323832062408M4[t] +  588.831879163271M5[t] +  736.098639832787M6[t] +  890.325206224805M7[t] +  1078.14615314873M8[t] -2425.28631966955M9[t] +  83.7658990470096M10[t] +  65.1693704083077M11[t] +  4.86711279747431t  + e[t][/C][/ROW]
[/TABLE]
Source: https://freestatistics.org/blog/index.php?pk=58168&T=1

Globally Unique Identifier (entire table): ba.freestatistics.org/blog/index.php?pk=58168&T=1

As an alternative you can also use a QR Code:  

The GUIDs for individual cells are displayed in the table below:

Multiple Linear Regression - Estimated Regression Equation
Y[t] = + 633.895997338495 + 0.00669906119430542X[t] + 0.656397458381625Y1[t] -0.0466774298093399Y2[t] -0.0549640904534444Y3[t] -0.0357103741220868Y4[t] + 37.8694134566582M1[t] + 156.142482881967M2[t] + 295.305233485109M3[t] + 437.323832062408M4[t] + 588.831879163271M5[t] + 736.098639832787M6[t] + 890.325206224805M7[t] + 1078.14615314873M8[t] -2425.28631966955M9[t] + 83.7658990470096M10[t] + 65.1693704083077M11[t] + 4.86711279747431t + e[t]


Multiple Linear Regression - Ordinary Least Squares
VariableParameterS.D.T-STATH0: parameter = 02-tail p-value1-tail p-value
(Intercept)633.895997338495540.0000711.17390.2477470.123874
X0.006699061194305420.011080.60460.5490360.274518
Y10.6563974583816250.1635114.01440.0002710.000135
Y2-0.04667742980933990.194883-0.23950.8119930.405996
Y3-0.05496409045344440.194595-0.28250.7791280.389564
Y4-0.03571037412208680.15857-0.22520.8230280.411514
M137.8694134566582552.3992220.06860.9457040.472852
M2156.142482881967541.0251960.28860.7744520.387226
M3295.305233485109531.1791770.55590.5815090.290754
M4437.323832062408533.5460230.81970.4175240.208762
M5588.831879163271533.3963651.10390.2765650.138283
M6736.098639832787541.3975551.35960.1819620.090981
M7890.325206224805552.0743841.61270.1150870.057544
M81078.14615314873568.472641.89660.0655060.032753
M9-2425.28631966955586.559103-4.13480.0001899.4e-05
M1083.7658990470096706.0110760.11860.906180.45309
M1165.1693704083077704.1916040.09250.9267510.463376
t4.867112797474311.5344783.17180.0029940.001497

\begin{tabular}{lllllllll}
\hline
Multiple Linear Regression - Ordinary Least Squares \tabularnewline
Variable & Parameter & S.D. & T-STATH0: parameter = 0 & 2-tail p-value & 1-tail p-value \tabularnewline
(Intercept) & 633.895997338495 & 540.000071 & 1.1739 & 0.247747 & 0.123874 \tabularnewline
X & 0.00669906119430542 & 0.01108 & 0.6046 & 0.549036 & 0.274518 \tabularnewline
Y1 & 0.656397458381625 & 0.163511 & 4.0144 & 0.000271 & 0.000135 \tabularnewline
Y2 & -0.0466774298093399 & 0.194883 & -0.2395 & 0.811993 & 0.405996 \tabularnewline
Y3 & -0.0549640904534444 & 0.194595 & -0.2825 & 0.779128 & 0.389564 \tabularnewline
Y4 & -0.0357103741220868 & 0.15857 & -0.2252 & 0.823028 & 0.411514 \tabularnewline
M1 & 37.8694134566582 & 552.399222 & 0.0686 & 0.945704 & 0.472852 \tabularnewline
M2 & 156.142482881967 & 541.025196 & 0.2886 & 0.774452 & 0.387226 \tabularnewline
M3 & 295.305233485109 & 531.179177 & 0.5559 & 0.581509 & 0.290754 \tabularnewline
M4 & 437.323832062408 & 533.546023 & 0.8197 & 0.417524 & 0.208762 \tabularnewline
M5 & 588.831879163271 & 533.396365 & 1.1039 & 0.276565 & 0.138283 \tabularnewline
M6 & 736.098639832787 & 541.397555 & 1.3596 & 0.181962 & 0.090981 \tabularnewline
M7 & 890.325206224805 & 552.074384 & 1.6127 & 0.115087 & 0.057544 \tabularnewline
M8 & 1078.14615314873 & 568.47264 & 1.8966 & 0.065506 & 0.032753 \tabularnewline
M9 & -2425.28631966955 & 586.559103 & -4.1348 & 0.000189 & 9.4e-05 \tabularnewline
M10 & 83.7658990470096 & 706.011076 & 0.1186 & 0.90618 & 0.45309 \tabularnewline
M11 & 65.1693704083077 & 704.191604 & 0.0925 & 0.926751 & 0.463376 \tabularnewline
t & 4.86711279747431 & 1.534478 & 3.1718 & 0.002994 & 0.001497 \tabularnewline
\hline
\end{tabular}
%Source: https://freestatistics.org/blog/index.php?pk=58168&T=2

[TABLE]
[ROW][C]Multiple Linear Regression - Ordinary Least Squares[/C][/ROW]
[ROW][C]Variable[/C][C]Parameter[/C][C]S.D.[/C][C]T-STATH0: parameter = 0[/C][C]2-tail p-value[/C][C]1-tail p-value[/C][/ROW]
[ROW][C](Intercept)[/C][C]633.895997338495[/C][C]540.000071[/C][C]1.1739[/C][C]0.247747[/C][C]0.123874[/C][/ROW]
[ROW][C]X[/C][C]0.00669906119430542[/C][C]0.01108[/C][C]0.6046[/C][C]0.549036[/C][C]0.274518[/C][/ROW]
[ROW][C]Y1[/C][C]0.656397458381625[/C][C]0.163511[/C][C]4.0144[/C][C]0.000271[/C][C]0.000135[/C][/ROW]
[ROW][C]Y2[/C][C]-0.0466774298093399[/C][C]0.194883[/C][C]-0.2395[/C][C]0.811993[/C][C]0.405996[/C][/ROW]
[ROW][C]Y3[/C][C]-0.0549640904534444[/C][C]0.194595[/C][C]-0.2825[/C][C]0.779128[/C][C]0.389564[/C][/ROW]
[ROW][C]Y4[/C][C]-0.0357103741220868[/C][C]0.15857[/C][C]-0.2252[/C][C]0.823028[/C][C]0.411514[/C][/ROW]
[ROW][C]M1[/C][C]37.8694134566582[/C][C]552.399222[/C][C]0.0686[/C][C]0.945704[/C][C]0.472852[/C][/ROW]
[ROW][C]M2[/C][C]156.142482881967[/C][C]541.025196[/C][C]0.2886[/C][C]0.774452[/C][C]0.387226[/C][/ROW]
[ROW][C]M3[/C][C]295.305233485109[/C][C]531.179177[/C][C]0.5559[/C][C]0.581509[/C][C]0.290754[/C][/ROW]
[ROW][C]M4[/C][C]437.323832062408[/C][C]533.546023[/C][C]0.8197[/C][C]0.417524[/C][C]0.208762[/C][/ROW]
[ROW][C]M5[/C][C]588.831879163271[/C][C]533.396365[/C][C]1.1039[/C][C]0.276565[/C][C]0.138283[/C][/ROW]
[ROW][C]M6[/C][C]736.098639832787[/C][C]541.397555[/C][C]1.3596[/C][C]0.181962[/C][C]0.090981[/C][/ROW]
[ROW][C]M7[/C][C]890.325206224805[/C][C]552.074384[/C][C]1.6127[/C][C]0.115087[/C][C]0.057544[/C][/ROW]
[ROW][C]M8[/C][C]1078.14615314873[/C][C]568.47264[/C][C]1.8966[/C][C]0.065506[/C][C]0.032753[/C][/ROW]
[ROW][C]M9[/C][C]-2425.28631966955[/C][C]586.559103[/C][C]-4.1348[/C][C]0.000189[/C][C]9.4e-05[/C][/ROW]
[ROW][C]M10[/C][C]83.7658990470096[/C][C]706.011076[/C][C]0.1186[/C][C]0.90618[/C][C]0.45309[/C][/ROW]
[ROW][C]M11[/C][C]65.1693704083077[/C][C]704.191604[/C][C]0.0925[/C][C]0.926751[/C][C]0.463376[/C][/ROW]
[ROW][C]t[/C][C]4.86711279747431[/C][C]1.534478[/C][C]3.1718[/C][C]0.002994[/C][C]0.001497[/C][/ROW]
[/TABLE]
Source: https://freestatistics.org/blog/index.php?pk=58168&T=2

Globally Unique Identifier (entire table): ba.freestatistics.org/blog/index.php?pk=58168&T=2

As an alternative you can also use a QR Code:  

The GUIDs for individual cells are displayed in the table below:

Multiple Linear Regression - Ordinary Least Squares
VariableParameterS.D.T-STATH0: parameter = 02-tail p-value1-tail p-value
(Intercept)633.895997338495540.0000711.17390.2477470.123874
X0.006699061194305420.011080.60460.5490360.274518
Y10.6563974583816250.1635114.01440.0002710.000135
Y2-0.04667742980933990.194883-0.23950.8119930.405996
Y3-0.05496409045344440.194595-0.28250.7791280.389564
Y4-0.03571037412208680.15857-0.22520.8230280.411514
M137.8694134566582552.3992220.06860.9457040.472852
M2156.142482881967541.0251960.28860.7744520.387226
M3295.305233485109531.1791770.55590.5815090.290754
M4437.323832062408533.5460230.81970.4175240.208762
M5588.831879163271533.3963651.10390.2765650.138283
M6736.098639832787541.3975551.35960.1819620.090981
M7890.325206224805552.0743841.61270.1150870.057544
M81078.14615314873568.472641.89660.0655060.032753
M9-2425.28631966955586.559103-4.13480.0001899.4e-05
M1083.7658990470096706.0110760.11860.906180.45309
M1165.1693704083077704.1916040.09250.9267510.463376
t4.867112797474311.5344783.17180.0029940.001497


Multiple Linear Regression - Regression Statistics
Multiple R0.998836388403883
R-squared0.997674130799712
Adjusted R-squared0.996633610368004
F-TEST (value)958.82223971542
F-TEST (DF numerator)17
F-TEST (DF denominator)38
p-value0
Multiple Linear Regression - Residual Statistics
Residual Standard Deviation61.0872216019478
Sum Squared Residuals141802.648435728

\begin{tabular}{lllllllll}
\hline
Multiple Linear Regression - Regression Statistics \tabularnewline
Multiple R & 0.998836388403883 \tabularnewline
R-squared & 0.997674130799712 \tabularnewline
Adjusted R-squared & 0.996633610368004 \tabularnewline
F-TEST (value) & 958.82223971542 \tabularnewline
F-TEST (DF numerator) & 17 \tabularnewline
F-TEST (DF denominator) & 38 \tabularnewline
p-value & 0 \tabularnewline
Multiple Linear Regression - Residual Statistics \tabularnewline
Residual Standard Deviation & 61.0872216019478 \tabularnewline
Sum Squared Residuals & 141802.648435728 \tabularnewline
\hline
\end{tabular}
%Source: https://freestatistics.org/blog/index.php?pk=58168&T=3

[TABLE]
[ROW][C]Multiple Linear Regression - Regression Statistics[/C][/ROW]
[ROW][C]Multiple R[/C][C]0.998836388403883[/C][/ROW]
[ROW][C]R-squared[/C][C]0.997674130799712[/C][/ROW]
[ROW][C]Adjusted R-squared[/C][C]0.996633610368004[/C][/ROW]
[ROW][C]F-TEST (value)[/C][C]958.82223971542[/C][/ROW]
[ROW][C]F-TEST (DF numerator)[/C][C]17[/C][/ROW]
[ROW][C]F-TEST (DF denominator)[/C][C]38[/C][/ROW]
[ROW][C]p-value[/C][C]0[/C][/ROW]
[ROW][C]Multiple Linear Regression - Residual Statistics[/C][/ROW]
[ROW][C]Residual Standard Deviation[/C][C]61.0872216019478[/C][/ROW]
[ROW][C]Sum Squared Residuals[/C][C]141802.648435728[/C][/ROW]
[/TABLE]
Source: https://freestatistics.org/blog/index.php?pk=58168&T=3

Globally Unique Identifier (entire table): ba.freestatistics.org/blog/index.php?pk=58168&T=3

As an alternative you can also use a QR Code:  

The GUIDs for individual cells are displayed in the table below:

Multiple Linear Regression - Regression Statistics
Multiple R0.998836388403883
R-squared0.997674130799712
Adjusted R-squared0.996633610368004
F-TEST (value)958.82223971542
F-TEST (DF numerator)17
F-TEST (DF denominator)38
p-value0
Multiple Linear Regression - Residual Statistics
Residual Standard Deviation61.0872216019478
Sum Squared Residuals141802.648435728


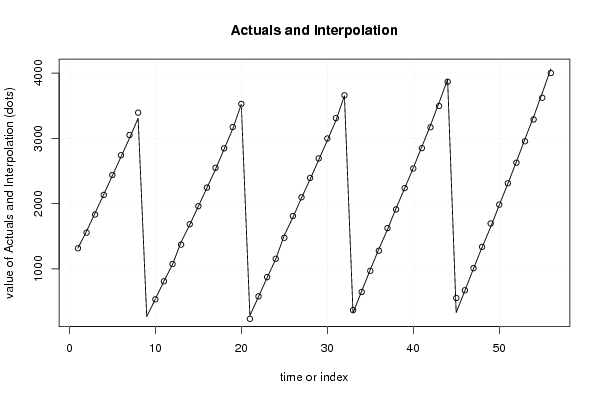
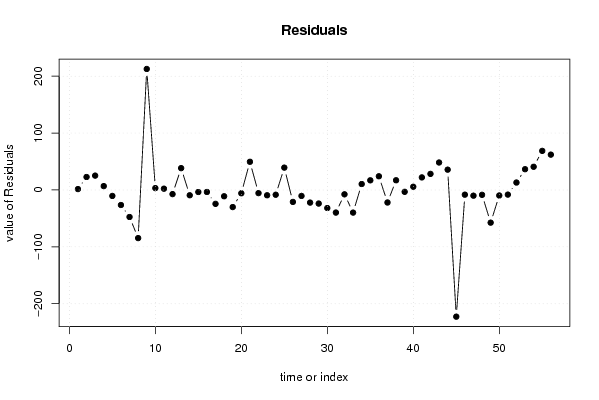
Multiple Linear Regression - Actuals, Interpolation, and Residuals
Time or IndexActualsInterpolationForecastResidualsPrediction Error
113181316.354889119121.64511088087917
215781555.1373399411622.8626600588374
318591833.7350377646625.2649622353445
421412134.173672415936.82632758406626
524282438.44272337777-10.4427233777739
627152741.38488138103-26.3848813810282
730043051.43430984211-47.4343098421122
833093393.56153591642-84.5615359164223
926956.1797826823087212.820217317691
10537533.6979067863673.30209321363307
11813810.6980507022262.30194929777444
1210681075.21761598108-7.21761598107972
1314111372.5855011686138.4144988313882
1416751684.30048745818-9.3004874581777
1519581961.54274234898-3.54274234898012
1622422245.49324368938-3.49324368937669
1725242548.35658529563-24.3565852956338
1828362847.05431784009-11.0543178400900
1931433173.00299984029-30.0029998402896
2035223527.77719252433-5.77719252433067
21285235.39232300847649.607676991524
22574579.516629467582-5.51662946758245
23865874.304111848152-9.30411184815186
2411471155.35894339907-8.35894339906818
2515161476.6751498646039.3248501353964
2617891809.98406850642-20.9840685064161
2720872097.41694795355-10.4169479535464
2823722394.13446423062-22.1344642306232
2926692692.86466895153-23.8646689515327
3029662997.75727575969-31.7572757596936
3132703309.69531748239-39.6953174823864
3236523659.59369241783-7.59369241783452
33329368.729276295068-39.7292762950684
34658647.55843501031410.4415649896860
35988971.01752946606716.9824705339327
3613031278.8971594058224.1028405941785
3716031624.97282375311-21.9728237531087
3819291911.9174819904817.0825180095211
3922352238.19318371312-3.19318371312122
4025442538.278939291935.72106070806572
4128722849.8969689316622.1030310683432
4231983169.6554605402528.3445394597490
4335443495.6411783829148.3588216170918
4439033867.2375394541935.7624605458114
45332554.698618014147-222.698618014147
46665673.227028735737-8.2270287357366
4710011010.98030798356-9.9803079835553
4813291337.52628121403-8.52628121403101
4916391696.41163609455-57.411636094555
5019751984.66062210376-9.66062210376465
5123042312.11208821970-8.11208821969641
5226402626.9196803721313.0803196278679
5329922955.439053443436.5609465565971
5433303289.1480644789440.8519355210629
5536903621.2261944523068.7738055476964
5640634000.8300396872262.1699603127762

\begin{tabular}{lllllllll}
\hline
Multiple Linear Regression - Actuals, Interpolation, and Residuals \tabularnewline
Time or Index & Actuals & InterpolationForecast & ResidualsPrediction Error \tabularnewline
1 & 1318 & 1316.35488911912 & 1.64511088087917 \tabularnewline
2 & 1578 & 1555.13733994116 & 22.8626600588374 \tabularnewline
3 & 1859 & 1833.73503776466 & 25.2649622353445 \tabularnewline
4 & 2141 & 2134.17367241593 & 6.82632758406626 \tabularnewline
5 & 2428 & 2438.44272337777 & -10.4427233777739 \tabularnewline
6 & 2715 & 2741.38488138103 & -26.3848813810282 \tabularnewline
7 & 3004 & 3051.43430984211 & -47.4343098421122 \tabularnewline
8 & 3309 & 3393.56153591642 & -84.5615359164223 \tabularnewline
9 & 269 & 56.1797826823087 & 212.820217317691 \tabularnewline
10 & 537 & 533.697906786367 & 3.30209321363307 \tabularnewline
11 & 813 & 810.698050702226 & 2.30194929777444 \tabularnewline
12 & 1068 & 1075.21761598108 & -7.21761598107972 \tabularnewline
13 & 1411 & 1372.58550116861 & 38.4144988313882 \tabularnewline
14 & 1675 & 1684.30048745818 & -9.3004874581777 \tabularnewline
15 & 1958 & 1961.54274234898 & -3.54274234898012 \tabularnewline
16 & 2242 & 2245.49324368938 & -3.49324368937669 \tabularnewline
17 & 2524 & 2548.35658529563 & -24.3565852956338 \tabularnewline
18 & 2836 & 2847.05431784009 & -11.0543178400900 \tabularnewline
19 & 3143 & 3173.00299984029 & -30.0029998402896 \tabularnewline
20 & 3522 & 3527.77719252433 & -5.77719252433067 \tabularnewline
21 & 285 & 235.392323008476 & 49.607676991524 \tabularnewline
22 & 574 & 579.516629467582 & -5.51662946758245 \tabularnewline
23 & 865 & 874.304111848152 & -9.30411184815186 \tabularnewline
24 & 1147 & 1155.35894339907 & -8.35894339906818 \tabularnewline
25 & 1516 & 1476.67514986460 & 39.3248501353964 \tabularnewline
26 & 1789 & 1809.98406850642 & -20.9840685064161 \tabularnewline
27 & 2087 & 2097.41694795355 & -10.4169479535464 \tabularnewline
28 & 2372 & 2394.13446423062 & -22.1344642306232 \tabularnewline
29 & 2669 & 2692.86466895153 & -23.8646689515327 \tabularnewline
30 & 2966 & 2997.75727575969 & -31.7572757596936 \tabularnewline
31 & 3270 & 3309.69531748239 & -39.6953174823864 \tabularnewline
32 & 3652 & 3659.59369241783 & -7.59369241783452 \tabularnewline
33 & 329 & 368.729276295068 & -39.7292762950684 \tabularnewline
34 & 658 & 647.558435010314 & 10.4415649896860 \tabularnewline
35 & 988 & 971.017529466067 & 16.9824705339327 \tabularnewline
36 & 1303 & 1278.89715940582 & 24.1028405941785 \tabularnewline
37 & 1603 & 1624.97282375311 & -21.9728237531087 \tabularnewline
38 & 1929 & 1911.91748199048 & 17.0825180095211 \tabularnewline
39 & 2235 & 2238.19318371312 & -3.19318371312122 \tabularnewline
40 & 2544 & 2538.27893929193 & 5.72106070806572 \tabularnewline
41 & 2872 & 2849.89696893166 & 22.1030310683432 \tabularnewline
42 & 3198 & 3169.65546054025 & 28.3445394597490 \tabularnewline
43 & 3544 & 3495.64117838291 & 48.3588216170918 \tabularnewline
44 & 3903 & 3867.23753945419 & 35.7624605458114 \tabularnewline
45 & 332 & 554.698618014147 & -222.698618014147 \tabularnewline
46 & 665 & 673.227028735737 & -8.2270287357366 \tabularnewline
47 & 1001 & 1010.98030798356 & -9.9803079835553 \tabularnewline
48 & 1329 & 1337.52628121403 & -8.52628121403101 \tabularnewline
49 & 1639 & 1696.41163609455 & -57.411636094555 \tabularnewline
50 & 1975 & 1984.66062210376 & -9.66062210376465 \tabularnewline
51 & 2304 & 2312.11208821970 & -8.11208821969641 \tabularnewline
52 & 2640 & 2626.91968037213 & 13.0803196278679 \tabularnewline
53 & 2992 & 2955.4390534434 & 36.5609465565971 \tabularnewline
54 & 3330 & 3289.14806447894 & 40.8519355210629 \tabularnewline
55 & 3690 & 3621.22619445230 & 68.7738055476964 \tabularnewline
56 & 4063 & 4000.83003968722 & 62.1699603127762 \tabularnewline
\hline
\end{tabular}
%Source: https://freestatistics.org/blog/index.php?pk=58168&T=4

[TABLE]
[ROW][C]Multiple Linear Regression - Actuals, Interpolation, and Residuals[/C][/ROW]
[ROW][C]Time or Index[/C][C]Actuals[/C][C]InterpolationForecast[/C][C]ResidualsPrediction Error[/C][/ROW]
[ROW][C]1[/C][C]1318[/C][C]1316.35488911912[/C][C]1.64511088087917[/C][/ROW]
[ROW][C]2[/C][C]1578[/C][C]1555.13733994116[/C][C]22.8626600588374[/C][/ROW]
[ROW][C]3[/C][C]1859[/C][C]1833.73503776466[/C][C]25.2649622353445[/C][/ROW]
[ROW][C]4[/C][C]2141[/C][C]2134.17367241593[/C][C]6.82632758406626[/C][/ROW]
[ROW][C]5[/C][C]2428[/C][C]2438.44272337777[/C][C]-10.4427233777739[/C][/ROW]
[ROW][C]6[/C][C]2715[/C][C]2741.38488138103[/C][C]-26.3848813810282[/C][/ROW]
[ROW][C]7[/C][C]3004[/C][C]3051.43430984211[/C][C]-47.4343098421122[/C][/ROW]
[ROW][C]8[/C][C]3309[/C][C]3393.56153591642[/C][C]-84.5615359164223[/C][/ROW]
[ROW][C]9[/C][C]269[/C][C]56.1797826823087[/C][C]212.820217317691[/C][/ROW]
[ROW][C]10[/C][C]537[/C][C]533.697906786367[/C][C]3.30209321363307[/C][/ROW]
[ROW][C]11[/C][C]813[/C][C]810.698050702226[/C][C]2.30194929777444[/C][/ROW]
[ROW][C]12[/C][C]1068[/C][C]1075.21761598108[/C][C]-7.21761598107972[/C][/ROW]
[ROW][C]13[/C][C]1411[/C][C]1372.58550116861[/C][C]38.4144988313882[/C][/ROW]
[ROW][C]14[/C][C]1675[/C][C]1684.30048745818[/C][C]-9.3004874581777[/C][/ROW]
[ROW][C]15[/C][C]1958[/C][C]1961.54274234898[/C][C]-3.54274234898012[/C][/ROW]
[ROW][C]16[/C][C]2242[/C][C]2245.49324368938[/C][C]-3.49324368937669[/C][/ROW]
[ROW][C]17[/C][C]2524[/C][C]2548.35658529563[/C][C]-24.3565852956338[/C][/ROW]
[ROW][C]18[/C][C]2836[/C][C]2847.05431784009[/C][C]-11.0543178400900[/C][/ROW]
[ROW][C]19[/C][C]3143[/C][C]3173.00299984029[/C][C]-30.0029998402896[/C][/ROW]
[ROW][C]20[/C][C]3522[/C][C]3527.77719252433[/C][C]-5.77719252433067[/C][/ROW]
[ROW][C]21[/C][C]285[/C][C]235.392323008476[/C][C]49.607676991524[/C][/ROW]
[ROW][C]22[/C][C]574[/C][C]579.516629467582[/C][C]-5.51662946758245[/C][/ROW]
[ROW][C]23[/C][C]865[/C][C]874.304111848152[/C][C]-9.30411184815186[/C][/ROW]
[ROW][C]24[/C][C]1147[/C][C]1155.35894339907[/C][C]-8.35894339906818[/C][/ROW]
[ROW][C]25[/C][C]1516[/C][C]1476.67514986460[/C][C]39.3248501353964[/C][/ROW]
[ROW][C]26[/C][C]1789[/C][C]1809.98406850642[/C][C]-20.9840685064161[/C][/ROW]
[ROW][C]27[/C][C]2087[/C][C]2097.41694795355[/C][C]-10.4169479535464[/C][/ROW]
[ROW][C]28[/C][C]2372[/C][C]2394.13446423062[/C][C]-22.1344642306232[/C][/ROW]
[ROW][C]29[/C][C]2669[/C][C]2692.86466895153[/C][C]-23.8646689515327[/C][/ROW]
[ROW][C]30[/C][C]2966[/C][C]2997.75727575969[/C][C]-31.7572757596936[/C][/ROW]
[ROW][C]31[/C][C]3270[/C][C]3309.69531748239[/C][C]-39.6953174823864[/C][/ROW]
[ROW][C]32[/C][C]3652[/C][C]3659.59369241783[/C][C]-7.59369241783452[/C][/ROW]
[ROW][C]33[/C][C]329[/C][C]368.729276295068[/C][C]-39.7292762950684[/C][/ROW]
[ROW][C]34[/C][C]658[/C][C]647.558435010314[/C][C]10.4415649896860[/C][/ROW]
[ROW][C]35[/C][C]988[/C][C]971.017529466067[/C][C]16.9824705339327[/C][/ROW]
[ROW][C]36[/C][C]1303[/C][C]1278.89715940582[/C][C]24.1028405941785[/C][/ROW]
[ROW][C]37[/C][C]1603[/C][C]1624.97282375311[/C][C]-21.9728237531087[/C][/ROW]
[ROW][C]38[/C][C]1929[/C][C]1911.91748199048[/C][C]17.0825180095211[/C][/ROW]
[ROW][C]39[/C][C]2235[/C][C]2238.19318371312[/C][C]-3.19318371312122[/C][/ROW]
[ROW][C]40[/C][C]2544[/C][C]2538.27893929193[/C][C]5.72106070806572[/C][/ROW]
[ROW][C]41[/C][C]2872[/C][C]2849.89696893166[/C][C]22.1030310683432[/C][/ROW]
[ROW][C]42[/C][C]3198[/C][C]3169.65546054025[/C][C]28.3445394597490[/C][/ROW]
[ROW][C]43[/C][C]3544[/C][C]3495.64117838291[/C][C]48.3588216170918[/C][/ROW]
[ROW][C]44[/C][C]3903[/C][C]3867.23753945419[/C][C]35.7624605458114[/C][/ROW]
[ROW][C]45[/C][C]332[/C][C]554.698618014147[/C][C]-222.698618014147[/C][/ROW]
[ROW][C]46[/C][C]665[/C][C]673.227028735737[/C][C]-8.2270287357366[/C][/ROW]
[ROW][C]47[/C][C]1001[/C][C]1010.98030798356[/C][C]-9.9803079835553[/C][/ROW]
[ROW][C]48[/C][C]1329[/C][C]1337.52628121403[/C][C]-8.52628121403101[/C][/ROW]
[ROW][C]49[/C][C]1639[/C][C]1696.41163609455[/C][C]-57.411636094555[/C][/ROW]
[ROW][C]50[/C][C]1975[/C][C]1984.66062210376[/C][C]-9.66062210376465[/C][/ROW]
[ROW][C]51[/C][C]2304[/C][C]2312.11208821970[/C][C]-8.11208821969641[/C][/ROW]
[ROW][C]52[/C][C]2640[/C][C]2626.91968037213[/C][C]13.0803196278679[/C][/ROW]
[ROW][C]53[/C][C]2992[/C][C]2955.4390534434[/C][C]36.5609465565971[/C][/ROW]
[ROW][C]54[/C][C]3330[/C][C]3289.14806447894[/C][C]40.8519355210629[/C][/ROW]
[ROW][C]55[/C][C]3690[/C][C]3621.22619445230[/C][C]68.7738055476964[/C][/ROW]
[ROW][C]56[/C][C]4063[/C][C]4000.83003968722[/C][C]62.1699603127762[/C][/ROW]
[/TABLE]
Source: https://freestatistics.org/blog/index.php?pk=58168&T=4

Globally Unique Identifier (entire table): ba.freestatistics.org/blog/index.php?pk=58168&T=4

As an alternative you can also use a QR Code:  

The GUIDs for individual cells are displayed in the table below:

Multiple Linear Regression - Actuals, Interpolation, and Residuals
Time or IndexActualsInterpolationForecastResidualsPrediction Error
113181316.354889119121.64511088087917
215781555.1373399411622.8626600588374
318591833.7350377646625.2649622353445
421412134.173672415936.82632758406626
524282438.44272337777-10.4427233777739
627152741.38488138103-26.3848813810282
730043051.43430984211-47.4343098421122
833093393.56153591642-84.5615359164223
926956.1797826823087212.820217317691
10537533.6979067863673.30209321363307
11813810.6980507022262.30194929777444
1210681075.21761598108-7.21761598107972
1314111372.5855011686138.4144988313882
1416751684.30048745818-9.3004874581777
1519581961.54274234898-3.54274234898012
1622422245.49324368938-3.49324368937669
1725242548.35658529563-24.3565852956338
1828362847.05431784009-11.0543178400900
1931433173.00299984029-30.0029998402896
2035223527.77719252433-5.77719252433067
21285235.39232300847649.607676991524
22574579.516629467582-5.51662946758245
23865874.304111848152-9.30411184815186
2411471155.35894339907-8.35894339906818
2515161476.6751498646039.3248501353964
2617891809.98406850642-20.9840685064161
2720872097.41694795355-10.4169479535464
2823722394.13446423062-22.1344642306232
2926692692.86466895153-23.8646689515327
3029662997.75727575969-31.7572757596936
3132703309.69531748239-39.6953174823864
3236523659.59369241783-7.59369241783452
33329368.729276295068-39.7292762950684
34658647.55843501031410.4415649896860
35988971.01752946606716.9824705339327
3613031278.8971594058224.1028405941785
3716031624.97282375311-21.9728237531087
3819291911.9174819904817.0825180095211
3922352238.19318371312-3.19318371312122
4025442538.278939291935.72106070806572
4128722849.8969689316622.1030310683432
4231983169.6554605402528.3445394597490
4335443495.6411783829148.3588216170918
4439033867.2375394541935.7624605458114
45332554.698618014147-222.698618014147
46665673.227028735737-8.2270287357366
4710011010.98030798356-9.9803079835553
4813291337.52628121403-8.52628121403101
4916391696.41163609455-57.411636094555
5019751984.66062210376-9.66062210376465
5123042312.11208821970-8.11208821969641
5226402626.9196803721313.0803196278679
5329922955.439053443436.5609465565971
5433303289.1480644789440.8519355210629
5536903621.2261944523068.7738055476964
5640634000.8300396872262.1699603127762


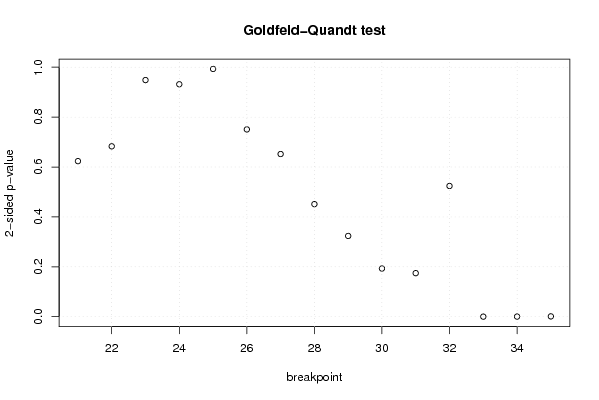
Goldfeld-Quandt test for Heteroskedasticity
p-valuesAlternative Hypothesis
breakpoint indexgreater2-sidedless
210.6882041933489660.6235916133020680.311795806651034
220.658509719236460.682980561527080.34149028076354
230.5257044411239290.9485911177521420.474295558876071
240.4658828980696050.931765796139210.534117101930395
250.5034153997904670.9931692004190670.496584600209533
260.375371348148420.750742696296840.62462865185158
270.3259854261426050.651970852285210.674014573857395
280.2255908434391610.4511816868783230.774409156560839
290.161773924766590.323547849533180.83822607523341
300.09650170371003770.1930034074200750.903498296289962
310.08721395158371480.1744279031674300.912786048416285
320.2619427912661430.5238855825322870.738057208733857
330.9999864247807772.71504384454100e-051.35752192227050e-05
340.9998723636941890.0002552726116221190.000127636305811059
350.9994419403409650.001116119318069260.000558059659034632

\begin{tabular}{lllllllll}
\hline
Goldfeld-Quandt test for Heteroskedasticity \tabularnewline
p-values & Alternative Hypothesis \tabularnewline
breakpoint index & greater & 2-sided & less \tabularnewline
21 & 0.688204193348966 & 0.623591613302068 & 0.311795806651034 \tabularnewline
22 & 0.65850971923646 & 0.68298056152708 & 0.34149028076354 \tabularnewline
23 & 0.525704441123929 & 0.948591117752142 & 0.474295558876071 \tabularnewline
24 & 0.465882898069605 & 0.93176579613921 & 0.534117101930395 \tabularnewline
25 & 0.503415399790467 & 0.993169200419067 & 0.496584600209533 \tabularnewline
26 & 0.37537134814842 & 0.75074269629684 & 0.62462865185158 \tabularnewline
27 & 0.325985426142605 & 0.65197085228521 & 0.674014573857395 \tabularnewline
28 & 0.225590843439161 & 0.451181686878323 & 0.774409156560839 \tabularnewline
29 & 0.16177392476659 & 0.32354784953318 & 0.83822607523341 \tabularnewline
30 & 0.0965017037100377 & 0.193003407420075 & 0.903498296289962 \tabularnewline
31 & 0.0872139515837148 & 0.174427903167430 & 0.912786048416285 \tabularnewline
32 & 0.261942791266143 & 0.523885582532287 & 0.738057208733857 \tabularnewline
33 & 0.999986424780777 & 2.71504384454100e-05 & 1.35752192227050e-05 \tabularnewline
34 & 0.999872363694189 & 0.000255272611622119 & 0.000127636305811059 \tabularnewline
35 & 0.999441940340965 & 0.00111611931806926 & 0.000558059659034632 \tabularnewline
\hline
\end{tabular}
%Source: https://freestatistics.org/blog/index.php?pk=58168&T=5

[TABLE]
[ROW][C]Goldfeld-Quandt test for Heteroskedasticity[/C][/ROW]
[ROW][C]p-values[/C][C]Alternative Hypothesis[/C][/ROW]
[ROW][C]breakpoint index[/C][C]greater[/C][C]2-sided[/C][C]less[/C][/ROW]
[ROW][C]21[/C][C]0.688204193348966[/C][C]0.623591613302068[/C][C]0.311795806651034[/C][/ROW]
[ROW][C]22[/C][C]0.65850971923646[/C][C]0.68298056152708[/C][C]0.34149028076354[/C][/ROW]
[ROW][C]23[/C][C]0.525704441123929[/C][C]0.948591117752142[/C][C]0.474295558876071[/C][/ROW]
[ROW][C]24[/C][C]0.465882898069605[/C][C]0.93176579613921[/C][C]0.534117101930395[/C][/ROW]
[ROW][C]25[/C][C]0.503415399790467[/C][C]0.993169200419067[/C][C]0.496584600209533[/C][/ROW]
[ROW][C]26[/C][C]0.37537134814842[/C][C]0.75074269629684[/C][C]0.62462865185158[/C][/ROW]
[ROW][C]27[/C][C]0.325985426142605[/C][C]0.65197085228521[/C][C]0.674014573857395[/C][/ROW]
[ROW][C]28[/C][C]0.225590843439161[/C][C]0.451181686878323[/C][C]0.774409156560839[/C][/ROW]
[ROW][C]29[/C][C]0.16177392476659[/C][C]0.32354784953318[/C][C]0.83822607523341[/C][/ROW]
[ROW][C]30[/C][C]0.0965017037100377[/C][C]0.193003407420075[/C][C]0.903498296289962[/C][/ROW]
[ROW][C]31[/C][C]0.0872139515837148[/C][C]0.174427903167430[/C][C]0.912786048416285[/C][/ROW]
[ROW][C]32[/C][C]0.261942791266143[/C][C]0.523885582532287[/C][C]0.738057208733857[/C][/ROW]
[ROW][C]33[/C][C]0.999986424780777[/C][C]2.71504384454100e-05[/C][C]1.35752192227050e-05[/C][/ROW]
[ROW][C]34[/C][C]0.999872363694189[/C][C]0.000255272611622119[/C][C]0.000127636305811059[/C][/ROW]
[ROW][C]35[/C][C]0.999441940340965[/C][C]0.00111611931806926[/C][C]0.000558059659034632[/C][/ROW]
[/TABLE]
Source: https://freestatistics.org/blog/index.php?pk=58168&T=5

Globally Unique Identifier (entire table): ba.freestatistics.org/blog/index.php?pk=58168&T=5

As an alternative you can also use a QR Code:  

The GUIDs for individual cells are displayed in the table below:

Goldfeld-Quandt test for Heteroskedasticity
p-valuesAlternative Hypothesis
breakpoint indexgreater2-sidedless
210.6882041933489660.6235916133020680.311795806651034
220.658509719236460.682980561527080.34149028076354
230.5257044411239290.9485911177521420.474295558876071
240.4658828980696050.931765796139210.534117101930395
250.5034153997904670.9931692004190670.496584600209533
260.375371348148420.750742696296840.62462865185158
270.3259854261426050.651970852285210.674014573857395
280.2255908434391610.4511816868783230.774409156560839
290.161773924766590.323547849533180.83822607523341
300.09650170371003770.1930034074200750.903498296289962
310.08721395158371480.1744279031674300.912786048416285
320.2619427912661430.5238855825322870.738057208733857
330.9999864247807772.71504384454100e-051.35752192227050e-05
340.9998723636941890.0002552726116221190.000127636305811059
350.9994419403409650.001116119318069260.000558059659034632


Meta Analysis of Goldfeld-Quandt test for Heteroskedasticity
Description# significant tests% significant testsOK/NOK
1% type I error level30.2NOK
5% type I error level30.2NOK
10% type I error level30.2NOK

\begin{tabular}{lllllllll}
\hline
Meta Analysis of Goldfeld-Quandt test for Heteroskedasticity \tabularnewline
Description & # significant tests & % significant tests & OK/NOK \tabularnewline
1% type I error level & 3 & 0.2 & NOK \tabularnewline
5% type I error level & 3 & 0.2 & NOK \tabularnewline
10% type I error level & 3 & 0.2 & NOK \tabularnewline
\hline
\end{tabular}
%Source: https://freestatistics.org/blog/index.php?pk=58168&T=6

[TABLE]
[ROW][C]Meta Analysis of Goldfeld-Quandt test for Heteroskedasticity[/C][/ROW]
[ROW][C]Description[/C][C]# significant tests[/C][C]% significant tests[/C][C]OK/NOK[/C][/ROW]
[ROW][C]1% type I error level[/C][C]3[/C][C]0.2[/C][C]NOK[/C][/ROW]
[ROW][C]5% type I error level[/C][C]3[/C][C]0.2[/C][C]NOK[/C][/ROW]
[ROW][C]10% type I error level[/C][C]3[/C][C]0.2[/C][C]NOK[/C][/ROW]
[/TABLE]
Source: https://freestatistics.org/blog/index.php?pk=58168&T=6

Globally Unique Identifier (entire table): ba.freestatistics.org/blog/index.php?pk=58168&T=6

As an alternative you can also use a QR Code:  

The GUIDs for individual cells are displayed in the table below:

Meta Analysis of Goldfeld-Quandt test for Heteroskedasticity
Description# significant tests% significant testsOK/NOK
1% type I error level30.2NOK
5% type I error level30.2NOK
10% type I error level30.2NOK


Parameters (Session):
Parameters (R input):
par1 = 1 ; par2 = Include Monthly Dummies ; par3 = Linear Trend ;
R code (references can be found in the software module):
library(lattice)
library(lmtest)
n25 <- 25 #minimum number of obs. for Goldfeld-Quandt test
par1 <- as.numeric(par1)
x <- t(y)
k <- length(x[1,])
n <- length(x[,1])
x1 <- cbind(x[,par1], x[,1:k!=par1])
mycolnames <- c(colnames(x)[par1], colnames(x)[1:k!=par1])
colnames(x1) <- mycolnames #colnames(x)[par1]
x <- x1
if (par3 == 'First Differences'){
x2 <- array(0, dim=c(n-1,k), dimnames=list(1:(n-1), paste('(1-B)',colnames(x),sep='')))
for (i in 1:n-1) {
for (j in 1:k) {
x2[i,j] <- x[i+1,j] - x[i,j]
}
}
x <- x2
}
if (par2 == 'Include Monthly Dummies'){
x2 <- array(0, dim=c(n,11), dimnames=list(1:n, paste('M', seq(1:11), sep ='')))
for (i in 1:11){
x2[seq(i,n,12),i] <- 1
}
x <- cbind(x, x2)
}
if (par2 == 'Include Quarterly Dummies'){
x2 <- array(0, dim=c(n,3), dimnames=list(1:n, paste('Q', seq(1:3), sep ='')))
for (i in 1:3){
x2[seq(i,n,4),i] <- 1
}
x <- cbind(x, x2)
}
k <- length(x[1,])
if (par3 == 'Linear Trend'){
x <- cbind(x, c(1:n))
colnames(x)[k+1] <- 't'
}
x
k <- length(x[1,])
df <- as.data.frame(x)
(mylm <- lm(df))
(mysum <- summary(mylm))
if (n > n25) {
kp3 <- k + 3
nmkm3 <- n - k - 3
gqarr <- array(NA, dim=c(nmkm3-kp3+1,3))
numgqtests <- 0
numsignificant1 <- 0
numsignificant5 <- 0
numsignificant10 <- 0
for (mypoint in kp3:nmkm3) {
j <- 0
numgqtests <- numgqtests + 1
for (myalt in c('greater', 'two.sided', 'less')) {
j <- j + 1
gqarr[mypoint-kp3+1,j] <- gqtest(mylm, point=mypoint, alternative=myalt)$p.value
}
if (gqarr[mypoint-kp3+1,2] < 0.01) numsignificant1 <- numsignificant1 + 1
if (gqarr[mypoint-kp3+1,2] < 0.05) numsignificant5 <- numsignificant5 + 1
if (gqarr[mypoint-kp3+1,2] < 0.10) numsignificant10 <- numsignificant10 + 1
}
gqarr
}
bitmap(file='test0.png')
plot(x[,1], type='l', main='Actuals and Interpolation', ylab='value of Actuals and Interpolation (dots)', xlab='time or index')
points(x[,1]-mysum$resid)
grid()
dev.off()
bitmap(file='test1.png')
plot(mysum$resid, type='b', pch=19, main='Residuals', ylab='value of Residuals', xlab='time or index')
grid()
dev.off()
bitmap(file='test2.png')
hist(mysum$resid, main='Residual Histogram', xlab='values of Residuals')
grid()
dev.off()
bitmap(file='test3.png')
densityplot(~mysum$resid,col='black',main='Residual Density Plot', xlab='values of Residuals')
dev.off()
bitmap(file='test4.png')
qqnorm(mysum$resid, main='Residual Normal Q-Q Plot')
qqline(mysum$resid)
grid()
dev.off()
(myerror <- as.ts(mysum$resid))
bitmap(file='test5.png')
dum <- cbind(lag(myerror,k=1),myerror)
dum
dum1 <- dum[2:length(myerror),]
dum1
z <- as.data.frame(dum1)
z
plot(z,main=paste('Residual Lag plot, lowess, and regression line'), ylab='values of Residuals', xlab='lagged values of Residuals')
lines(lowess(z))
abline(lm(z))
grid()
dev.off()
bitmap(file='test6.png')
acf(mysum$resid, lag.max=length(mysum$resid)/2, main='Residual Autocorrelation Function')
grid()
dev.off()
bitmap(file='test7.png')
pacf(mysum$resid, lag.max=length(mysum$resid)/2, main='Residual Partial Autocorrelation Function')
grid()
dev.off()
bitmap(file='test8.png')
opar <- par(mfrow = c(2,2), oma = c(0, 0, 1.1, 0))
plot(mylm, las = 1, sub='Residual Diagnostics')
par(opar)
dev.off()
if (n > n25) {
bitmap(file='test9.png')
plot(kp3:nmkm3,gqarr[,2], main='Goldfeld-Quandt test',ylab='2-sided p-value',xlab='breakpoint')
grid()
dev.off()
}
load(file='createtable')
a<-table.start()
a<-table.row.start(a)
a<-table.element(a, 'Multiple Linear Regression - Estimated Regression Equation', 1, TRUE)
a<-table.row.end(a)
myeq <- colnames(x)[1]
myeq <- paste(myeq, '[t] = ', sep='')
for (i in 1:k){
if (mysum$coefficients[i,1] > 0) myeq <- paste(myeq, '+', '')
myeq <- paste(myeq, mysum$coefficients[i,1], sep=' ')
if (rownames(mysum$coefficients)[i] != '(Intercept)') {
myeq <- paste(myeq, rownames(mysum$coefficients)[i], sep='')
if (rownames(mysum$coefficients)[i] != 't') myeq <- paste(myeq, '[t]', sep='')
}
}
myeq <- paste(myeq, ' + e[t]')
a<-table.row.start(a)
a<-table.element(a, myeq)
a<-table.row.end(a)
a<-table.end(a)
table.save(a,file='mytable1.tab')
a<-table.start()
a<-table.row.start(a)
a<-table.element(a,hyperlink('ols1.htm','Multiple Linear Regression - Ordinary Least Squares',''), 6, TRUE)
a<-table.row.end(a)
a<-table.row.start(a)
a<-table.element(a,'Variable',header=TRUE)
a<-table.element(a,'Parameter',header=TRUE)
a<-table.element(a,'S.D.',header=TRUE)
a<-table.element(a,'T-STAT
H0: parameter = 0',header=TRUE)
a<-table.element(a,'2-tail p-value',header=TRUE)
a<-table.element(a,'1-tail p-value',header=TRUE)
a<-table.row.end(a)
for (i in 1:k){
a<-table.row.start(a)
a<-table.element(a,rownames(mysum$coefficients)[i],header=TRUE)
a<-table.element(a,mysum$coefficients[i,1])
a<-table.element(a, round(mysum$coefficients[i,2],6))
a<-table.element(a, round(mysum$coefficients[i,3],4))
a<-table.element(a, round(mysum$coefficients[i,4],6))
a<-table.element(a, round(mysum$coefficients[i,4]/2,6))
a<-table.row.end(a)
}
a<-table.end(a)
table.save(a,file='mytable2.tab')
a<-table.start()
a<-table.row.start(a)
a<-table.element(a, 'Multiple Linear Regression - Regression Statistics', 2, TRUE)
a<-table.row.end(a)
a<-table.row.start(a)
a<-table.element(a, 'Multiple R',1,TRUE)
a<-table.element(a, sqrt(mysum$r.squared))
a<-table.row.end(a)
a<-table.row.start(a)
a<-table.element(a, 'R-squared',1,TRUE)
a<-table.element(a, mysum$r.squared)
a<-table.row.end(a)
a<-table.row.start(a)
a<-table.element(a, 'Adjusted R-squared',1,TRUE)
a<-table.element(a, mysum$adj.r.squared)
a<-table.row.end(a)
a<-table.row.start(a)
a<-table.element(a, 'F-TEST (value)',1,TRUE)
a<-table.element(a, mysum$fstatistic[1])
a<-table.row.end(a)
a<-table.row.start(a)
a<-table.element(a, 'F-TEST (DF numerator)',1,TRUE)
a<-table.element(a, mysum$fstatistic[2])
a<-table.row.end(a)
a<-table.row.start(a)
a<-table.element(a, 'F-TEST (DF denominator)',1,TRUE)
a<-table.element(a, mysum$fstatistic[3])
a<-table.row.end(a)
a<-table.row.start(a)
a<-table.element(a, 'p-value',1,TRUE)
a<-table.element(a, 1-pf(mysum$fstatistic[1],mysum$fstatistic[2],mysum$fstatistic[3]))
a<-table.row.end(a)
a<-table.row.start(a)
a<-table.element(a, 'Multiple Linear Regression - Residual Statistics', 2, TRUE)
a<-table.row.end(a)
a<-table.row.start(a)
a<-table.element(a, 'Residual Standard Deviation',1,TRUE)
a<-table.element(a, mysum$sigma)
a<-table.row.end(a)
a<-table.row.start(a)
a<-table.element(a, 'Sum Squared Residuals',1,TRUE)
a<-table.element(a, sum(myerror*myerror))
a<-table.row.end(a)
a<-table.end(a)
table.save(a,file='mytable3.tab')
a<-table.start()
a<-table.row.start(a)
a<-table.element(a, 'Multiple Linear Regression - Actuals, Interpolation, and Residuals', 4, TRUE)
a<-table.row.end(a)
a<-table.row.start(a)
a<-table.element(a, 'Time or Index', 1, TRUE)
a<-table.element(a, 'Actuals', 1, TRUE)
a<-table.element(a, 'Interpolation
Forecast', 1, TRUE)
a<-table.element(a, 'Residuals
Prediction Error', 1, TRUE)
a<-table.row.end(a)
for (i in 1:n) {
a<-table.row.start(a)
a<-table.element(a,i, 1, TRUE)
a<-table.element(a,x[i])
a<-table.element(a,x[i]-mysum$resid[i])
a<-table.element(a,mysum$resid[i])
a<-table.row.end(a)
}
a<-table.end(a)
table.save(a,file='mytable4.tab')
if (n > n25) {
a<-table.start()
a<-table.row.start(a)
a<-table.element(a,'Goldfeld-Quandt test for Heteroskedasticity',4,TRUE)
a<-table.row.end(a)
a<-table.row.start(a)
a<-table.element(a,'p-values',header=TRUE)
a<-table.element(a,'Alternative Hypothesis',3,header=TRUE)
a<-table.row.end(a)
a<-table.row.start(a)
a<-table.element(a,'breakpoint index',header=TRUE)
a<-table.element(a,'greater',header=TRUE)
a<-table.element(a,'2-sided',header=TRUE)
a<-table.element(a,'less',header=TRUE)
a<-table.row.end(a)
for (mypoint in kp3:nmkm3) {
a<-table.row.start(a)
a<-table.element(a,mypoint,header=TRUE)
a<-table.element(a,gqarr[mypoint-kp3+1,1])
a<-table.element(a,gqarr[mypoint-kp3+1,2])
a<-table.element(a,gqarr[mypoint-kp3+1,3])
a<-table.row.end(a)
}
a<-table.end(a)
table.save(a,file='mytable5.tab')
a<-table.start()
a<-table.row.start(a)
a<-table.element(a,'Meta Analysis of Goldfeld-Quandt test for Heteroskedasticity',4,TRUE)
a<-table.row.end(a)
a<-table.row.start(a)
a<-table.element(a,'Description',header=TRUE)
a<-table.element(a,'# significant tests',header=TRUE)
a<-table.element(a,'% significant tests',header=TRUE)
a<-table.element(a,'OK/NOK',header=TRUE)
a<-table.row.end(a)
a<-table.row.start(a)
a<-table.element(a,'1% type I error level',header=TRUE)
a<-table.element(a,numsignificant1)
a<-table.element(a,numsignificant1/numgqtests)
if (numsignificant1/numgqtests < 0.01) dum <- 'OK' else dum <- 'NOK'
a<-table.element(a,dum)
a<-table.row.end(a)
a<-table.row.start(a)
a<-table.element(a,'5% type I error level',header=TRUE)
a<-table.element(a,numsignificant5)
a<-table.element(a,numsignificant5/numgqtests)
if (numsignificant5/numgqtests < 0.05) dum <- 'OK' else dum <- 'NOK'
a<-table.element(a,dum)
a<-table.row.end(a)
a<-table.row.start(a)
a<-table.element(a,'10% type I error level',header=TRUE)
a<-table.element(a,numsignificant10)
a<-table.element(a,numsignificant10/numgqtests)
if (numsignificant10/numgqtests < 0.1) dum <- 'OK' else dum <- 'NOK'
a<-table.element(a,dum)
a<-table.row.end(a)
a<-table.end(a)
table.save(a,file='mytable6.tab')
}