| Multiple Linear Regression - Estimated Regression Equation |
| Voeding-Mannen[t] = -1163.16083712531 + 2.90769983505941`Landbouw-Mannen`[t] -50.7291223751464M1[t] -214.871464759489M2[t] -125.681135126959M3[t] -125.385774599149M4[t] + 6.32547487764123M5[t] + 182.215203958574M6[t] + 168.449455084770M7[t] + 135.077291917911M8[t] + 30.8732529973186M9[t] -3.65280901495669M10[t] + 74.1754192412731M11[t] + e[t] |
| Multiple Linear Regression - Ordinary Least Squares | |||||
| Variable | Parameter | S.D. | T-STAT H0: parameter = 0 | 2-tail p-value | 1-tail p-value |
| (Intercept) | -1163.16083712531 | 348.945854 | -3.3334 | 0.00168 | 0.00084 |
| `Landbouw-Mannen` | 2.90769983505941 | 0.133016 | 21.8598 | 0 | 0 |
| M1 | -50.7291223751464 | 104.561894 | -0.4852 | 0.629818 | 0.314909 |
| M2 | -214.871464759489 | 105.264338 | -2.0413 | 0.046862 | 0.023431 |
| M3 | -125.681135126959 | 106.451279 | -1.1806 | 0.243684 | 0.121842 |
| M4 | -125.385774599149 | 106.532305 | -1.177 | 0.245132 | 0.122566 |
| M5 | 6.32547487764123 | 105.230571 | 0.0601 | 0.952322 | 0.476161 |
| M6 | 182.215203958574 | 104.593079 | 1.7421 | 0.088026 | 0.044013 |
| M7 | 168.449455084770 | 104.619468 | 1.6101 | 0.114069 | 0.057035 |
| M8 | 135.077291917911 | 104.747325 | 1.2896 | 0.203516 | 0.101758 |
| M9 | 30.8732529973186 | 105.06848 | 0.2938 | 0.770174 | 0.385087 |
| M10 | -3.65280901495669 | 104.919016 | -0.0348 | 0.972374 | 0.486187 |
| M11 | 74.1754192412731 | 104.546139 | 0.7095 | 0.48152 | 0.24076 |
| Multiple Linear Regression - Regression Statistics | |
| Multiple R | 0.957534943039322 |
| R-squared | 0.916873167141318 |
| Adjusted R-squared | 0.89564929492208 |
| F-TEST (value) | 43.2000889220505 |
| F-TEST (DF numerator) | 12 |
| F-TEST (DF denominator) | 47 |
| p-value | 0 |
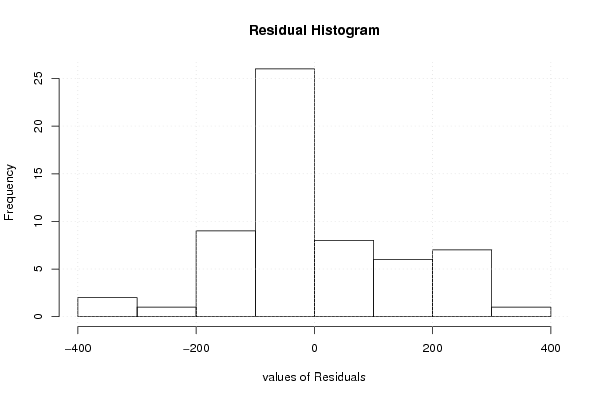
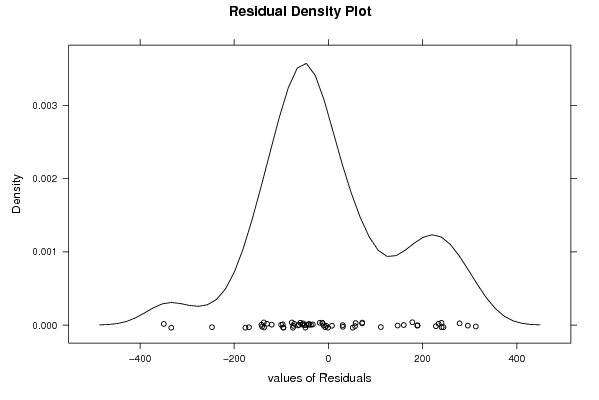
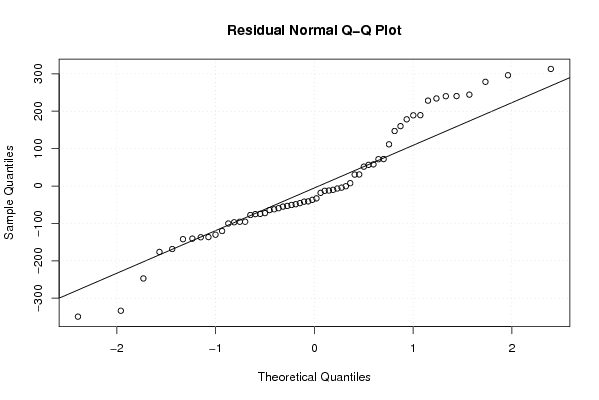
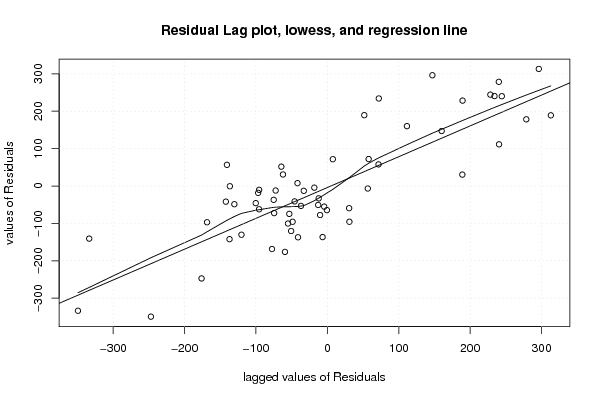
| Multiple Linear Regression - Residual Statistics | |
| Residual Standard Deviation | 165.299129084041 |
| Sum Squared Residuals | 1284218.6975693 |
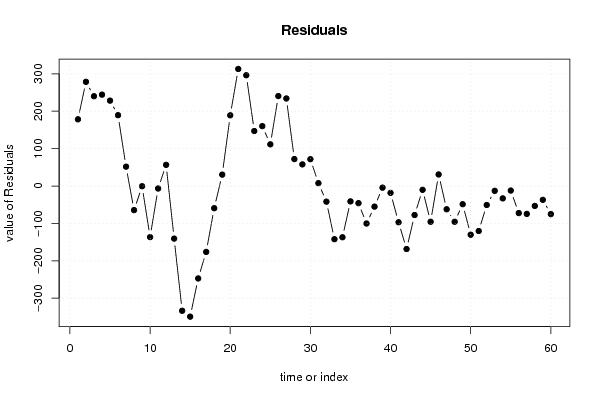
| Multiple Linear Regression - Actuals, Interpolation, and Residuals | |||
| Time or Index | Actuals | Interpolation Forecast | Residuals Prediction Error |
| 1 | 6539 | 6360.66811082931 | 178.331889170690 |
| 2 | 6699 | 6420.41865574453 | 278.581344255468 |
| 3 | 6962 | 6721.8710733364 | 240.1289266636 |
| 4 | 6981 | 6736.70493303951 | 244.295066960493 |
| 5 | 7024 | 6795.72368663981 | 228.276313360188 |
| 6 | 6940 | 6750.62822825623 | 189.37177174377 |
| 7 | 6774 | 6722.32398020713 | 51.6760197928712 |
| 8 | 6671 | 6735.47501440122 | -64.47501440122 |
| 9 | 6965 | 6965.65645651246 | -0.656456512459602 |
| 10 | 6969 | 7105.59238460375 | -136.592384603749 |
| 11 | 6822 | 6828.68123298273 | -6.6812329827309 |
| 12 | 6878 | 6821.38290994782 | 56.6170900521758 |
| 13 | 6691 | 6831.71548410893 | -140.715484108925 |
| 14 | 6837 | 7170.60521318986 | -333.60521318986 |
| 15 | 7018 | 7367.38043671959 | -349.380436719588 |
| 16 | 7167 | 7414.19899460835 | -247.198994608349 |
| 17 | 7076 | 7252.23256074414 | -176.232560744139 |
| 18 | 7171 | 7230.39870104103 | -59.3987010410319 |
| 19 | 7093 | 7062.52486090908 | 30.4751390909204 |
| 20 | 6971 | 6781.99821176217 | 189.001788237830 |
| 21 | 7142 | 6828.99456426467 | 313.005435735333 |
| 22 | 7047 | 6750.8530047265 | 296.146995273499 |
| 23 | 6999 | 6851.94283166321 | 147.057168336794 |
| 24 | 6650 | 6489.90512875105 | 160.094871248948 |
| 25 | 6475 | 6363.57581066436 | 111.424189335639 |
| 26 | 6437 | 6196.52576844496 | 240.474231555042 |
| 27 | 6639 | 6404.93179131492 | 234.068208685075 |
| 28 | 6422 | 6349.9808549766 | 72.0191450233943 |
| 29 | 6272 | 6214.18371962793 | 57.8162803720695 |
| 30 | 6232 | 6160.36516173917 | 71.6348382608299 |
| 31 | 6003 | 5995.39902144228 | 7.60097855772302 |
| 32 | 5673 | 5714.87237229537 | -41.872372295368 |
| 33 | 6050 | 6192.20830038666 | -142.208300386657 |
| 34 | 5977 | 6114.06674084849 | -137.066740848491 |
| 35 | 5796 | 5837.15558922747 | -41.155589227473 |
| 36 | 5752 | 5797.87256800691 | -45.8725680069128 |
| 37 | 5609 | 5709.34334777599 | -100.343347775994 |
| 38 | 5839 | 5894.12498559878 | -55.1249855987801 |
| 39 | 6069 | 6073.45401011815 | -4.45401011815229 |
| 40 | 6006 | 6024.31847344995 | -18.3184734499521 |
| 41 | 5809 | 5905.96753711163 | -96.9675371116334 |
| 42 | 5797 | 5965.54927279019 | -168.549272790190 |
| 43 | 5502 | 5579.59794502878 | -77.5979450287818 |
| 44 | 5568 | 5578.21048004758 | -10.2104800475758 |
| 45 | 5864 | 5959.5923135819 | -95.5923135819047 |
| 46 | 5764 | 5733.15806245571 | 30.8419375442915 |
| 47 | 5615 | 5677.2320982992 | -62.2320982992057 |
| 48 | 5615 | 5710.64157295513 | -95.6415729551306 |
| 49 | 5681 | 5729.69724662141 | -48.69724662141 |
| 50 | 5915 | 6045.32537702187 | -130.325377021869 |
| 51 | 6334 | 6454.36268851093 | -120.362688510935 |
| 52 | 6494 | 6544.79674392559 | -50.796743925586 |
| 53 | 6620 | 6632.89249587649 | -12.8924958764851 |
| 54 | 6578 | 6611.05863617338 | -33.0586361733783 |
| 55 | 6495 | 6507.15419241273 | -12.1541924127327 |
| 56 | 6538 | 6610.44392149367 | -72.4439214936654 |
| 57 | 6737 | 6811.54836525431 | -74.548365254311 |
| 58 | 6651 | 6704.32980736555 | -53.3298073655505 |
| 59 | 6530 | 6566.98824782738 | -36.9882478273842 |
| 60 | 6563 | 6638.19782033908 | -75.1978203390814 |
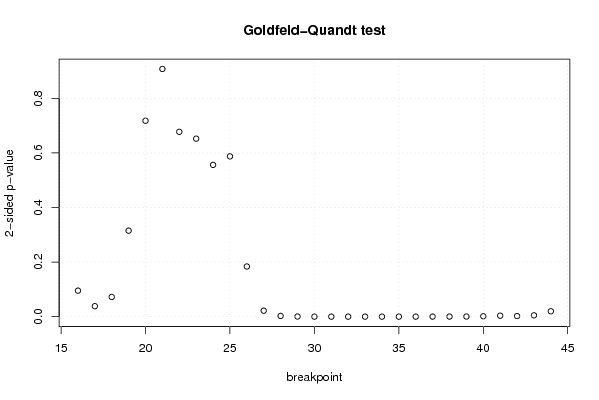
| Goldfeld-Quandt test for Heteroskedasticity | |||
| p-values | Alternative Hypothesis | ||
| breakpoint index | greater | 2-sided | less |
| 16 | 0.0476702023119076 | 0.0953404046238152 | 0.952329797688092 |
| 17 | 0.0191887345156717 | 0.0383774690313433 | 0.980811265484328 |
| 18 | 0.0361302910120639 | 0.0722605820241278 | 0.963869708987936 |
| 19 | 0.157563264761412 | 0.315126529522824 | 0.842436735238588 |
| 20 | 0.35899677750614 | 0.71799355501228 | 0.64100322249386 |
| 21 | 0.54608000328305 | 0.9078399934339 | 0.45391999671695 |
| 22 | 0.661286140539382 | 0.677427718921235 | 0.338713859460618 |
| 23 | 0.67384968763406 | 0.652300624731881 | 0.326150312365941 |
| 24 | 0.721877450015828 | 0.556245099968344 | 0.278122549984172 |
| 25 | 0.706250361830669 | 0.587499276338663 | 0.293749638169331 |
| 26 | 0.908085505790842 | 0.183828988418317 | 0.0919144942091583 |
| 27 | 0.989020471179607 | 0.0219590576407859 | 0.0109795288203930 |
| 28 | 0.998659389749117 | 0.00268122050176562 | 0.00134061025088281 |
| 29 | 0.999794398575635 | 0.000411202848730928 | 0.000205601424365464 |
| 30 | 0.99998671145026 | 2.65770994784890e-05 | 1.32885497392445e-05 |
| 31 | 0.999990100535414 | 1.97989291726649e-05 | 9.89946458633246e-06 |
| 32 | 0.999990336904955 | 1.93261900893075e-05 | 9.66309504465374e-06 |
| 33 | 0.999992477822636 | 1.50443547286259e-05 | 7.52217736431297e-06 |
| 34 | 0.999997007883762 | 5.9842324767305e-06 | 2.99211623836525e-06 |
| 35 | 0.99999057055022 | 1.88588995606006e-05 | 9.4294497803003e-06 |
| 36 | 0.999974645172133 | 5.0709655734324e-05 | 2.5354827867162e-05 |
| 37 | 0.999930501015286 | 0.000138997969427331 | 6.94989847136657e-05 |
| 38 | 0.999836100631809 | 0.000327798736382624 | 0.000163899368191312 |
| 39 | 0.99979826869726 | 0.000403462605481196 | 0.000201731302740598 |
| 40 | 0.999284082323416 | 0.00143183535316707 | 0.000715917676583535 |
| 41 | 0.998222149286572 | 0.00355570142685617 | 0.00177785071342809 |
| 42 | 0.998891919672255 | 0.00221616065549037 | 0.00110808032774518 |
| 43 | 0.997570944731968 | 0.00485811053606496 | 0.00242905526803248 |
| 44 | 0.990143907362887 | 0.0197121852742256 | 0.0098560926371128 |
| Meta Analysis of Goldfeld-Quandt test for Heteroskedasticity | |||
| Description | # significant tests | % significant tests | OK/NOK |
| 1% type I error level | 16 | 0.551724137931034 | NOK |
| 5% type I error level | 19 | 0.655172413793103 | NOK |
| 10% type I error level | 21 | 0.724137931034483 | NOK |