| Multiple Linear Regression - Estimated Regression Equation |
| TotaleIndustrieleProductie[t] = + 109.712666666667 -11.4566666666667X[t] -15.9155000000001M1[t] -26.5496666666667M2[t] -1.42383333333331M3[t] -10.898M4[t] -10.5921666666666M5[t] -4.66633333333331M6[t] -11.4291666666667M7[t] -13.0033333333333M8[t] -13.4775000000000M9[t] -6.11166666666665M10[t] + 0.134166666666678M11[t] + 0.254166666666668t + e[t] |
| Multiple Linear Regression - Ordinary Least Squares | |||||
| Variable | Parameter | S.D. | T-STAT H0: parameter = 0 | 2-tail p-value | 1-tail p-value |
| (Intercept) | 109.712666666667 | 3.086156 | 35.5499 | 0 | 0 |
| X | -11.4566666666667 | 2.646357 | -4.3292 | 8e-05 | 4e-05 |
| M1 | -15.9155000000001 | 3.582234 | -4.4429 | 5.5e-05 | 2.8e-05 |
| M2 | -26.5496666666667 | 3.57612 | -7.4242 | 0 | 0 |
| M3 | -1.42383333333331 | 3.571357 | -0.3987 | 0.691973 | 0.345986 |
| M4 | -10.898 | 3.56795 | -3.0544 | 0.003744 | 0.001872 |
| M5 | -10.5921666666666 | 3.565905 | -2.9704 | 0.004715 | 0.002357 |
| M6 | -4.66633333333331 | 3.565223 | -1.3088 | 0.197087 | 0.098544 |
| M7 | -11.4291666666667 | 3.567542 | -3.2037 | 0.002465 | 0.001233 |
| M8 | -13.0033333333333 | 3.561402 | -3.6512 | 0.000666 | 0.000333 |
| M9 | -13.4775000000000 | 3.556619 | -3.7894 | 0.000437 | 0.000219 |
| M10 | -6.11166666666665 | 3.553199 | -1.72 | 0.092146 | 0.046073 |
| M11 | 0.134166666666678 | 3.551145 | 0.0378 | 0.970026 | 0.485013 |
| t | 0.254166666666668 | 0.069738 | 3.6446 | 0.000679 | 0.000339 |
| Multiple Linear Regression - Regression Statistics | |
| Multiple R | 0.857208457316521 |
| R-squared | 0.73480633929497 |
| Adjusted R-squared | 0.659860304747895 |
| F-TEST (value) | 9.80447256129922 |
| F-TEST (DF numerator) | 13 |
| F-TEST (DF denominator) | 46 |
| p-value | 2.42340281175757e-09 |
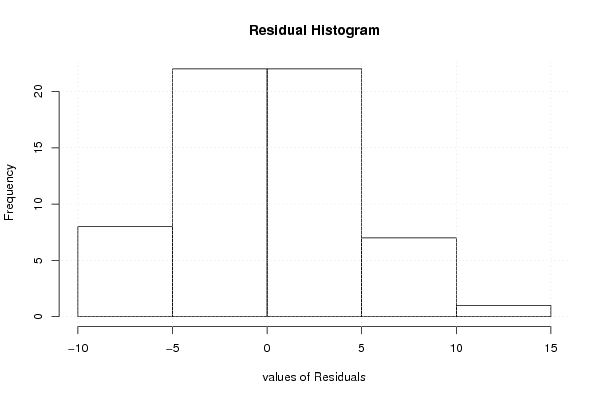
| Multiple Linear Regression - Residual Statistics | |
| Residual Standard Deviation | 5.6137708528587 |
| Sum Squared Residuals | 1449.66346666667 |
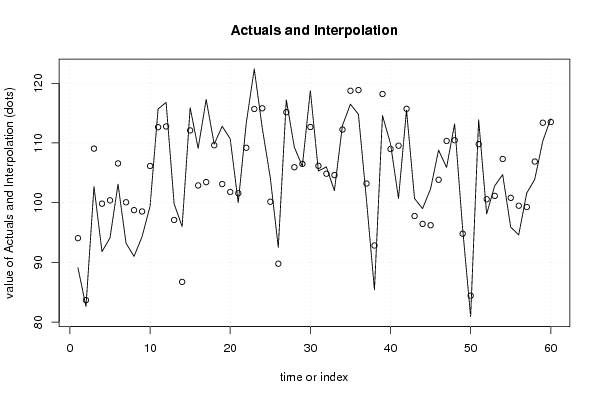
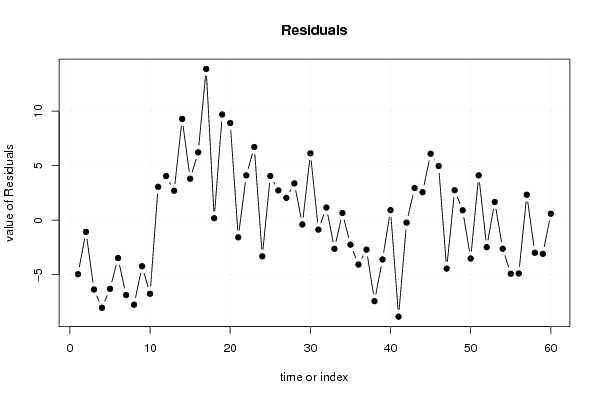
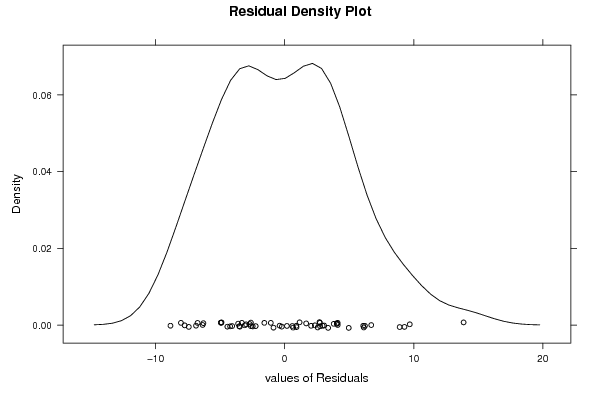
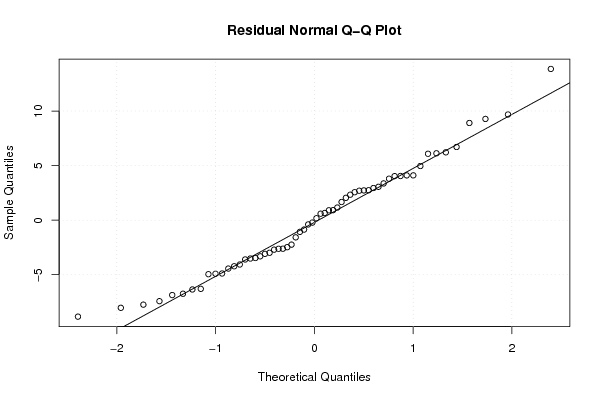
| Multiple Linear Regression - Actuals, Interpolation, and Residuals | |||
| Time or Index | Actuals | Interpolation Forecast | Residuals Prediction Error |
| 1 | 89.1 | 94.0513333333336 | -4.95133333333362 |
| 2 | 82.6 | 83.6713333333333 | -1.07133333333334 |
| 3 | 102.7 | 109.051333333333 | -6.35133333333332 |
| 4 | 91.8 | 99.8313333333333 | -8.0313333333333 |
| 5 | 94.1 | 100.391333333333 | -6.29133333333332 |
| 6 | 103.1 | 106.571333333333 | -3.4713333333333 |
| 7 | 93.2 | 100.062666666667 | -6.86266666666668 |
| 8 | 91 | 98.7426666666667 | -7.74266666666666 |
| 9 | 94.3 | 98.5226666666666 | -4.22266666666664 |
| 10 | 99.4 | 106.142666666667 | -6.74266666666664 |
| 11 | 115.7 | 112.642666666667 | 3.05733333333334 |
| 12 | 116.8 | 112.762666666667 | 4.03733333333336 |
| 13 | 99.8 | 97.1013333333333 | 2.69866666666675 |
| 14 | 96 | 86.7213333333333 | 9.27866666666669 |
| 15 | 115.9 | 112.101333333333 | 3.79866666666668 |
| 16 | 109.1 | 102.881333333333 | 6.21866666666667 |
| 17 | 117.3 | 103.441333333333 | 13.8586666666667 |
| 18 | 109.8 | 109.621333333333 | 0.178666666666672 |
| 19 | 112.8 | 103.112666666667 | 9.68733333333334 |
| 20 | 110.7 | 101.792666666667 | 8.90733333333335 |
| 21 | 100 | 101.572666666667 | -1.57266666666666 |
| 22 | 113.3 | 109.192666666667 | 4.10733333333333 |
| 23 | 122.4 | 115.692666666667 | 6.70733333333334 |
| 24 | 112.5 | 115.812666666667 | -3.31266666666665 |
| 25 | 104.2 | 100.151333333333 | 4.04866666666674 |
| 26 | 92.5 | 89.7713333333333 | 2.72866666666666 |
| 27 | 117.2 | 115.151333333333 | 2.04866666666666 |
| 28 | 109.3 | 105.931333333333 | 3.36866666666666 |
| 29 | 106.1 | 106.491333333333 | -0.391333333333342 |
| 30 | 118.8 | 112.671333333333 | 6.12866666666666 |
| 31 | 105.3 | 106.162666666667 | -0.862666666666674 |
| 32 | 106 | 104.842666666667 | 1.15733333333333 |
| 33 | 102 | 104.622666666667 | -2.62266666666668 |
| 34 | 112.9 | 112.242666666667 | 0.657333333333323 |
| 35 | 116.5 | 118.742666666667 | -2.24266666666668 |
| 36 | 114.8 | 118.862666666667 | -4.06266666666667 |
| 37 | 100.5 | 103.201333333333 | -2.70133333333328 |
| 38 | 85.4 | 92.8213333333334 | -7.42133333333335 |
| 39 | 114.6 | 118.201333333333 | -3.60133333333336 |
| 40 | 109.9 | 108.981333333333 | 0.918666666666654 |
| 41 | 100.7 | 109.541333333333 | -8.84133333333335 |
| 42 | 115.5 | 115.721333333333 | -0.221333333333357 |
| 43 | 100.7 | 97.756 | 2.94400000000001 |
| 44 | 99 | 96.436 | 2.56400000000001 |
| 45 | 102.3 | 96.216 | 6.084 |
| 46 | 108.8 | 103.836 | 4.96399999999999 |
| 47 | 105.9 | 110.336 | -4.43599999999999 |
| 48 | 113.2 | 110.456 | 2.74400000000001 |
| 49 | 95.7 | 94.7946666666666 | 0.905333333333403 |
| 50 | 80.9 | 84.4146666666667 | -3.51466666666666 |
| 51 | 113.9 | 109.794666666667 | 4.10533333333333 |
| 52 | 98.1 | 100.574666666667 | -2.47466666666668 |
| 53 | 102.8 | 101.134666666667 | 1.66533333333333 |
| 54 | 104.7 | 107.314666666667 | -2.61466666666667 |
| 55 | 95.9 | 100.806 | -4.906 |
| 56 | 94.6 | 99.486 | -4.88600000000002 |
| 57 | 101.6 | 99.266 | 2.33399999999998 |
| 58 | 103.9 | 106.886 | -2.98600000000001 |
| 59 | 110.3 | 113.386 | -3.08600000000001 |
| 60 | 114.1 | 113.506 | 0.593999999999992 |
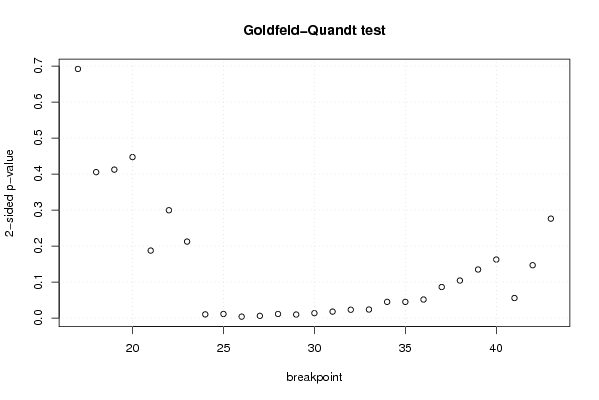
| Goldfeld-Quandt test for Heteroskedasticity | |||
| p-values | Alternative Hypothesis | ||
| breakpoint index | greater | 2-sided | less |
| 17 | 0.654037143263733 | 0.691925713472535 | 0.345962856736267 |
| 18 | 0.797349290720702 | 0.405301418558595 | 0.202650709279297 |
| 19 | 0.79385254113572 | 0.412294917728559 | 0.206147458864279 |
| 20 | 0.776461723399421 | 0.447076553201157 | 0.223538276600579 |
| 21 | 0.906285040792449 | 0.187429918415102 | 0.093714959207551 |
| 22 | 0.850298051724517 | 0.299403896550965 | 0.149701948275483 |
| 23 | 0.893830019364036 | 0.212339961271927 | 0.106169980635964 |
| 24 | 0.994909372752204 | 0.0101812544955916 | 0.00509062724779578 |
| 25 | 0.994374679264144 | 0.0112506414717111 | 0.00562532073585553 |
| 26 | 0.9980879075216 | 0.00382418495680065 | 0.00191209247840032 |
| 27 | 0.996970850608534 | 0.00605829878293114 | 0.00302914939146557 |
| 28 | 0.994367058493369 | 0.0112658830132623 | 0.00563294150663116 |
| 29 | 0.99516645582047 | 0.00966708835906185 | 0.00483354417953092 |
| 30 | 0.993227845940574 | 0.0135443081188529 | 0.00677215405942646 |
| 31 | 0.99110282937804 | 0.0177943412439202 | 0.0088971706219601 |
| 32 | 0.98848855595336 | 0.0230228880932785 | 0.0115114440466393 |
| 33 | 0.988181466545673 | 0.0236370669086538 | 0.0118185334543269 |
| 34 | 0.977543587726243 | 0.0449128245475137 | 0.0224564122737569 |
| 35 | 0.977577219928843 | 0.0448455601423148 | 0.0224227800711574 |
| 36 | 0.974317220473345 | 0.0513655590533091 | 0.0256827795266546 |
| 37 | 0.956948688184412 | 0.0861026236311758 | 0.0430513118155879 |
| 38 | 0.947911687939157 | 0.104176624121687 | 0.0520883120608433 |
| 39 | 0.9326018127078 | 0.134796374584401 | 0.0673981872922007 |
| 40 | 0.91877926090023 | 0.162441478199540 | 0.0812207390997702 |
| 41 | 0.972245074980095 | 0.0555098500398108 | 0.0277549250199054 |
| 42 | 0.92665934132174 | 0.146681317356520 | 0.0733406586782598 |
| 43 | 0.861958948889852 | 0.276082102220296 | 0.138041051110148 |
| Meta Analysis of Goldfeld-Quandt test for Heteroskedasticity | |||
| Description | # significant tests | % significant tests | OK/NOK |
| 1% type I error level | 3 | 0.111111111111111 | NOK |
| 5% type I error level | 12 | 0.444444444444444 | NOK |
| 10% type I error level | 15 | 0.555555555555556 | NOK |