| Multiple Linear Regression - Estimated Regression Equation |
| IndGez[t] = + 3.875 + 0.283333333333334InvlCrisis[t] + e[t] |
| Multiple Linear Regression - Ordinary Least Squares | |||||
| Variable | Parameter | S.D. | T-STAT H0: parameter = 0 | 2-tail p-value | 1-tail p-value |
| (Intercept) | 3.875 | 0.162436 | 23.8556 | 0 | 0 |
| InvlCrisis | 0.283333333333334 | 0.350901 | 0.8074 | 0.422953 | 0.211477 |
| Multiple Linear Regression - Regression Statistics | |
| Multiple R | 0.109221891825004 |
| R-squared | 0.0119294216538329 |
| Adjusted R-squared | -0.0063681816488741 |
| F-TEST (value) | 0.651966350809897 |
| F-TEST (DF numerator) | 1 |
| F-TEST (DF denominator) | 54 |
| p-value | 0.422953016391424 |
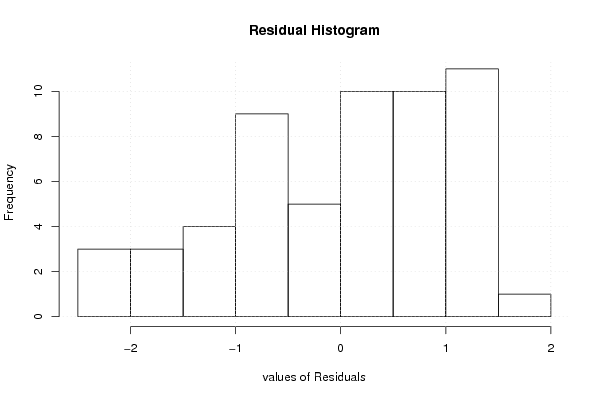
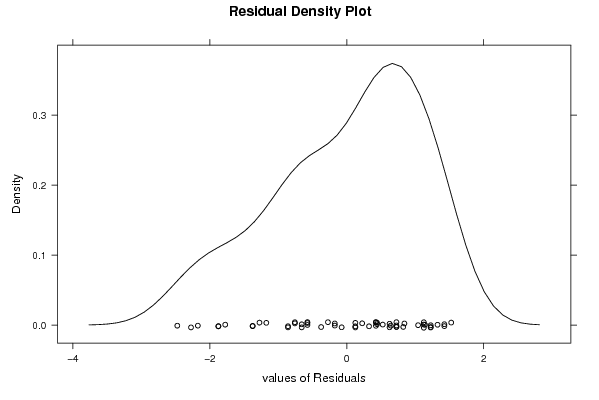
| Multiple Linear Regression - Residual Statistics | |
| Residual Standard Deviation | 1.07747704853675 |
| Sum Squared Residuals | 62.6916666666667 |
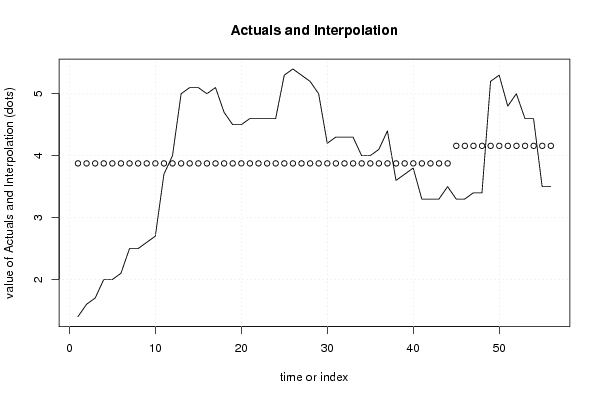
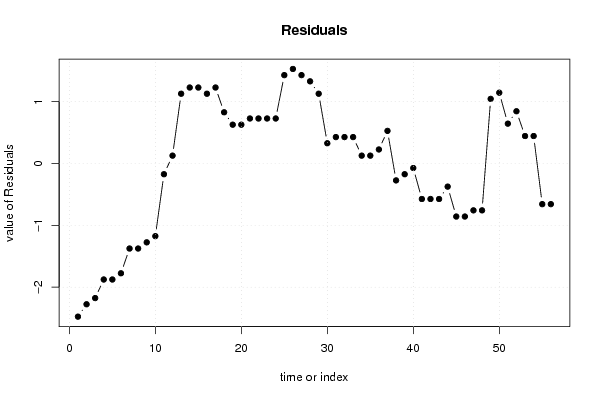
| Multiple Linear Regression - Actuals, Interpolation, and Residuals | |||
| Time or Index | Actuals | Interpolation Forecast | Residuals Prediction Error |
| 1 | 1.4 | 3.87500000000001 | -2.47500000000001 |
| 2 | 1.6 | 3.875 | -2.275 |
| 3 | 1.7 | 3.875 | -2.175 |
| 4 | 2 | 3.875 | -1.875 |
| 5 | 2 | 3.875 | -1.875 |
| 6 | 2.1 | 3.875 | -1.775 |
| 7 | 2.5 | 3.875 | -1.375 |
| 8 | 2.5 | 3.875 | -1.375 |
| 9 | 2.6 | 3.875 | -1.275 |
| 10 | 2.7 | 3.875 | -1.175 |
| 11 | 3.7 | 3.875 | -0.175000000000000 |
| 12 | 4 | 3.875 | 0.125000000000000 |
| 13 | 5 | 3.875 | 1.125 |
| 14 | 5.1 | 3.875 | 1.225 |
| 15 | 5.1 | 3.875 | 1.225 |
| 16 | 5 | 3.875 | 1.125 |
| 17 | 5.1 | 3.875 | 1.225 |
| 18 | 4.7 | 3.875 | 0.825 |
| 19 | 4.5 | 3.875 | 0.625 |
| 20 | 4.5 | 3.875 | 0.625 |
| 21 | 4.6 | 3.875 | 0.725 |
| 22 | 4.6 | 3.875 | 0.725 |
| 23 | 4.6 | 3.875 | 0.725 |
| 24 | 4.6 | 3.875 | 0.725 |
| 25 | 5.3 | 3.875 | 1.425 |
| 26 | 5.4 | 3.875 | 1.525 |
| 27 | 5.3 | 3.875 | 1.425 |
| 28 | 5.2 | 3.875 | 1.325 |
| 29 | 5 | 3.875 | 1.125 |
| 30 | 4.2 | 3.875 | 0.325000000000001 |
| 31 | 4.3 | 3.875 | 0.425 |
| 32 | 4.3 | 3.875 | 0.425 |
| 33 | 4.3 | 3.875 | 0.425 |
| 34 | 4 | 3.875 | 0.125000000000000 |
| 35 | 4 | 3.875 | 0.125000000000000 |
| 36 | 4.1 | 3.875 | 0.225 |
| 37 | 4.4 | 3.875 | 0.525000000000001 |
| 38 | 3.6 | 3.875 | -0.275000000000000 |
| 39 | 3.7 | 3.875 | -0.175000000000000 |
| 40 | 3.8 | 3.875 | -0.075 |
| 41 | 3.3 | 3.875 | -0.575 |
| 42 | 3.3 | 3.875 | -0.575 |
| 43 | 3.3 | 3.875 | -0.575 |
| 44 | 3.5 | 3.875 | -0.375 |
| 45 | 3.3 | 4.15833333333333 | -0.858333333333334 |
| 46 | 3.3 | 4.15833333333333 | -0.858333333333334 |
| 47 | 3.4 | 4.15833333333333 | -0.758333333333334 |
| 48 | 3.4 | 4.15833333333333 | -0.758333333333334 |
| 49 | 5.2 | 4.15833333333333 | 1.04166666666667 |
| 50 | 5.3 | 4.15833333333333 | 1.14166666666667 |
| 51 | 4.8 | 4.15833333333333 | 0.641666666666666 |
| 52 | 5 | 4.15833333333333 | 0.841666666666667 |
| 53 | 4.6 | 4.15833333333333 | 0.441666666666666 |
| 54 | 4.6 | 4.15833333333333 | 0.441666666666666 |
| 55 | 3.5 | 4.15833333333333 | -0.658333333333333 |
| 56 | 3.5 | 4.15833333333333 | -0.658333333333333 |
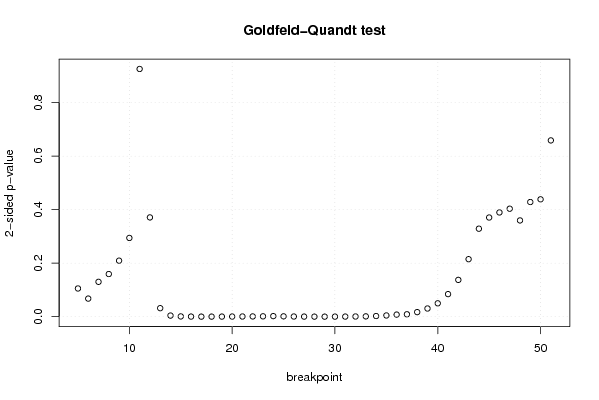
| Goldfeld-Quandt test for Heteroskedasticity | |||
| p-values | Alternative Hypothesis | ||
| breakpoint index | greater | 2-sided | less |
| 5 | 0.0527094398563502 | 0.105418879712700 | 0.94729056014365 |
| 6 | 0.0337942673593572 | 0.0675885347187145 | 0.966205732640643 |
| 7 | 0.0651274295345408 | 0.130254859069082 | 0.934872570465459 |
| 8 | 0.079672604658547 | 0.159345209317094 | 0.920327395341453 |
| 9 | 0.104658246361076 | 0.209316492722153 | 0.895341753638924 |
| 10 | 0.147142636146951 | 0.294285272293902 | 0.85285736385305 |
| 11 | 0.537105652558234 | 0.925788694883531 | 0.462894347441766 |
| 12 | 0.814505527755719 | 0.370988944488562 | 0.185494472244281 |
| 13 | 0.984093402201489 | 0.0318131955970227 | 0.0159065977985114 |
| 14 | 0.997927546090891 | 0.00414490781821724 | 0.00207245390910862 |
| 15 | 0.999518990634363 | 0.000962018731273072 | 0.000481009365636536 |
| 16 | 0.999793172219192 | 0.000413655561617042 | 0.000206827780808521 |
| 17 | 0.999904937626932 | 0.000190124746135890 | 9.50623730679448e-05 |
| 18 | 0.999897062683922 | 0.000205874632155162 | 0.000102937316077581 |
| 19 | 0.99985030189858 | 0.000299396202839092 | 0.000149698101419546 |
| 20 | 0.999773976350987 | 0.000452047298025622 | 0.000226023649012811 |
| 21 | 0.999677606054362 | 0.00064478789127646 | 0.00032239394563823 |
| 22 | 0.999528455746485 | 0.000943088507030053 | 0.000471544253515027 |
| 23 | 0.99929952546569 | 0.00140094906862048 | 0.000700474534310241 |
| 24 | 0.998951243301706 | 0.00209751339658784 | 0.00104875669829392 |
| 25 | 0.999350073335156 | 0.00129985332968868 | 0.000649926664844341 |
| 26 | 0.999692470589756 | 0.000615058820488962 | 0.000307529410244481 |
| 27 | 0.999845106375087 | 0.000309787249826444 | 0.000154893624913222 |
| 28 | 0.999919598240511 | 0.000160803518977141 | 8.04017594885707e-05 |
| 29 | 0.999946197949832 | 0.000107604100335516 | 5.38020501677579e-05 |
| 30 | 0.99988804960212 | 0.000223900795759998 | 0.000111950397879999 |
| 31 | 0.999794128305176 | 0.00041174338964791 | 0.000205871694823955 |
| 32 | 0.999638802830798 | 0.000722394338404971 | 0.000361197169202485 |
| 33 | 0.999399036256876 | 0.00120192748624810 | 0.000600963743124051 |
| 34 | 0.998805590058363 | 0.00238881988327498 | 0.00119440994163749 |
| 35 | 0.997726043414507 | 0.00454791317098571 | 0.00227395658549285 |
| 36 | 0.996118034545108 | 0.00776393090978416 | 0.00388196545489208 |
| 37 | 0.995523032779726 | 0.00895393444054715 | 0.00447696722027357 |
| 38 | 0.99148247102881 | 0.0170350579423808 | 0.0085175289711904 |
| 39 | 0.984731123935926 | 0.0305377521281481 | 0.0152688760640740 |
| 40 | 0.975039507185397 | 0.0499209856292067 | 0.0249604928146034 |
| 41 | 0.957803852785228 | 0.084392294429545 | 0.0421961472147725 |
| 42 | 0.931238380912248 | 0.137523238175505 | 0.0687616190877525 |
| 43 | 0.892567873156454 | 0.214864253687092 | 0.107432126843546 |
| 44 | 0.835594126956946 | 0.328811746086107 | 0.164405873043054 |
| 45 | 0.814712316751411 | 0.370575366497179 | 0.185287683248589 |
| 46 | 0.805202202511108 | 0.389595594977785 | 0.194797797488893 |
| 47 | 0.798258124661317 | 0.403483750677367 | 0.201741875338684 |
| 48 | 0.820167897988967 | 0.359664204022065 | 0.179832102011033 |
| 49 | 0.785793418115662 | 0.428413163768677 | 0.214206581884338 |
| 50 | 0.780699374929222 | 0.438601250141556 | 0.219300625070778 |
| 51 | 0.670612407669893 | 0.658775184660214 | 0.329387592330107 |
| Meta Analysis of Goldfeld-Quandt test for Heteroskedasticity | |||
| Description | # significant tests | % significant tests | OK/NOK |
| 1% type I error level | 24 | 0.51063829787234 | NOK |
| 5% type I error level | 28 | 0.595744680851064 | NOK |
| 10% type I error level | 30 | 0.638297872340426 | NOK |