| Multiple Linear Regression - Estimated Regression Equation |
| Totind[t] = + 59.9181251189299 + 0.494158060055627Bouw[t] + e[t] |
| Multiple Linear Regression - Ordinary Least Squares | |||||
| Variable | Parameter | S.D. | T-STAT H0: parameter = 0 | 2-tail p-value | 1-tail p-value |
| (Intercept) | 59.9181251189299 | 3.602081 | 16.6343 | 0 | 0 |
| Bouw | 0.494158060055627 | 0.039156 | 12.6204 | 0 | 0 |
| Multiple Linear Regression - Regression Statistics | |
| Multiple R | 0.856186966701773 |
| R-squared | 0.733056121949982 |
| Adjusted R-squared | 0.728453641293947 |
| F-TEST (value) | 159.274134262530 |
| F-TEST (DF numerator) | 1 |
| F-TEST (DF denominator) | 58 |
| p-value | 0 |
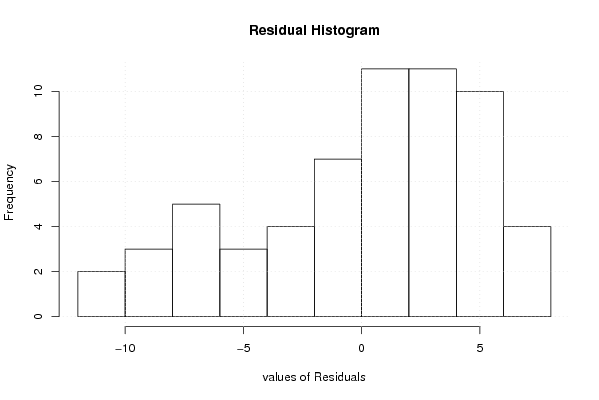
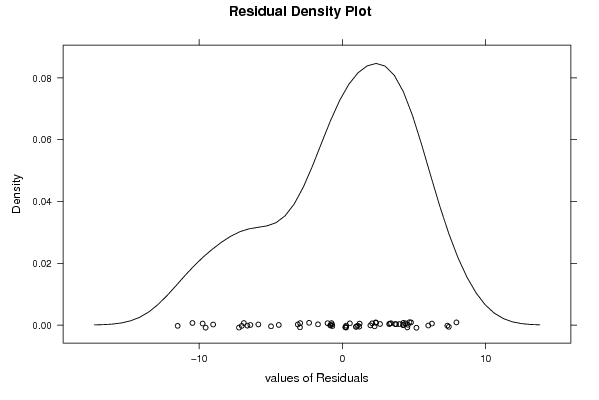
| Multiple Linear Regression - Residual Statistics | |
| Residual Standard Deviation | 4.93290987300361 |
| Sum Squared Residuals | 1411.34878928024 |
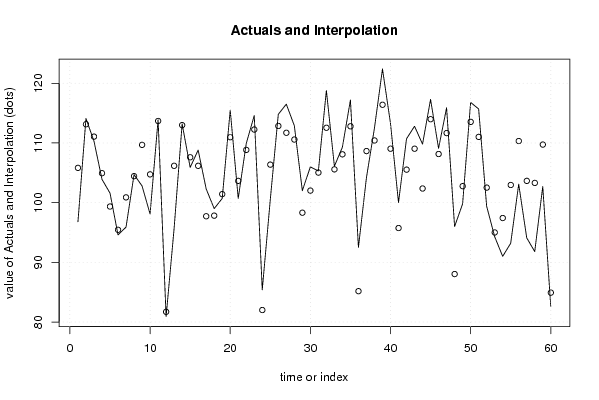
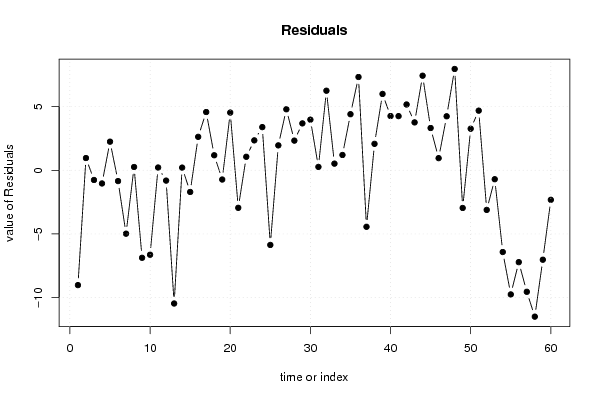
| Multiple Linear Regression - Actuals, Interpolation, and Residuals | |||
| Time or Index | Actuals | Interpolation Forecast | Residuals Prediction Error |
| 1 | 96.8 | 105.825408898098 | -9.02540889809781 |
| 2 | 114.1 | 113.138948186921 | 0.961051813079056 |
| 3 | 110.3 | 111.063484334687 | -0.763484334687316 |
| 4 | 103.9 | 104.935924389998 | -1.03592438999753 |
| 5 | 101.6 | 99.351938311369 | 2.24806168863105 |
| 6 | 94.6 | 95.4480896369295 | -0.848089636929504 |
| 7 | 95.9 | 100.883828297541 | -4.98382829754139 |
| 8 | 104.7 | 104.441766329942 | 0.258233670058096 |
| 9 | 102.8 | 109.679841766532 | -6.87984176653156 |
| 10 | 98.1 | 104.738261165975 | -6.63826116597529 |
| 11 | 113.9 | 113.682522052982 | 0.21747794701787 |
| 12 | 80.9 | 81.710495567383 | -0.810495567383055 |
| 13 | 95.7 | 106.171319540137 | -10.4713195401366 |
| 14 | 113.2 | 112.990700768904 | 0.209299231095741 |
| 15 | 105.9 | 107.604377914298 | -1.70437791429792 |
| 16 | 108.8 | 106.171319540137 | 2.62868045986340 |
| 17 | 102.3 | 97.7212167131854 | 4.57878328681462 |
| 18 | 99 | 97.8200483251965 | 1.17995167480349 |
| 19 | 100.7 | 101.427402163603 | -0.727402163602581 |
| 20 | 115.5 | 110.964652722676 | 4.53534727732381 |
| 21 | 100.7 | 103.651113433853 | -2.95111343385290 |
| 22 | 109.9 | 108.839773064437 | 1.06022693556301 |
| 23 | 114.6 | 112.249463678821 | 2.35053632117917 |
| 24 | 85.4 | 82.0069904034164 | 3.39300959658357 |
| 25 | 100.5 | 106.368982764159 | -5.86898276415886 |
| 26 | 114.8 | 112.842453350888 | 1.95754664911243 |
| 27 | 116.5 | 111.705889812760 | 4.79411018724037 |
| 28 | 112.9 | 110.569326274632 | 2.33067372536832 |
| 29 | 102 | 98.3142063852521 | 3.68579361474787 |
| 30 | 106 | 102.020391835669 | 3.97960816433066 |
| 31 | 105.3 | 105.034756002009 | 0.265243997991337 |
| 32 | 118.8 | 112.545958514854 | 6.2540414851458 |
| 33 | 106.1 | 105.578329868070 | 0.52167013193014 |
| 34 | 109.3 | 108.098535974354 | 1.20146402564645 |
| 35 | 117.2 | 112.793037544882 | 4.40696245511799 |
| 36 | 92.5 | 85.1696019877725 | 7.33039801222755 |
| 37 | 104.2 | 108.642109840415 | -4.44210984041473 |
| 38 | 112.5 | 110.421078856615 | 2.078921143385 |
| 39 | 122.4 | 116.400391383288 | 5.99960861671192 |
| 40 | 113.3 | 109.037436288459 | 4.26256371154075 |
| 41 | 100 | 95.7445844729629 | 4.25541552703713 |
| 42 | 110.7 | 105.528914062064 | 5.17108593793572 |
| 43 | 112.8 | 109.037436288459 | 3.76256371154075 |
| 44 | 109.8 | 102.366302477708 | 7.43369752229172 |
| 45 | 117.3 | 113.979016889016 | 3.32098311098448 |
| 46 | 109.1 | 108.147951780359 | 0.952048219640884 |
| 47 | 115.9 | 111.656474006754 | 4.24352599324594 |
| 48 | 96 | 88.0357187360951 | 7.96428126390491 |
| 49 | 99.8 | 102.761628925753 | -2.96162892575278 |
| 50 | 116.8 | 113.534274634965 | 3.26572536503455 |
| 51 | 115.7 | 111.014068528682 | 4.68593147131825 |
| 52 | 99.4 | 102.514549895725 | -3.11454989572496 |
| 53 | 94.3 | 95.0033473828794 | -0.703347382879434 |
| 54 | 91 | 97.424721877152 | -6.42472187715201 |
| 55 | 93.2 | 102.959292149775 | -9.75929214977502 |
| 56 | 103.1 | 110.322247244604 | -7.22224724460388 |
| 57 | 94.1 | 103.651113433853 | -9.55111343385291 |
| 58 | 91.8 | 103.305202791814 | -11.5052027918140 |
| 59 | 102.7 | 109.729257572537 | -7.02925757253712 |
| 60 | 82.6 | 84.9225229577446 | -2.32252295774464 |
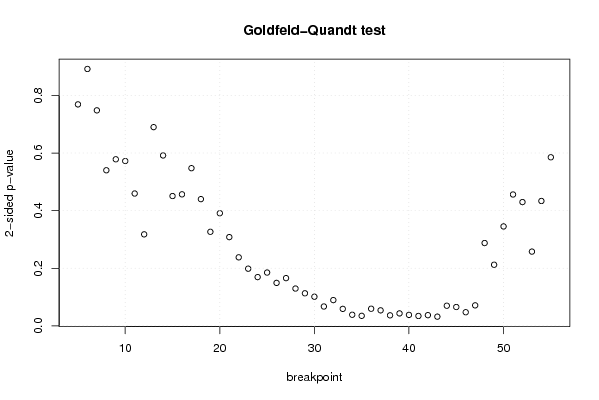
| Goldfeld-Quandt test for Heteroskedasticity | |||
| p-values | Alternative Hypothesis | ||
| breakpoint index | greater | 2-sided | less |
| 5 | 0.615546064036884 | 0.768907871926231 | 0.384453935963116 |
| 6 | 0.445983508389495 | 0.891967016778989 | 0.554016491610505 |
| 7 | 0.374125733713701 | 0.748251467427403 | 0.625874266286299 |
| 8 | 0.270109750369982 | 0.540219500739963 | 0.729890249630018 |
| 9 | 0.289169187052795 | 0.57833837410559 | 0.710830812947205 |
| 10 | 0.286125977184051 | 0.572251954368103 | 0.713874022815949 |
| 11 | 0.229738792944707 | 0.459477585889414 | 0.770261207055293 |
| 12 | 0.158874603256543 | 0.317749206513085 | 0.841125396743457 |
| 13 | 0.344979829300885 | 0.68995965860177 | 0.655020170699115 |
| 14 | 0.295807938248181 | 0.591615876496362 | 0.704192061751819 |
| 15 | 0.225352803096728 | 0.450705606193456 | 0.774647196903272 |
| 16 | 0.228357395941746 | 0.456714791883491 | 0.771642604058254 |
| 17 | 0.273704072649988 | 0.547408145299975 | 0.726295927350012 |
| 18 | 0.220011523707733 | 0.440023047415467 | 0.779988476292267 |
| 19 | 0.163296624874863 | 0.326593249749726 | 0.836703375125137 |
| 20 | 0.195520810082760 | 0.391041620165520 | 0.80447918991724 |
| 21 | 0.154068032698131 | 0.308136065396263 | 0.845931967301869 |
| 22 | 0.118990154050549 | 0.237980308101097 | 0.881009845949451 |
| 23 | 0.0992525341234844 | 0.198505068246969 | 0.900747465876516 |
| 24 | 0.0846574150731824 | 0.169314830146365 | 0.915342584926818 |
| 25 | 0.0925366081772324 | 0.185073216354465 | 0.907463391822768 |
| 26 | 0.0745975014864312 | 0.149195002972862 | 0.925402498513569 |
| 27 | 0.082904869708018 | 0.165809739416036 | 0.917095130291982 |
| 28 | 0.0647833598511365 | 0.129566719702273 | 0.935216640148864 |
| 29 | 0.0565245537946615 | 0.113049107589323 | 0.943475446205339 |
| 30 | 0.0505725550115556 | 0.101145110023111 | 0.949427444988444 |
| 31 | 0.0336252975771566 | 0.0672505951543133 | 0.966374702422843 |
| 32 | 0.0447237956658827 | 0.0894475913317654 | 0.955276204334117 |
| 33 | 0.0295029248099291 | 0.0590058496198582 | 0.97049707519007 |
| 34 | 0.0192835424840967 | 0.0385670849681934 | 0.980716457515903 |
| 35 | 0.0174066384498570 | 0.0348132768997139 | 0.982593361550143 |
| 36 | 0.0297246812463599 | 0.0594493624927198 | 0.97027531875364 |
| 37 | 0.0269691076594302 | 0.0539382153188605 | 0.97303089234057 |
| 38 | 0.0182923802583329 | 0.0365847605166658 | 0.981707619741667 |
| 39 | 0.0216600895254156 | 0.0433201790508313 | 0.978339910474584 |
| 40 | 0.0190354678808942 | 0.0380709357617885 | 0.980964532119106 |
| 41 | 0.0171786152992522 | 0.0343572305985044 | 0.982821384700748 |
| 42 | 0.0185710939621887 | 0.0371421879243774 | 0.981428906037811 |
| 43 | 0.0159950569028705 | 0.031990113805741 | 0.98400494309713 |
| 44 | 0.0349346064746468 | 0.0698692129492935 | 0.965065393525353 |
| 45 | 0.0327132815239354 | 0.0654265630478707 | 0.967286718476065 |
| 46 | 0.0236876958078819 | 0.0473753916157638 | 0.976312304192118 |
| 47 | 0.0356208538091681 | 0.0712417076183363 | 0.964379146190832 |
| 48 | 0.143736175209477 | 0.287472350418954 | 0.856263824790523 |
| 49 | 0.106086757072659 | 0.212173514145318 | 0.893913242927341 |
| 50 | 0.172586591945979 | 0.345173183891957 | 0.827413408054021 |
| 51 | 0.771947192971107 | 0.456105614057787 | 0.228052807028893 |
| 52 | 0.785106426258967 | 0.429787147482066 | 0.214893573741033 |
| 53 | 0.871074697498484 | 0.257850605003031 | 0.128925302501516 |
| 54 | 0.78321669675952 | 0.43356660648096 | 0.21678330324048 |
| 55 | 0.707327340588216 | 0.585345318823568 | 0.292672659411784 |
| Meta Analysis of Goldfeld-Quandt test for Heteroskedasticity | |||
| Description | # significant tests | % significant tests | OK/NOK |
| 1% type I error level | 0 | 0 | OK |
| 5% type I error level | 9 | 0.176470588235294 | NOK |
| 10% type I error level | 17 | 0.333333333333333 | NOK |