| Multiple Linear Regression - Estimated Regression Equation |
| Y[t] = + 0.252734874848809 -0.80413602302362X[t] + 0.865561772779888Y1[t] + 0.00859069835627082t + e[t] |
| Multiple Linear Regression - Ordinary Least Squares | |||||
| Variable | Parameter | S.D. | T-STAT H0: parameter = 0 | 2-tail p-value | 1-tail p-value |
| (Intercept) | 0.252734874848809 | 0.045219 | 5.5891 | 1e-06 | 0 |
| X | -0.80413602302362 | 0.070863 | -11.3478 | 0 | 0 |
| Y1 | 0.865561772779888 | 0.018757 | 46.1468 | 0 | 0 |
| t | 0.00859069835627082 | 0.001465 | 5.8646 | 0 | 0 |
| Multiple Linear Regression - Regression Statistics | |
| Multiple R | 0.996265720835123 |
| R-squared | 0.992545386511127 |
| Adjusted R-squared | 0.992138771229916 |
| F-TEST (value) | 2440.99381497532 |
| F-TEST (DF numerator) | 3 |
| F-TEST (DF denominator) | 55 |
| p-value | 0 |
| Multiple Linear Regression - Residual Statistics | |
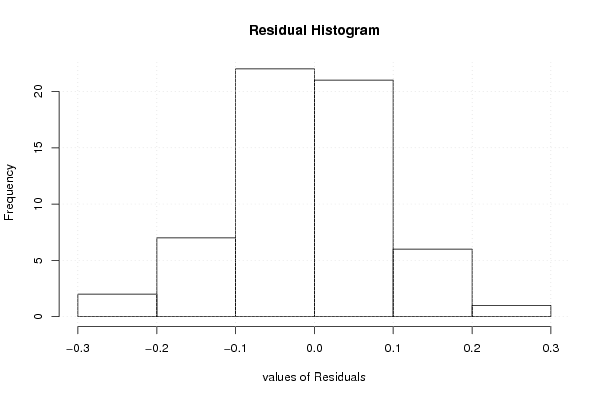
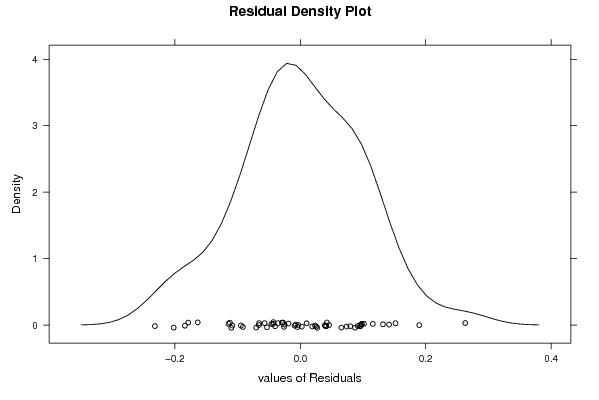
| Residual Standard Deviation | 0.101479087661148 |
| Sum Squared Residuals | 0.566390287789648 |
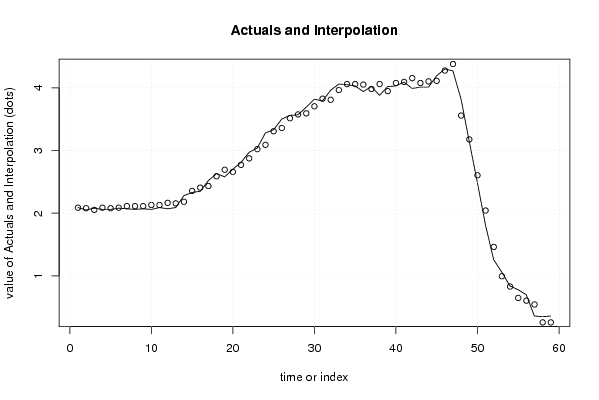
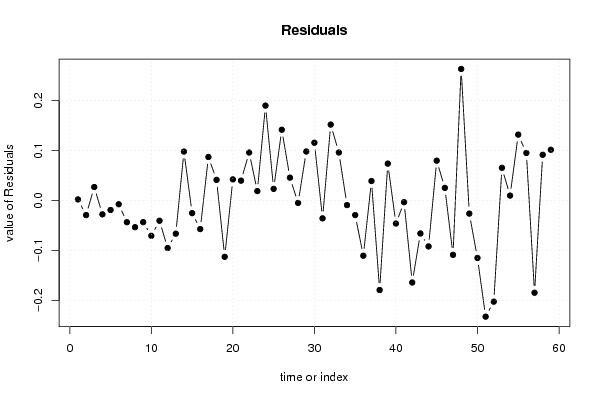
| Multiple Linear Regression - Actuals, Interpolation, and Residuals | |||
| Time or Index | Actuals | Interpolation Forecast | Residuals Prediction Error |
| 1 | 2.09 | 2.08766091377065 | 0.00233908622935031 |
| 2 | 2.05 | 2.07894037667132 | -0.0289403766713187 |
| 3 | 2.08 | 2.05290860411639 | 0.0270913958836053 |
| 4 | 2.06 | 2.08746615565606 | -0.0274661556560608 |
| 5 | 2.06 | 2.07874561855673 | -0.0187456185567337 |
| 6 | 2.08 | 2.08733631691300 | -0.00733631691300454 |
| 7 | 2.07 | 2.11323825072487 | -0.0432382507248734 |
| 8 | 2.06 | 2.11317333135334 | -0.0531733313533449 |
| 9 | 2.07 | 2.11310841198182 | -0.0431084119818172 |
| 10 | 2.06 | 2.13035472806589 | -0.0703547280658865 |
| 11 | 2.09 | 2.13028980869436 | -0.0402898086943589 |
| 12 | 2.07 | 2.16484736023403 | -0.094847360234026 |
| 13 | 2.09 | 2.1561268231347 | -0.0661268231346992 |
| 14 | 2.28 | 2.18202875694657 | 0.0979712430534322 |
| 15 | 2.33 | 2.35507619213102 | -0.0250761921310170 |
| 16 | 2.35 | 2.40694497912628 | -0.0569449791262825 |
| 17 | 2.52 | 2.43284691293815 | 0.0871530870618489 |
| 18 | 2.63 | 2.58858311266700 | 0.0414168873329971 |
| 19 | 2.58 | 2.69238560602906 | -0.112385606029061 |
| 20 | 2.7 | 2.65769821574634 | 0.0423017842536624 |
| 21 | 2.81 | 2.77015632683620 | 0.0398436731638048 |
| 22 | 2.97 | 2.87395882019825 | 0.0960411798017466 |
| 23 | 3.04 | 3.02103940219931 | 0.0189605978006934 |
| 24 | 3.28 | 3.09021942465017 | 0.189780575349830 |
| 25 | 3.33 | 3.30654494847361 | 0.0234550515263869 |
| 26 | 3.5 | 3.35841373546888 | 0.141586264531121 |
| 27 | 3.56 | 3.51414993519773 | 0.0458500648022698 |
| 28 | 3.57 | 3.57467433992079 | -0.00467433992079452 |
| 29 | 3.69 | 3.59192065600486 | 0.0980793439951361 |
| 30 | 3.82 | 3.70437876709472 | 0.115621232905279 |
| 31 | 3.79 | 3.82549249591238 | -0.0354924959123775 |
| 32 | 3.96 | 3.80811634108525 | 0.151883658914748 |
| 33 | 4.06 | 3.9638525408141 | 0.096147459185896 |
| 34 | 4.05 | 4.05899941644836 | -0.00899941644836286 |
| 35 | 4.03 | 4.05893449707683 | -0.0289344970768345 |
| 36 | 3.94 | 4.05021395997751 | -0.110213959977508 |
| 37 | 4.02 | 3.98090409878359 | 0.0390959012164106 |
| 38 | 3.88 | 4.05873973896225 | -0.178739738962251 |
| 39 | 4.02 | 3.94615178912934 | 0.0738482108706624 |
| 40 | 4.03 | 4.07592113567479 | -0.0459211356747917 |
| 41 | 4.09 | 4.09316745175886 | -0.00316745175886247 |
| 42 | 3.99 | 4.15369185648193 | -0.163691856481926 |
| 43 | 4.01 | 4.07572637756021 | -0.0657263775602087 |
| 44 | 4.01 | 4.10162831137208 | -0.0916283113720769 |
| 45 | 4.19 | 4.11021900972835 | 0.0797809902716529 |
| 46 | 4.3 | 4.274610827185 | 0.0253891728150011 |
| 47 | 4.27 | 4.37841332054706 | -0.108413320547057 |
| 48 | 3.82 | 3.55690114269631 | 0.26309885730369 |
| 49 | 3.15 | 3.17598904330163 | -0.0259890433016315 |
| 50 | 2.49 | 2.60465335389538 | -0.114653353895377 |
| 51 | 1.81 | 2.04197328221692 | -0.231973282216922 |
| 52 | 1.26 | 1.46198197508287 | -0.201981975082869 |
| 53 | 1.06 | 0.994513698410202 | 0.0654863015897982 |
| 54 | 0.84 | 0.829992042210495 | 0.0100079577895047 |
| 55 | 0.78 | 0.64815915055519 | 0.131840849444809 |
| 56 | 0.7 | 0.604816142544668 | 0.0951838574553317 |
| 57 | 0.36 | 0.544161899078548 | -0.184161899078548 |
| 58 | 0.35 | 0.258461594689657 | 0.0915384053103433 |
| 59 | 0.36 | 0.258396675318129 | 0.101603324681871 |
| Goldfeld-Quandt test for Heteroskedasticity | |||
| p-values | Alternative Hypothesis | ||
| breakpoint index | greater | 2-sided | less |
| 7 | 0.00845704609728774 | 0.0169140921945755 | 0.991542953902712 |
| 8 | 0.00132041742828532 | 0.00264083485657064 | 0.998679582571715 |
| 9 | 0.000191596592842584 | 0.000383193185685168 | 0.999808403407157 |
| 10 | 2.56453403692804e-05 | 5.12906807385607e-05 | 0.99997435465963 |
| 11 | 1.04763752144645e-05 | 2.09527504289289e-05 | 0.999989523624786 |
| 12 | 1.56333470366407e-06 | 3.12666940732814e-06 | 0.999998436665296 |
| 13 | 4.05246149306026e-07 | 8.10492298612051e-07 | 0.99999959475385 |
| 14 | 0.00887519845222265 | 0.0177503969044453 | 0.991124801547777 |
| 15 | 0.00416232499581136 | 0.00832464999162271 | 0.995837675004189 |
| 16 | 0.00223819733157385 | 0.0044763946631477 | 0.997761802668426 |
| 17 | 0.00411987210470433 | 0.00823974420940865 | 0.995880127895296 |
| 18 | 0.00186275479756203 | 0.00372550959512405 | 0.998137245202438 |
| 19 | 0.00790686211078896 | 0.0158137242215779 | 0.992093137889211 |
| 20 | 0.00555646416743298 | 0.0111129283348660 | 0.994443535832567 |
| 21 | 0.00325767959881975 | 0.00651535919763951 | 0.99674232040118 |
| 22 | 0.00237739588143147 | 0.00475479176286294 | 0.997622604118569 |
| 23 | 0.00142430612284783 | 0.00284861224569566 | 0.998575693877152 |
| 24 | 0.00277319321348477 | 0.00554638642696955 | 0.997226806786515 |
| 25 | 0.00256428856806164 | 0.00512857713612329 | 0.997435711431938 |
| 26 | 0.00159557600083858 | 0.00319115200167717 | 0.998404423999161 |
| 27 | 0.00114931597347746 | 0.00229863194695493 | 0.998850684026523 |
| 28 | 0.00129682730436169 | 0.00259365460872337 | 0.998703172695638 |
| 29 | 0.000670662874955207 | 0.00134132574991041 | 0.999329337125045 |
| 30 | 0.000381397835594182 | 0.000762795671188364 | 0.999618602164406 |
| 31 | 0.000670040546743614 | 0.00134008109348723 | 0.999329959453256 |
| 32 | 0.000701902023774788 | 0.00140380404754958 | 0.999298097976225 |
| 33 | 0.000515911770282785 | 0.00103182354056557 | 0.999484088229717 |
| 34 | 0.000556567315492352 | 0.00111313463098470 | 0.999443432684508 |
| 35 | 0.000599311140237335 | 0.00119862228047467 | 0.999400688859763 |
| 36 | 0.00156867146671554 | 0.00313734293343108 | 0.998431328533284 |
| 37 | 0.00109368264394095 | 0.0021873652878819 | 0.99890631735606 |
| 38 | 0.00541064860252408 | 0.0108212972050482 | 0.994589351397476 |
| 39 | 0.00501579929741831 | 0.0100315985948366 | 0.994984200702582 |
| 40 | 0.00356484984822628 | 0.00712969969645255 | 0.996435150151774 |
| 41 | 0.00269341655398726 | 0.00538683310797453 | 0.997306583446013 |
| 42 | 0.00412240975639714 | 0.00824481951279428 | 0.995877590243603 |
| 43 | 0.00239464251005516 | 0.00478928502011032 | 0.997605357489945 |
| 44 | 0.00147867284087031 | 0.00295734568174063 | 0.99852132715913 |
| 45 | 0.00155670064645438 | 0.00311340129290877 | 0.998443299353546 |
| 46 | 0.00120225756749505 | 0.00240451513499009 | 0.998797742432505 |
| 47 | 0.000721054708588349 | 0.00144210941717670 | 0.999278945291412 |
| 48 | 0.0144139611504366 | 0.0288279223008732 | 0.985586038849563 |
| 49 | 0.0457665677024691 | 0.0915331354049383 | 0.95423343229753 |
| 50 | 0.143222207450501 | 0.286444414901002 | 0.856777792549499 |
| 51 | 0.212644394908250 | 0.425288789816501 | 0.78735560509175 |
| 52 | 0.144795109041367 | 0.289590218082733 | 0.855204890958633 |
| Meta Analysis of Goldfeld-Quandt test for Heteroskedasticity | |||
| Description | # significant tests | % significant tests | OK/NOK |
| 1% type I error level | 35 | 0.760869565217391 | NOK |
| 5% type I error level | 42 | 0.91304347826087 | NOK |
| 10% type I error level | 43 | 0.934782608695652 | NOK |