| Multiple Linear Regression - Estimated Regression Equation |
| Y[t] = + 115.812666666667 -3.83166666666665X[t] -17.1863333333334M1[t] -27.5663333333333M2[t] -2.18633333333331M3[t] -11.4063333333333M4[t] -10.8463333333333M5[t] -4.66633333333331M6[t] -12.7M7[t] -14.02M8[t] -14.2400000000000M9[t] -6.61999999999998M10[t] -0.119999999999988M11[t] + e[t] |
| Multiple Linear Regression - Ordinary Least Squares | |||||
| Variable | Parameter | S.D. | T-STAT H0: parameter = 0 | 2-tail p-value | 1-tail p-value |
| (Intercept) | 115.812666666667 | 2.912064 | 39.77 | 0 | 0 |
| X | -3.83166666666665 | 1.82004 | -2.1053 | 0.04064 | 0.02032 |
| M1 | -17.1863333333334 | 4.004088 | -4.2922 | 8.8e-05 | 4.4e-05 |
| M2 | -27.5663333333333 | 4.004088 | -6.8845 | 0 | 0 |
| M3 | -2.18633333333331 | 4.004088 | -0.546 | 0.587631 | 0.293816 |
| M4 | -11.4063333333333 | 4.004088 | -2.8487 | 0.006495 | 0.003247 |
| M5 | -10.8463333333333 | 4.004088 | -2.7088 | 0.00939 | 0.004695 |
| M6 | -4.66633333333331 | 4.004088 | -1.1654 | 0.249741 | 0.12487 |
| M7 | -12.7 | 3.987508 | -3.1849 | 0.002571 | 0.001285 |
| M8 | -14.02 | 3.987508 | -3.516 | 0.000982 | 0.000491 |
| M9 | -14.2400000000000 | 3.987508 | -3.5712 | 0.000833 | 0.000416 |
| M10 | -6.61999999999998 | 3.987508 | -1.6602 | 0.103536 | 0.051768 |
| M11 | -0.119999999999988 | 3.987508 | -0.0301 | 0.97612 | 0.48806 |
| Multiple Linear Regression - Regression Statistics | |
| Multiple R | 0.811312278579426 |
| R-squared | 0.65822761337374 |
| Adjusted R-squared | 0.57096657849044 |
| F-TEST (value) | 7.54320200595867 |
| F-TEST (DF numerator) | 12 |
| F-TEST (DF denominator) | 47 |
| p-value | 1.64426027238207e-07 |
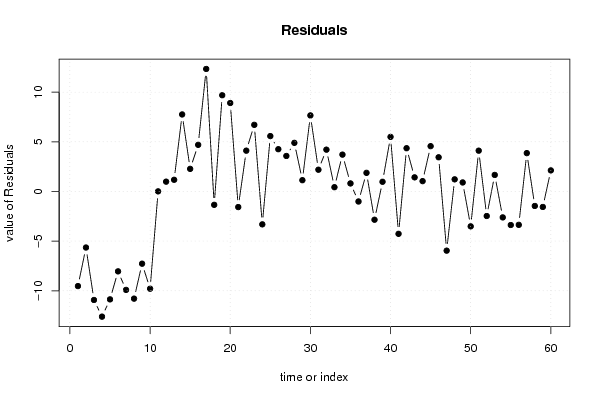
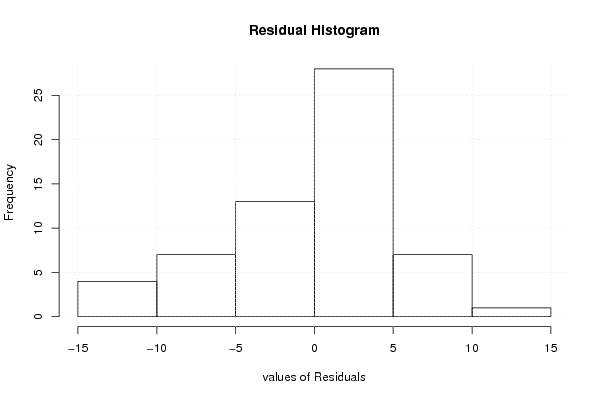
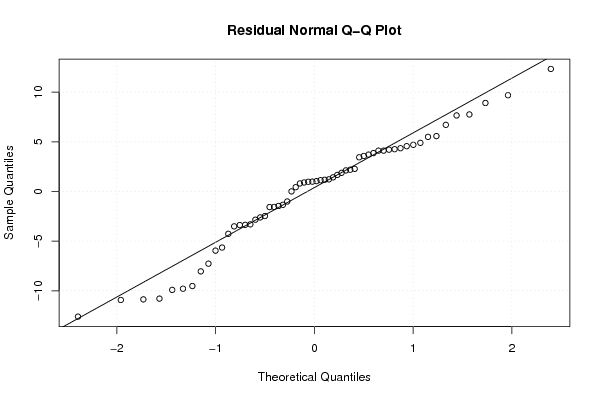
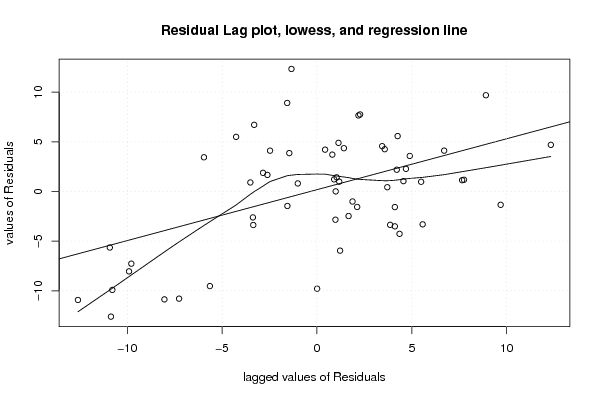
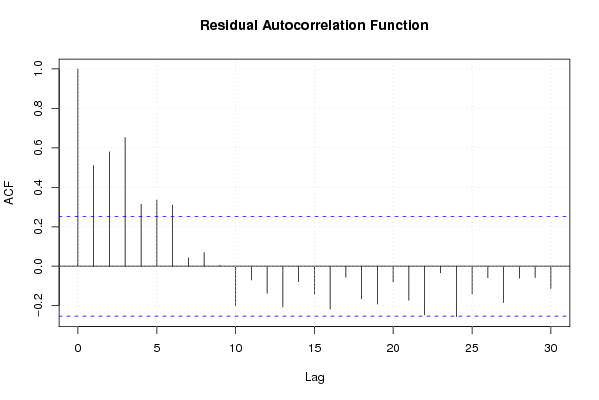
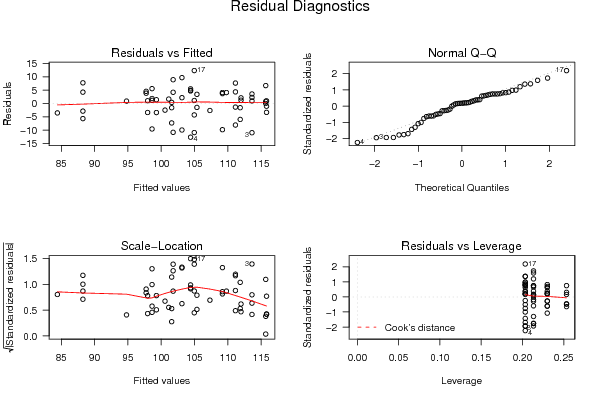
| Multiple Linear Regression - Residual Statistics | |
| Residual Standard Deviation | 6.304803921001 |
| Sum Squared Residuals | 1868.27596666667 |
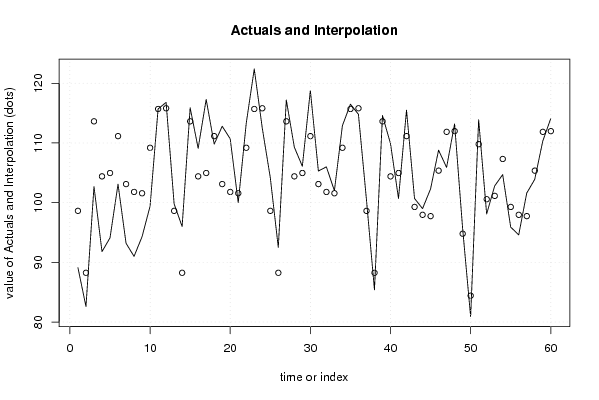
| Multiple Linear Regression - Actuals, Interpolation, and Residuals | |||
| Time or Index | Actuals | Interpolation Forecast | Residuals Prediction Error |
| 1 | 89.1 | 98.6263333333336 | -9.52633333333364 |
| 2 | 82.6 | 88.2463333333334 | -5.64633333333336 |
| 3 | 102.7 | 113.626333333333 | -10.9263333333333 |
| 4 | 91.8 | 104.406333333333 | -12.6063333333333 |
| 5 | 94.1 | 104.966333333333 | -10.8663333333333 |
| 6 | 103.1 | 111.146333333333 | -8.04633333333332 |
| 7 | 93.2 | 103.112666666667 | -9.9126666666667 |
| 8 | 91 | 101.792666666667 | -10.7926666666667 |
| 9 | 94.3 | 101.572666666667 | -7.27266666666665 |
| 10 | 99.4 | 109.192666666667 | -9.79266666666665 |
| 11 | 115.7 | 115.692666666667 | 0.00733333333333253 |
| 12 | 116.8 | 115.812666666667 | 0.987333333333348 |
| 13 | 99.8 | 98.6263333333333 | 1.17366666666674 |
| 14 | 96 | 88.2463333333333 | 7.75366666666667 |
| 15 | 115.9 | 113.626333333333 | 2.27366666666667 |
| 16 | 109.1 | 104.406333333333 | 4.69366666666667 |
| 17 | 117.3 | 104.966333333333 | 12.3336666666667 |
| 18 | 109.8 | 111.146333333333 | -1.34633333333333 |
| 19 | 112.8 | 103.112666666667 | 9.68733333333334 |
| 20 | 110.7 | 101.792666666667 | 8.90733333333335 |
| 21 | 100 | 101.572666666667 | -1.57266666666666 |
| 22 | 113.3 | 109.192666666667 | 4.10733333333333 |
| 23 | 122.4 | 115.692666666667 | 6.70733333333335 |
| 24 | 112.5 | 115.812666666667 | -3.31266666666665 |
| 25 | 104.2 | 98.6263333333333 | 5.57366666666674 |
| 26 | 92.5 | 88.2463333333333 | 4.25366666666667 |
| 27 | 117.2 | 113.626333333333 | 3.57366666666667 |
| 28 | 109.3 | 104.406333333333 | 4.89366666666667 |
| 29 | 106.1 | 104.966333333333 | 1.13366666666666 |
| 30 | 118.8 | 111.146333333333 | 7.65366666666666 |
| 31 | 105.3 | 103.112666666667 | 2.18733333333334 |
| 32 | 106 | 101.792666666667 | 4.20733333333334 |
| 33 | 102 | 101.572666666667 | 0.427333333333337 |
| 34 | 112.9 | 109.192666666667 | 3.70733333333334 |
| 35 | 116.5 | 115.692666666667 | 0.807333333333338 |
| 36 | 114.8 | 115.812666666667 | -1.01266666666665 |
| 37 | 100.5 | 98.6263333333333 | 1.87366666666674 |
| 38 | 85.4 | 88.2463333333333 | -2.84633333333332 |
| 39 | 114.6 | 113.626333333333 | 0.973666666666658 |
| 40 | 109.9 | 104.406333333333 | 5.49366666666668 |
| 41 | 100.7 | 104.966333333333 | -4.26633333333333 |
| 42 | 115.5 | 111.146333333333 | 4.35366666666667 |
| 43 | 100.7 | 99.281 | 1.41900000000000 |
| 44 | 99 | 97.961 | 1.039 |
| 45 | 102.3 | 97.741 | 4.55899999999999 |
| 46 | 108.8 | 105.361 | 3.43899999999999 |
| 47 | 105.9 | 111.861 | -5.961 |
| 48 | 113.2 | 111.981 | 1.21900000000001 |
| 49 | 95.7 | 94.7946666666666 | 0.9053333333334 |
| 50 | 80.9 | 84.4146666666667 | -3.51466666666666 |
| 51 | 113.9 | 109.794666666667 | 4.10533333333333 |
| 52 | 98.1 | 100.574666666667 | -2.47466666666668 |
| 53 | 102.8 | 101.134666666667 | 1.66533333333333 |
| 54 | 104.7 | 107.314666666667 | -2.61466666666667 |
| 55 | 95.9 | 99.281 | -3.38100000000000 |
| 56 | 94.6 | 97.961 | -3.36100000000001 |
| 57 | 101.6 | 97.741 | 3.85899999999999 |
| 58 | 103.9 | 105.361 | -1.46100000000000 |
| 59 | 110.3 | 111.861 | -1.56100000000001 |
| 60 | 114.1 | 111.981 | 2.119 |
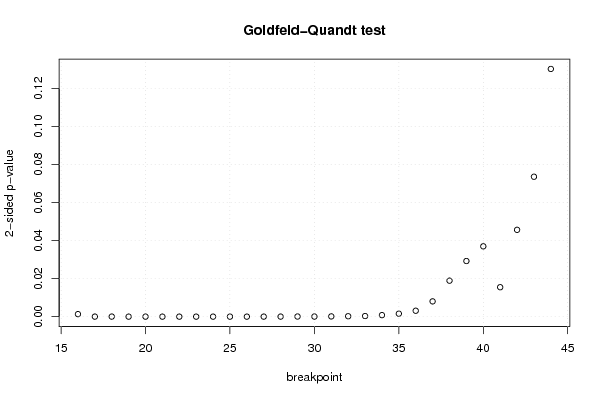
| Goldfeld-Quandt test for Heteroskedasticity | |||
| p-values | Alternative Hypothesis | ||
| breakpoint index | greater | 2-sided | less |
| 16 | 0.999330890417645 | 0.00133821916471028 | 0.000669109582355139 |
| 17 | 0.999991179060637 | 1.76418787261995e-05 | 8.82093936309973e-06 |
| 18 | 0.999984173816234 | 3.16523675313990e-05 | 1.58261837656995e-05 |
| 19 | 0.999997929770524 | 4.14045895124979e-06 | 2.07022947562489e-06 |
| 20 | 0.99999956213524 | 8.75729520232136e-07 | 4.37864760116068e-07 |
| 21 | 0.999999380507844 | 1.23898431105226e-06 | 6.19492155526131e-07 |
| 22 | 0.999998991195608 | 2.01760878505582e-06 | 1.00880439252791e-06 |
| 23 | 0.999999261363303 | 1.47727339359401e-06 | 7.38636696797005e-07 |
| 24 | 0.999998945348727 | 2.10930254524740e-06 | 1.05465127262370e-06 |
| 25 | 0.99999814651217 | 3.70697566005665e-06 | 1.85348783002833e-06 |
| 26 | 0.999997981989565 | 4.03602086975625e-06 | 2.01801043487812e-06 |
| 27 | 0.999994732718876 | 1.05345622479231e-05 | 5.26728112396157e-06 |
| 28 | 0.999989189518315 | 2.16209633701641e-05 | 1.08104816850820e-05 |
| 29 | 0.99996820542379 | 6.35891524215774e-05 | 3.17945762107887e-05 |
| 30 | 0.999976765523595 | 4.64689528108197e-05 | 2.32344764054098e-05 |
| 31 | 0.999935216890054 | 0.000129566219892615 | 6.47831099463074e-05 |
| 32 | 0.999890787766642 | 0.000218424466716867 | 0.000109212233358433 |
| 33 | 0.999838502832284 | 0.000322994335431181 | 0.000161497167715590 |
| 34 | 0.999598591100363 | 0.000802817799274399 | 0.000401408899637199 |
| 35 | 0.999219098612374 | 0.00156180277525199 | 0.000780901387625996 |
| 36 | 0.998446877027991 | 0.00310624594401718 | 0.00155312297200859 |
| 37 | 0.99598221041598 | 0.00803557916803796 | 0.00401778958401898 |
| 38 | 0.990545120795146 | 0.0189097584097086 | 0.0094548792048543 |
| 39 | 0.985382956122756 | 0.0292340877544880 | 0.0146170438772440 |
| 40 | 0.981514407834771 | 0.0369711843304589 | 0.0184855921652294 |
| 41 | 0.992262875927202 | 0.0154742481455959 | 0.00773712407279793 |
| 42 | 0.977178355341885 | 0.0456432893162297 | 0.0228216446581149 |
| 43 | 0.963219917648481 | 0.0735601647030377 | 0.0367800823515189 |
| 44 | 0.934884245911971 | 0.130231508176058 | 0.065115754088029 |
| Meta Analysis of Goldfeld-Quandt test for Heteroskedasticity | |||
| Description | # significant tests | % significant tests | OK/NOK |
| 1% type I error level | 22 | 0.758620689655172 | NOK |
| 5% type I error level | 27 | 0.93103448275862 | NOK |
| 10% type I error level | 28 | 0.96551724137931 | NOK |