| Multiple Linear Regression - Estimated Regression Equation |
| Y[t] = + 0.335653443287973 -0.898644896907781X[t] + 0.828817234617628Y1[t] + 0.00939051102773215t + e[t] |
| Multiple Linear Regression - Ordinary Least Squares | |||||
| Variable | Parameter | S.D. | T-STAT H0: parameter = 0 | 2-tail p-value | 1-tail p-value |
| (Intercept) | 0.335653443287973 | 0.056319 | 5.9598 | 0 | 0 |
| X | -0.898644896907781 | 0.09671 | -9.2921 | 0 | 0 |
| Y1 | 0.828817234617628 | 0.025505 | 32.4965 | 0 | 0 |
| t | 0.00939051102773215 | 0.001831 | 5.1285 | 4e-06 | 2e-06 |
| Multiple Linear Regression - Regression Statistics | |
| Multiple R | 0.99514204947928 |
| R-squared | 0.990307698641821 |
| Adjusted R-squared | 0.989779027658647 |
| F-TEST (value) | 1873.20229435968 |
| F-TEST (DF numerator) | 3 |
| F-TEST (DF denominator) | 55 |
| p-value | 0 |
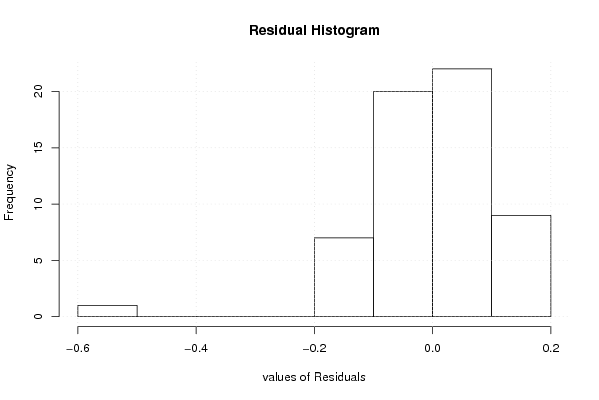
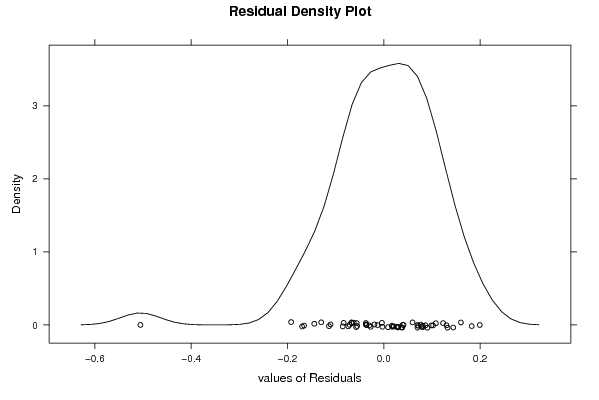
| Multiple Linear Regression - Residual Statistics | |
| Residual Standard Deviation | 0.115711745031606 |
| Sum Squared Residuals | 0.736406436604271 |
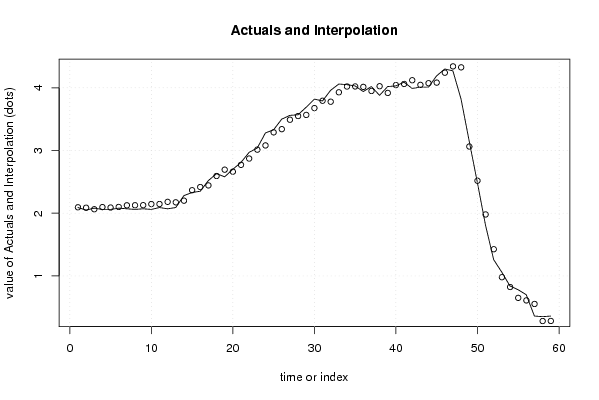
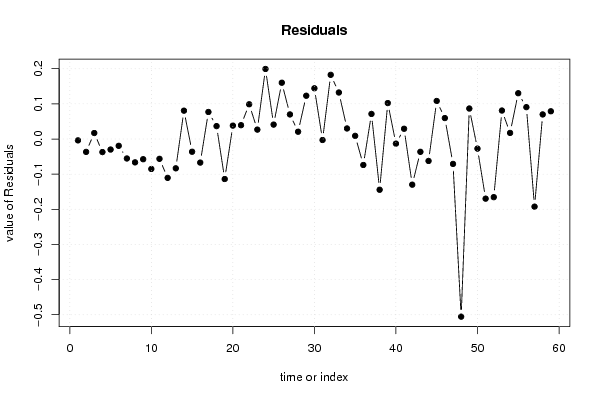
| Multiple Linear Regression - Actuals, Interpolation, and Residuals | |||
| Time or Index | Actuals | Interpolation Forecast | Residuals Prediction Error |
| 1 | 2.09 | 2.09384831935891 | -0.00384831935890569 |
| 2 | 2.05 | 2.08666248569428 | -0.0366624856942818 |
| 3 | 2.08 | 2.06290030733731 | 0.0170996926626892 |
| 4 | 2.06 | 2.09715533540357 | -0.0371553354035694 |
| 5 | 2.06 | 2.08996950173895 | -0.0299695017389490 |
| 6 | 2.08 | 2.09936001276668 | -0.0193600127666811 |
| 7 | 2.07 | 2.12532686848677 | -0.0553268684867661 |
| 8 | 2.06 | 2.12642920716832 | -0.0664292071683215 |
| 9 | 2.07 | 2.12753154584988 | -0.0575315458498778 |
| 10 | 2.06 | 2.14521022922379 | -0.0852102292237858 |
| 11 | 2.09 | 2.14631256790534 | -0.0563125679053421 |
| 12 | 2.07 | 2.18056759597160 | -0.110567595971603 |
| 13 | 2.09 | 2.17338176230698 | -0.0833817623069825 |
| 14 | 2.28 | 2.19934861802707 | 0.0806513819729328 |
| 15 | 2.33 | 2.36621440363215 | -0.0362144036321483 |
| 16 | 2.35 | 2.41704577639076 | -0.067045776390762 |
| 17 | 2.52 | 2.44301263211085 | 0.0769873678891531 |
| 18 | 2.63 | 2.59330207302358 | 0.0366979269764243 |
| 19 | 2.58 | 2.69386247985925 | -0.113862479859247 |
| 20 | 2.7 | 2.6618121291561 | 0.0381878708439025 |
| 21 | 2.81 | 2.77066070833795 | 0.0393392916620549 |
| 22 | 2.97 | 2.87122111517362 | 0.098778884826384 |
| 23 | 3.04 | 3.01322238374017 | 0.0267776162598311 |
| 24 | 3.28 | 3.08063010119113 | 0.199369898808865 |
| 25 | 3.33 | 3.2889367485271 | 0.0410632514729026 |
| 26 | 3.5 | 3.33976812128571 | 0.160231878714289 |
| 27 | 3.56 | 3.49005756219844 | 0.06994243780156 |
| 28 | 3.57 | 3.54917710730323 | 0.0208228926967699 |
| 29 | 3.69 | 3.56685579067714 | 0.123144209322862 |
| 30 | 3.82 | 3.67570436985899 | 0.144295630141014 |
| 31 | 3.79 | 3.79284112138701 | -0.00284112138700933 |
| 32 | 3.96 | 3.77736711537621 | 0.182632884623787 |
| 33 | 4.06 | 3.92765655628894 | 0.132343443711058 |
| 34 | 4.05 | 4.01992879077844 | 0.0300712092215637 |
| 35 | 4.03 | 4.02103112945999 | 0.00896887054000805 |
| 36 | 3.94 | 4.01384529579537 | -0.0738452957953723 |
| 37 | 4.02 | 3.94864225570752 | 0.071357744292482 |
| 38 | 3.88 | 4.02433814550466 | -0.144338145504660 |
| 39 | 4.02 | 3.91769424368592 | 0.102305756314075 |
| 40 | 4.03 | 4.04311916756012 | -0.0131191675601236 |
| 41 | 4.09 | 4.06079785093403 | 0.0292021490659669 |
| 42 | 3.99 | 4.11991739603882 | -0.129917396038822 |
| 43 | 4.01 | 4.04642618360479 | -0.0364261836047924 |
| 44 | 4.01 | 4.07239303932488 | -0.0623930393248766 |
| 45 | 4.19 | 4.08178355035261 | 0.108216449647392 |
| 46 | 4.3 | 4.24036116361151 | 0.0596388363884856 |
| 47 | 4.27 | 4.34092157044719 | -0.0709215704471853 |
| 48 | 3.82 | 4.32544756443639 | -0.505447564436388 |
| 49 | 3.15 | 3.06322542297841 | 0.0867745770215936 |
| 50 | 2.49 | 2.51730838681233 | -0.0273083868123280 |
| 51 | 1.81 | 1.97967952299243 | -0.169679522992426 |
| 52 | 1.26 | 1.42547431448017 | -0.165474314480172 |
| 53 | 1.06 | 0.979015346468209 | 0.0809846535317915 |
| 54 | 0.84 | 0.822642410572415 | 0.0173575894275846 |
| 55 | 0.78 | 0.649693129984269 | 0.130306870015731 |
| 56 | 0.7 | 0.609354606934944 | 0.0906453930650561 |
| 57 | 0.36 | 0.552439739193266 | -0.192439739193266 |
| 58 | 0.35 | 0.280032390451004 | 0.0699676095489957 |
| 59 | 0.36 | 0.281134729132560 | 0.0788652708674396 |
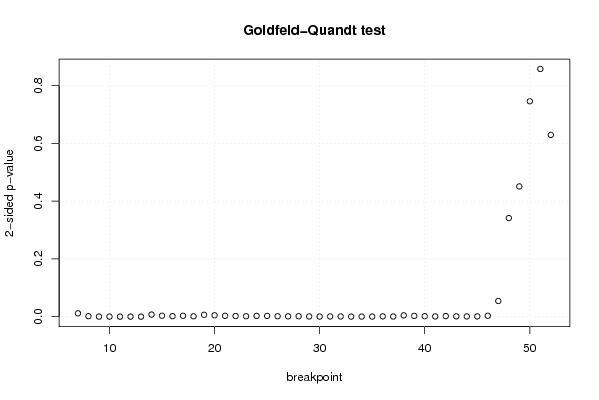
| Goldfeld-Quandt test for Heteroskedasticity | |||
| p-values | Alternative Hypothesis | ||
| breakpoint index | greater | 2-sided | less |
| 7 | 0.00578386083578261 | 0.0115677216715652 | 0.994216139164217 |
| 8 | 0.000798841662070364 | 0.00159768332414073 | 0.99920115833793 |
| 9 | 0.000102979187006964 | 0.000205958374013927 | 0.999897020812993 |
| 10 | 1.23242226228452e-05 | 2.46484452456903e-05 | 0.999987675777377 |
| 11 | 4.55603627608217e-06 | 9.11207255216434e-06 | 0.999995443963724 |
| 12 | 6.20208765365553e-07 | 1.24041753073111e-06 | 0.999999379791235 |
| 13 | 1.50053060105216e-07 | 3.00106120210431e-07 | 0.99999984994694 |
| 14 | 0.00358020490201834 | 0.00716040980403668 | 0.996419795097982 |
| 15 | 0.00158266370220128 | 0.00316532740440255 | 0.998417336297799 |
| 16 | 0.000831805994478731 | 0.00166361198895746 | 0.999168194005521 |
| 17 | 0.00150911289116506 | 0.00301822578233011 | 0.998490887108835 |
| 18 | 0.000648323610282255 | 0.00129664722056451 | 0.999351676389718 |
| 19 | 0.00322619541839445 | 0.0064523908367889 | 0.996773804581605 |
| 20 | 0.00235509803176037 | 0.00471019606352074 | 0.99764490196824 |
| 21 | 0.00146006359798777 | 0.00292012719597554 | 0.998539936402012 |
| 22 | 0.00108015183958393 | 0.00216030367916787 | 0.998919848160416 |
| 23 | 0.000731686797134811 | 0.00146337359426962 | 0.999268313202865 |
| 24 | 0.0012641940261311 | 0.0025283880522622 | 0.998735805973869 |
| 25 | 0.00130564517631345 | 0.00261129035262689 | 0.998694354823687 |
| 26 | 0.000718781410480645 | 0.00143756282096129 | 0.99928121858952 |
| 27 | 0.00053851712292914 | 0.00107703424585828 | 0.99946148287707 |
| 28 | 0.000719277071258333 | 0.00143855414251667 | 0.999280722928742 |
| 29 | 0.000347825859534004 | 0.000695651719068009 | 0.999652174140466 |
| 30 | 0.000165204881148222 | 0.000330409762296444 | 0.999834795118852 |
| 31 | 0.000359785601771594 | 0.000719571203543188 | 0.999640214398228 |
| 32 | 0.000257537082481048 | 0.000515074164962096 | 0.999742462917519 |
| 33 | 0.000130076070487711 | 0.000260152140975423 | 0.999869923929512 |
| 34 | 0.000130018680280709 | 0.000260037360561419 | 0.99986998131972 |
| 35 | 0.000134701019315864 | 0.000269402038631728 | 0.999865298980684 |
| 36 | 0.000483301775399937 | 0.000966603550799873 | 0.9995166982246 |
| 37 | 0.000236880525054706 | 0.000473761050109412 | 0.999763119474945 |
| 38 | 0.00224997989952375 | 0.0044999597990475 | 0.997750020100476 |
| 39 | 0.00126129193045819 | 0.00252258386091639 | 0.998738708069542 |
| 40 | 0.000829644787256695 | 0.00165928957451339 | 0.999170355212743 |
| 41 | 0.000416677814510844 | 0.000833355629021688 | 0.99958332218549 |
| 42 | 0.000959726863065056 | 0.00191945372613011 | 0.999040273136935 |
| 43 | 0.000572214699302067 | 0.00114442939860413 | 0.999427785300698 |
| 44 | 0.000380971750554365 | 0.00076194350110873 | 0.999619028249446 |
| 45 | 0.000414391973779885 | 0.00082878394755977 | 0.99958560802622 |
| 46 | 0.00149724438383848 | 0.00299448876767696 | 0.998502755616162 |
| 47 | 0.0270836339929127 | 0.0541672679858254 | 0.972916366007087 |
| 48 | 0.170700043168993 | 0.341400086337986 | 0.829299956831007 |
| 49 | 0.225560096027178 | 0.451120192054355 | 0.774439903972822 |
| 50 | 0.372970811082909 | 0.745941622165817 | 0.627029188917091 |
| 51 | 0.428971015106453 | 0.857942030212906 | 0.571028984893547 |
| 52 | 0.31470519159447 | 0.62941038318894 | 0.68529480840553 |
| Meta Analysis of Goldfeld-Quandt test for Heteroskedasticity | |||
| Description | # significant tests | % significant tests | OK/NOK |
| 1% type I error level | 39 | 0.847826086956522 | NOK |
| 5% type I error level | 40 | 0.869565217391304 | NOK |
| 10% type I error level | 41 | 0.891304347826087 | NOK |