| Multiple Linear Regression - Estimated Regression Equation |
| Y[t] = + 2.98518401342828 -0.0145944931655954X[t] + 1.60214515152688Y1[t] -1.14767852541949Y2[t] + 0.354459259946489Y3[t] + 0.0193598686132426M1[t] + 0.082891000338969M2[t] + 0.0325486589288215M3[t] -0.0821859560428094M4[t] + 0.0890126310675888M5[t] + 0.00699035407687789M6[t] -0.128436830127242M7[t] + 0.0290728814144387M8[t] + 0.159023499959213M9[t] -0.5450041439469M10[t] + 0.185451716720582M11[t] -0.00279480398198670t + e[t] |
| Multiple Linear Regression - Ordinary Least Squares | |||||
| Variable | Parameter | S.D. | T-STAT H0: parameter = 0 | 2-tail p-value | 1-tail p-value |
| (Intercept) | 2.98518401342828 | 1.032594 | 2.891 | 0.00618 | 0.00309 |
| X | -0.0145944931655954 | 0.005253 | -2.7784 | 0.00828 | 0.00414 |
| Y1 | 1.60214515152688 | 0.134769 | 11.8881 | 0 | 0 |
| Y2 | -1.14767852541949 | 0.215066 | -5.3364 | 4e-06 | 2e-06 |
| Y3 | 0.354459259946489 | 0.141146 | 2.5113 | 0.016169 | 0.008085 |
| M1 | 0.0193598686132426 | 0.143425 | 0.135 | 0.893303 | 0.446651 |
| M2 | 0.082891000338969 | 0.159809 | 0.5187 | 0.606836 | 0.303418 |
| M3 | 0.0325486589288215 | 0.161876 | 0.2011 | 0.841662 | 0.420831 |
| M4 | -0.0821859560428094 | 0.158924 | -0.5171 | 0.607907 | 0.303954 |
| M5 | 0.0890126310675888 | 0.144348 | 0.6167 | 0.540958 | 0.270479 |
| M6 | 0.00699035407687789 | 0.146545 | 0.0477 | 0.962192 | 0.481096 |
| M7 | -0.128436830127242 | 0.146643 | -0.8758 | 0.386341 | 0.193171 |
| M8 | 0.0290728814144387 | 0.138753 | 0.2095 | 0.835098 | 0.417549 |
| M9 | 0.159023499959213 | 0.195947 | 0.8116 | 0.421846 | 0.210923 |
| M10 | -0.5450041439469 | 0.176414 | -3.0894 | 0.003641 | 0.00182 |
| M11 | 0.185451716720582 | 0.154617 | 1.1994 | 0.23742 | 0.11871 |
| t | -0.00279480398198670 | 0.002487 | -1.1237 | 0.267846 | 0.133923 |
| Multiple Linear Regression - Regression Statistics | |
| Multiple R | 0.96434445443667 |
| R-squared | 0.929960226802759 |
| Adjusted R-squared | 0.901944317523863 |
| F-TEST (value) | 33.1940047901022 |
| F-TEST (DF numerator) | 16 |
| F-TEST (DF denominator) | 40 |
| p-value | 0 |
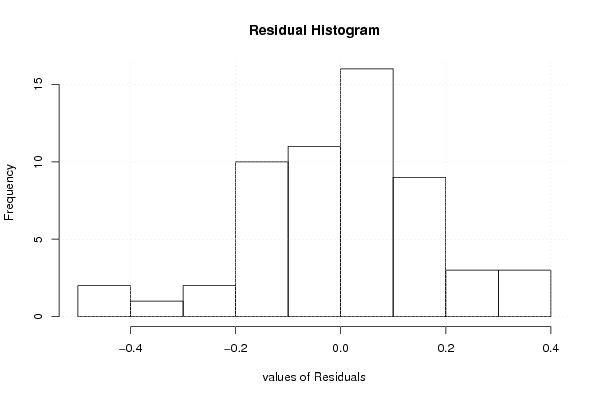
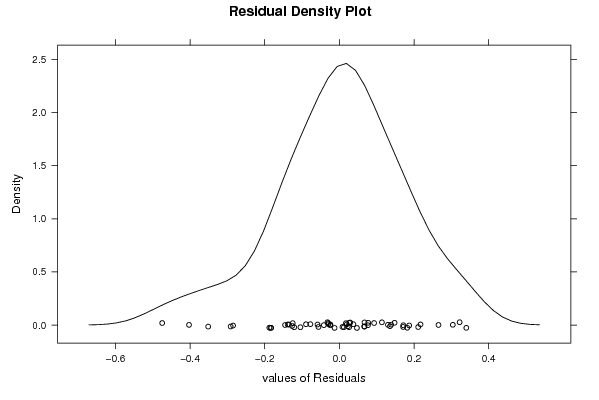
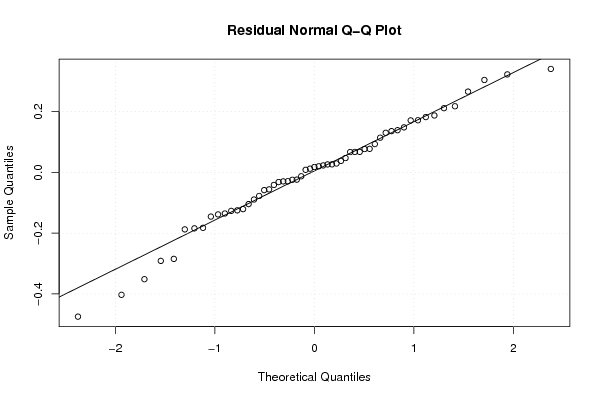
| Multiple Linear Regression - Residual Statistics | |
| Residual Standard Deviation | 0.203295340925834 |
| Sum Squared Residuals | 1.65315982568604 |
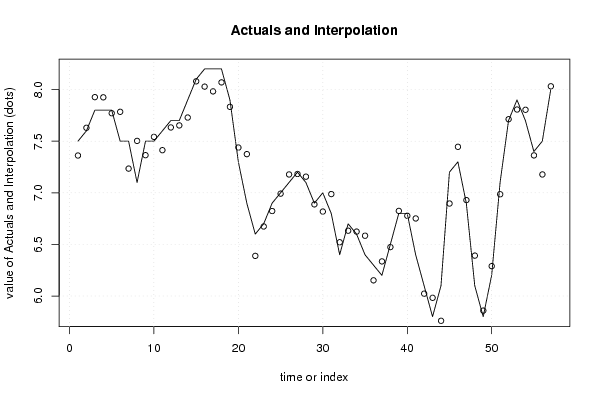
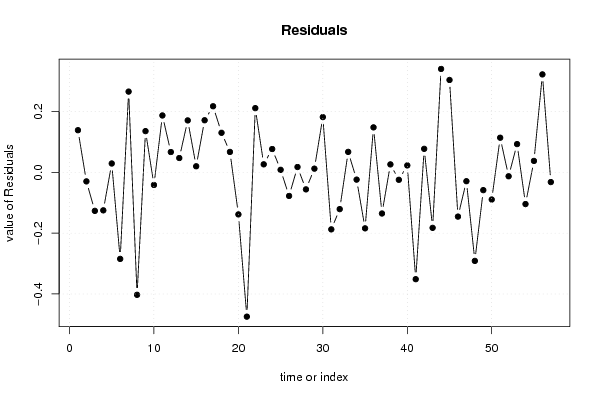
| Multiple Linear Regression - Actuals, Interpolation, and Residuals | |||
| Time or Index | Actuals | Interpolation Forecast | Residuals Prediction Error |
| 1 | 7.5 | 7.36137692858522 | 0.138623071414778 |
| 2 | 7.6 | 7.62976889646691 | -0.0297688964669144 |
| 3 | 7.8 | 7.92675971949194 | -0.126759719491939 |
| 4 | 7.8 | 7.92502678519718 | -0.125026785197176 |
| 5 | 7.8 | 7.7709092493791 | 0.0290907506209001 |
| 6 | 7.5 | 7.78471355741033 | -0.284713557410331 |
| 7 | 7.5 | 7.23444214164446 | 0.265557858355541 |
| 8 | 7.1 | 7.50286761481359 | -0.402867614813591 |
| 9 | 7.5 | 7.36444586524633 | 0.135554134753674 |
| 10 | 7.5 | 7.54155438928596 | -0.0415543892859626 |
| 11 | 7.6 | 7.41295670142715 | 0.187043298572851 |
| 12 | 7.7 | 7.63324819996471 | 0.0667518000352907 |
| 13 | 7.7 | 7.65293589702648 | 0.0470641029735206 |
| 14 | 7.9 | 7.72921450379929 | 0.170785496200712 |
| 15 | 8.1 | 8.08011414215365 | 0.0198858578463546 |
| 16 | 8.2 | 8.02866741004 | 0.171332589960006 |
| 17 | 8.2 | 7.98264335637568 | 0.217356643624318 |
| 18 | 8.2 | 8.06994877370115 | 0.130051226298854 |
| 19 | 7.9 | 7.83290337438621 | 0.0670966256137905 |
| 20 | 7.3 | 7.43838061860954 | -0.138380618609543 |
| 21 | 6.9 | 7.37471210031743 | -0.47471210031743 |
| 22 | 6.6 | 6.38892408228583 | 0.211075917714166 |
| 23 | 6.7 | 6.67363619544515 | 0.0263638045548499 |
| 24 | 6.9 | 6.82331340516101 | 0.076686594838991 |
| 25 | 7 | 6.99174204496789 | 0.00825795503211118 |
| 26 | 7.1 | 7.17768308428006 | -0.0776830842800585 |
| 27 | 7.2 | 7.18250648082558 | 0.0174935191744210 |
| 28 | 7.1 | 7.15608579569327 | -0.0560857956932686 |
| 29 | 6.9 | 6.88792747938615 | 0.0120725206138481 |
| 30 | 7 | 6.81824520984774 | 0.181754790152260 |
| 31 | 6.8 | 6.98762513777366 | -0.187625137773663 |
| 32 | 6.4 | 6.52095481448853 | -0.120954814488530 |
| 33 | 6.7 | 6.63271818070932 | 0.067281819290682 |
| 34 | 6.6 | 6.62396326642031 | -0.0239632664203125 |
| 35 | 6.4 | 6.58418825307424 | -0.184188253074237 |
| 36 | 6.3 | 6.15213285025279 | 0.147867149747206 |
| 37 | 6.2 | 6.33538306662753 | -0.135383066627526 |
| 38 | 6.5 | 6.47388763887365 | 0.0261123611263514 |
| 39 | 6.8 | 6.824554888615 | -0.0245548886150067 |
| 40 | 6.8 | 6.77727109585121 | 0.0227289041487908 |
| 41 | 6.4 | 6.75149257883451 | -0.351492578834507 |
| 42 | 6.1 | 6.02269651649304 | 0.0773034835069607 |
| 43 | 5.8 | 5.98257723697454 | -0.182577236974543 |
| 44 | 6.1 | 5.75992589919738 | 0.340074100802625 |
| 45 | 7.2 | 6.89612145285547 | 0.303878547144526 |
| 46 | 7.3 | 7.44555826200789 | -0.145558262007891 |
| 47 | 6.9 | 6.92921885005346 | -0.0292188500534638 |
| 48 | 6.1 | 6.39130554462149 | -0.291305544621488 |
| 49 | 5.8 | 5.85856206279288 | -0.0585620627928845 |
| 50 | 6.2 | 6.28944587658009 | -0.0894458765800902 |
| 51 | 7.1 | 6.98606476891383 | 0.113935231086171 |
| 52 | 7.7 | 7.71294891321835 | -0.0129489132183525 |
| 53 | 7.9 | 7.80702733602456 | 0.0929726639754414 |
| 54 | 7.7 | 7.80439594254774 | -0.104395942547744 |
| 55 | 7.4 | 7.36245210922113 | 0.0375478907788737 |
| 56 | 7.5 | 7.17787105289096 | 0.322128947109039 |
| 57 | 8 | 8.03200240087145 | -0.0320024008714517 |
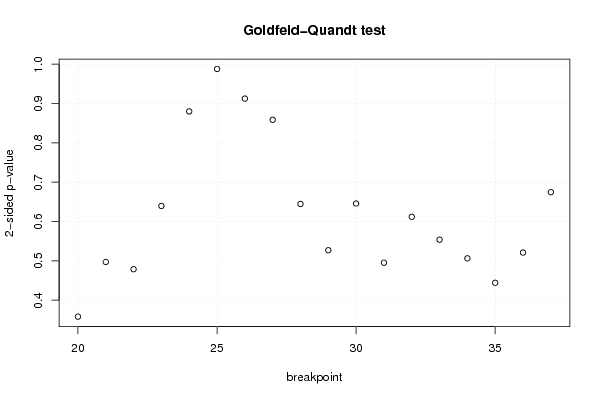
| Goldfeld-Quandt test for Heteroskedasticity | |||
| p-values | Alternative Hypothesis | ||
| breakpoint index | greater | 2-sided | less |
| 20 | 0.179066267953271 | 0.358132535906543 | 0.820933732046729 |
| 21 | 0.751363782560165 | 0.49727243487967 | 0.248636217439835 |
| 22 | 0.760638426543275 | 0.478723146913449 | 0.239361573456725 |
| 23 | 0.680189858298589 | 0.639620283402822 | 0.319810141701411 |
| 24 | 0.559970981735697 | 0.880058036528605 | 0.440029018264303 |
| 25 | 0.505986556492342 | 0.988026887015317 | 0.494013443507658 |
| 26 | 0.54370681189388 | 0.91258637621224 | 0.45629318810612 |
| 27 | 0.429376768240673 | 0.858753536481347 | 0.570623231759327 |
| 28 | 0.322372016770568 | 0.644744033541135 | 0.677627983229433 |
| 29 | 0.263526061230964 | 0.527052122461928 | 0.736473938769036 |
| 30 | 0.32289344163802 | 0.64578688327604 | 0.67710655836198 |
| 31 | 0.247648632738999 | 0.495297265477999 | 0.752351367261 |
| 32 | 0.306028149297254 | 0.612056298594509 | 0.693971850702746 |
| 33 | 0.276913520656727 | 0.553827041313454 | 0.723086479343273 |
| 34 | 0.253222519161681 | 0.506445038323362 | 0.746777480838319 |
| 35 | 0.222104283076366 | 0.444208566152732 | 0.777895716923634 |
| 36 | 0.73942236201172 | 0.521155275976559 | 0.260577637988280 |
| 37 | 0.662683933712723 | 0.674632132574553 | 0.337316066287277 |
| Meta Analysis of Goldfeld-Quandt test for Heteroskedasticity | |||
| Description | # significant tests | % significant tests | OK/NOK |
| 1% type I error level | 0 | 0 | OK |
| 5% type I error level | 0 | 0 | OK |
| 10% type I error level | 0 | 0 | OK |