Free Statistics

of Irreproducible Research!

Author's title

Author*The author of this computation has been verified*
R Software Modulerwasp_multipleregression.wasp
Title produced by softwareMultiple Regression
Date of computationFri, 20 Nov 2009 06:27:39 -0700
Cite this page as followsStatistical Computations at FreeStatistics.org, Office for Research Development and Education, URL https://freestatistics.org/blog/index.php?v=date/2009/Nov/20/t1258723845jhue3l8r48s8h41.htm/, Retrieved Wed, 08 May 2024 00:45:47 +0000
Statistical Computations at FreeStatistics.org, Office for Research Development and Education, URL https://freestatistics.org/blog/index.php?pk=58144, Retrieved Wed, 08 May 2024 00:45:47 +0000
QR Codes:

Original text written by user:
IsPrivate?No (this computation is public)
User-defined keywords
Estimated Impact126
Family? (F = Feedback message, R = changed R code, M = changed R Module, P = changed Parameters, D = changed Data)
-     [Multiple Regression] [Q1 The Seatbeltlaw] [2007-11-14 19:27:43] [8cd6641b921d30ebe00b648d1481bba0]
- RM D  [Multiple Regression] [Seatbelt] [2009-11-12 14:14:11] [b98453cac15ba1066b407e146608df68]
-    D      [Multiple Regression] [Model 5] [2009-11-20 13:27:39] [d79e31a57591875d497c91f296c77132] [Current]
Feedback Forum

Post a new message
Dataseries X:
96.92	148.3	98.2	98.54
99.06	152.2	96.92	98.2
99.65	169.4	99.06	96.92
99.82	168.6	99.65	99.06
99.99	161.1	99.82	99.65
100.33	174.1	99.99	99.82
99.31	179	100.33	99.99
101.1	190.6	99.31	100.33
101.1	190	101.1	99.31
100.93	181.6	101.1	101.1
100.85	174.8	100.93	101.1
100.93	180.5	100.85	100.93
99.6	196.8	100.93	100.85
101.88	193.8	99.6	100.93
101.81	197	101.88	99.6
102.38	216.3	101.81	101.88
102.74	221.4	102.38	101.81
102.82	217.9	102.74	102.38
101.72	229.7	102.82	102.74
103.47	227.4	101.72	102.82
102.98	204.2	103.47	101.72
102.68	196.6	102.98	103.47
102.9	198.8	102.68	102.98
103.03	207.5	102.9	102.68
101.29	190.7	103.03	102.9
103.69	201.6	101.29	103.03
103.68	210.5	103.69	101.29
104.2	223.5	103.68	103.69
104.08	223.8	104.2	103.68
104.16	231.2	104.08	104.2
103.05	244	104.16	104.08
104.66	234.7	103.05	104.16
104.46	250.2	104.66	103.05
104.95	265.7	104.46	104.66
105.85	287.6	104.95	104.46
106.23	283.3	105.85	104.95
104.86	295.4	106.23	105.85
107.44	312.3	104.86	106.23
108.23	333.8	107.44	104.86
108.45	347.7	108.23	107.44
109.39	383.2	108.45	108.23
110.15	407.1	109.39	108.45
109.13	413.6	110.15	109.39
110.28	362.7	109.13	110.15
110.17	321.9	110.28	109.13
109.99	239.4	110.17	110.28
109.26	191	109.99	110.17
109.11	159.7	109.26	109.99
107.06	163.4	109.11	109.26
109.53	157.6	107.06	109.11
108.92	166.2	109.53	107.06
109.24	176.7	108.92	109.53
109.12	198.3	109.24	108.92
109	226.2	109.12	109.24
107.23	216.2	109	109.12
109.49	235.9	107.23	109
109.04	226.9	109.49	107.23


Summary of computational transaction
Raw Inputview raw input (R code)
Raw Outputview raw output of R engine
Computing time3 seconds
R Server'Gwilym Jenkins' @ 72.249.127.135

\begin{tabular}{lllllllll}
\hline
Summary of computational transaction \tabularnewline
Raw Input & view raw input (R code)  \tabularnewline
Raw Output & view raw output of R engine  \tabularnewline
Computing time & 3 seconds \tabularnewline
R Server & 'Gwilym Jenkins' @ 72.249.127.135 \tabularnewline
\hline
\end{tabular}
%Source: https://freestatistics.org/blog/index.php?pk=58144&T=0

[TABLE]
[ROW][C]Summary of computational transaction[/C][/ROW]
[ROW][C]Raw Input[/C][C]view raw input (R code) [/C][/ROW]
[ROW][C]Raw Output[/C][C]view raw output of R engine [/C][/ROW]
[ROW][C]Computing time[/C][C]3 seconds[/C][/ROW]
[ROW][C]R Server[/C][C]'Gwilym Jenkins' @ 72.249.127.135[/C][/ROW]
[/TABLE]
Source: https://freestatistics.org/blog/index.php?pk=58144&T=0

Globally Unique Identifier (entire table): ba.freestatistics.org/blog/index.php?pk=58144&T=0

As an alternative you can also use a QR Code:  

The GUIDs for individual cells are displayed in the table below:

Summary of computational transaction
Raw Inputview raw input (R code)
Raw Outputview raw output of R engine
Computing time3 seconds
R Server'Gwilym Jenkins' @ 72.249.127.135


Multiple Linear Regression - Estimated Regression Equation
Y[t] = + 15.8628084234176 + 0.00548846630286158X[t] + 0.547489113654386Y1[t] + 0.284804867258724Y2[t] -1.72061412426050M1[t] + 1.45033832307751M2[t] + 0.642970589035423M3[t] + 0.166916920944267M4[t] + 0.0931322767468709M5[t] -0.0145036866952044M6[t] -1.46494558899757M7[t] + 0.852531461568537M8[t] + 0.0488987753423475M9[t] -0.261059298752688M10[t] -0.0850382975186649M11[t] + 0.0230123622686391t + e[t]

\begin{tabular}{lllllllll}
\hline
Multiple Linear Regression - Estimated Regression Equation \tabularnewline
Y[t] =  +  15.8628084234176 +  0.00548846630286158X[t] +  0.547489113654386Y1[t] +  0.284804867258724Y2[t] -1.72061412426050M1[t] +  1.45033832307751M2[t] +  0.642970589035423M3[t] +  0.166916920944267M4[t] +  0.0931322767468709M5[t] -0.0145036866952044M6[t] -1.46494558899757M7[t] +  0.852531461568537M8[t] +  0.0488987753423475M9[t] -0.261059298752688M10[t] -0.0850382975186649M11[t] +  0.0230123622686391t  + e[t] \tabularnewline
\hline
\end{tabular}
%Source: https://freestatistics.org/blog/index.php?pk=58144&T=1

[TABLE]
[ROW][C]Multiple Linear Regression - Estimated Regression Equation[/C][/ROW]
[ROW][C]Y[t] =  +  15.8628084234176 +  0.00548846630286158X[t] +  0.547489113654386Y1[t] +  0.284804867258724Y2[t] -1.72061412426050M1[t] +  1.45033832307751M2[t] +  0.642970589035423M3[t] +  0.166916920944267M4[t] +  0.0931322767468709M5[t] -0.0145036866952044M6[t] -1.46494558899757M7[t] +  0.852531461568537M8[t] +  0.0488987753423475M9[t] -0.261059298752688M10[t] -0.0850382975186649M11[t] +  0.0230123622686391t  + e[t][/C][/ROW]
[/TABLE]
Source: https://freestatistics.org/blog/index.php?pk=58144&T=1

Globally Unique Identifier (entire table): ba.freestatistics.org/blog/index.php?pk=58144&T=1

As an alternative you can also use a QR Code:  

The GUIDs for individual cells are displayed in the table below:

Multiple Linear Regression - Estimated Regression Equation
Y[t] = + 15.8628084234176 + 0.00548846630286158X[t] + 0.547489113654386Y1[t] + 0.284804867258724Y2[t] -1.72061412426050M1[t] + 1.45033832307751M2[t] + 0.642970589035423M3[t] + 0.166916920944267M4[t] + 0.0931322767468709M5[t] -0.0145036866952044M6[t] -1.46494558899757M7[t] + 0.852531461568537M8[t] + 0.0488987753423475M9[t] -0.261059298752688M10[t] -0.0850382975186649M11[t] + 0.0230123622686391t + e[t]


Multiple Linear Regression - Ordinary Least Squares
VariableParameterS.D.T-STATH0: parameter = 02-tail p-value1-tail p-value
(Intercept)15.86280842341764.2896393.69790.0006380.000319
X0.005488466302861580.0008546.423400
Y10.5474891136543860.1374763.98240.0002730.000136
Y20.2848048672587240.1289312.2090.0328220.016411
M1-1.720614124260500.18075-9.519300
M21.450338323077510.29324.94661.3e-057e-06
M30.6429705890354230.3416281.88210.0669370.033468
M40.1669169209442670.180710.92370.3610620.180531
M50.09313227674687090.1826590.50990.6128760.306438
M6-0.01450368669520440.182257-0.07960.936960.46848
M7-1.464945588997570.182619-8.021800
M80.8525314615685370.2652563.2140.0025520.001276
M90.04889877534234750.2704490.18080.8574110.428705
M10-0.2610592987526880.195314-1.33660.188720.09436
M11-0.08503829751866490.190821-0.44560.6581980.329099
t0.02301236226863910.009212.49850.0165720.008286

\begin{tabular}{lllllllll}
\hline
Multiple Linear Regression - Ordinary Least Squares \tabularnewline
Variable & Parameter & S.D. & T-STATH0: parameter = 0 & 2-tail p-value & 1-tail p-value \tabularnewline
(Intercept) & 15.8628084234176 & 4.289639 & 3.6979 & 0.000638 & 0.000319 \tabularnewline
X & 0.00548846630286158 & 0.000854 & 6.4234 & 0 & 0 \tabularnewline
Y1 & 0.547489113654386 & 0.137476 & 3.9824 & 0.000273 & 0.000136 \tabularnewline
Y2 & 0.284804867258724 & 0.128931 & 2.209 & 0.032822 & 0.016411 \tabularnewline
M1 & -1.72061412426050 & 0.18075 & -9.5193 & 0 & 0 \tabularnewline
M2 & 1.45033832307751 & 0.2932 & 4.9466 & 1.3e-05 & 7e-06 \tabularnewline
M3 & 0.642970589035423 & 0.341628 & 1.8821 & 0.066937 & 0.033468 \tabularnewline
M4 & 0.166916920944267 & 0.18071 & 0.9237 & 0.361062 & 0.180531 \tabularnewline
M5 & 0.0931322767468709 & 0.182659 & 0.5099 & 0.612876 & 0.306438 \tabularnewline
M6 & -0.0145036866952044 & 0.182257 & -0.0796 & 0.93696 & 0.46848 \tabularnewline
M7 & -1.46494558899757 & 0.182619 & -8.0218 & 0 & 0 \tabularnewline
M8 & 0.852531461568537 & 0.265256 & 3.214 & 0.002552 & 0.001276 \tabularnewline
M9 & 0.0488987753423475 & 0.270449 & 0.1808 & 0.857411 & 0.428705 \tabularnewline
M10 & -0.261059298752688 & 0.195314 & -1.3366 & 0.18872 & 0.09436 \tabularnewline
M11 & -0.0850382975186649 & 0.190821 & -0.4456 & 0.658198 & 0.329099 \tabularnewline
t & 0.0230123622686391 & 0.00921 & 2.4985 & 0.016572 & 0.008286 \tabularnewline
\hline
\end{tabular}
%Source: https://freestatistics.org/blog/index.php?pk=58144&T=2

[TABLE]
[ROW][C]Multiple Linear Regression - Ordinary Least Squares[/C][/ROW]
[ROW][C]Variable[/C][C]Parameter[/C][C]S.D.[/C][C]T-STATH0: parameter = 0[/C][C]2-tail p-value[/C][C]1-tail p-value[/C][/ROW]
[ROW][C](Intercept)[/C][C]15.8628084234176[/C][C]4.289639[/C][C]3.6979[/C][C]0.000638[/C][C]0.000319[/C][/ROW]
[ROW][C]X[/C][C]0.00548846630286158[/C][C]0.000854[/C][C]6.4234[/C][C]0[/C][C]0[/C][/ROW]
[ROW][C]Y1[/C][C]0.547489113654386[/C][C]0.137476[/C][C]3.9824[/C][C]0.000273[/C][C]0.000136[/C][/ROW]
[ROW][C]Y2[/C][C]0.284804867258724[/C][C]0.128931[/C][C]2.209[/C][C]0.032822[/C][C]0.016411[/C][/ROW]
[ROW][C]M1[/C][C]-1.72061412426050[/C][C]0.18075[/C][C]-9.5193[/C][C]0[/C][C]0[/C][/ROW]
[ROW][C]M2[/C][C]1.45033832307751[/C][C]0.2932[/C][C]4.9466[/C][C]1.3e-05[/C][C]7e-06[/C][/ROW]
[ROW][C]M3[/C][C]0.642970589035423[/C][C]0.341628[/C][C]1.8821[/C][C]0.066937[/C][C]0.033468[/C][/ROW]
[ROW][C]M4[/C][C]0.166916920944267[/C][C]0.18071[/C][C]0.9237[/C][C]0.361062[/C][C]0.180531[/C][/ROW]
[ROW][C]M5[/C][C]0.0931322767468709[/C][C]0.182659[/C][C]0.5099[/C][C]0.612876[/C][C]0.306438[/C][/ROW]
[ROW][C]M6[/C][C]-0.0145036866952044[/C][C]0.182257[/C][C]-0.0796[/C][C]0.93696[/C][C]0.46848[/C][/ROW]
[ROW][C]M7[/C][C]-1.46494558899757[/C][C]0.182619[/C][C]-8.0218[/C][C]0[/C][C]0[/C][/ROW]
[ROW][C]M8[/C][C]0.852531461568537[/C][C]0.265256[/C][C]3.214[/C][C]0.002552[/C][C]0.001276[/C][/ROW]
[ROW][C]M9[/C][C]0.0488987753423475[/C][C]0.270449[/C][C]0.1808[/C][C]0.857411[/C][C]0.428705[/C][/ROW]
[ROW][C]M10[/C][C]-0.261059298752688[/C][C]0.195314[/C][C]-1.3366[/C][C]0.18872[/C][C]0.09436[/C][/ROW]
[ROW][C]M11[/C][C]-0.0850382975186649[/C][C]0.190821[/C][C]-0.4456[/C][C]0.658198[/C][C]0.329099[/C][/ROW]
[ROW][C]t[/C][C]0.0230123622686391[/C][C]0.00921[/C][C]2.4985[/C][C]0.016572[/C][C]0.008286[/C][/ROW]
[/TABLE]
Source: https://freestatistics.org/blog/index.php?pk=58144&T=2

Globally Unique Identifier (entire table): ba.freestatistics.org/blog/index.php?pk=58144&T=2

As an alternative you can also use a QR Code:  

The GUIDs for individual cells are displayed in the table below:

Multiple Linear Regression - Ordinary Least Squares
VariableParameterS.D.T-STATH0: parameter = 02-tail p-value1-tail p-value
(Intercept)15.86280842341764.2896393.69790.0006380.000319
X0.005488466302861580.0008546.423400
Y10.5474891136543860.1374763.98240.0002730.000136
Y20.2848048672587240.1289312.2090.0328220.016411
M1-1.720614124260500.18075-9.519300
M21.450338323077510.29324.94661.3e-057e-06
M30.6429705890354230.3416281.88210.0669370.033468
M40.1669169209442670.180710.92370.3610620.180531
M50.09313227674687090.1826590.50990.6128760.306438
M6-0.01450368669520440.182257-0.07960.936960.46848
M7-1.464945588997570.182619-8.021800
M80.8525314615685370.2652563.2140.0025520.001276
M90.04889877534234750.2704490.18080.8574110.428705
M10-0.2610592987526880.195314-1.33660.188720.09436
M11-0.08503829751866490.190821-0.44560.6581980.329099
t0.02301236226863910.009212.49850.0165720.008286


Multiple Linear Regression - Regression Statistics
Multiple R0.998075693034228
R-squared0.996155089025755
Adjusted R-squared0.99474841427908
F-TEST (value)708.163057153391
F-TEST (DF numerator)15
F-TEST (DF denominator)41
p-value0
Multiple Linear Regression - Residual Statistics
Residual Standard Deviation0.268481217752668
Sum Squared Residuals2.95536873572417

\begin{tabular}{lllllllll}
\hline
Multiple Linear Regression - Regression Statistics \tabularnewline
Multiple R & 0.998075693034228 \tabularnewline
R-squared & 0.996155089025755 \tabularnewline
Adjusted R-squared & 0.99474841427908 \tabularnewline
F-TEST (value) & 708.163057153391 \tabularnewline
F-TEST (DF numerator) & 15 \tabularnewline
F-TEST (DF denominator) & 41 \tabularnewline
p-value & 0 \tabularnewline
Multiple Linear Regression - Residual Statistics \tabularnewline
Residual Standard Deviation & 0.268481217752668 \tabularnewline
Sum Squared Residuals & 2.95536873572417 \tabularnewline
\hline
\end{tabular}
%Source: https://freestatistics.org/blog/index.php?pk=58144&T=3

[TABLE]
[ROW][C]Multiple Linear Regression - Regression Statistics[/C][/ROW]
[ROW][C]Multiple R[/C][C]0.998075693034228[/C][/ROW]
[ROW][C]R-squared[/C][C]0.996155089025755[/C][/ROW]
[ROW][C]Adjusted R-squared[/C][C]0.99474841427908[/C][/ROW]
[ROW][C]F-TEST (value)[/C][C]708.163057153391[/C][/ROW]
[ROW][C]F-TEST (DF numerator)[/C][C]15[/C][/ROW]
[ROW][C]F-TEST (DF denominator)[/C][C]41[/C][/ROW]
[ROW][C]p-value[/C][C]0[/C][/ROW]
[ROW][C]Multiple Linear Regression - Residual Statistics[/C][/ROW]
[ROW][C]Residual Standard Deviation[/C][C]0.268481217752668[/C][/ROW]
[ROW][C]Sum Squared Residuals[/C][C]2.95536873572417[/C][/ROW]
[/TABLE]
Source: https://freestatistics.org/blog/index.php?pk=58144&T=3

Globally Unique Identifier (entire table): ba.freestatistics.org/blog/index.php?pk=58144&T=3

As an alternative you can also use a QR Code:  

The GUIDs for individual cells are displayed in the table below:

Multiple Linear Regression - Regression Statistics
Multiple R0.998075693034228
R-squared0.996155089025755
Adjusted R-squared0.99474841427908
F-TEST (value)708.163057153391
F-TEST (DF numerator)15
F-TEST (DF denominator)41
p-value0
Multiple Linear Regression - Residual Statistics
Residual Standard Deviation0.268481217752668
Sum Squared Residuals2.95536873572417


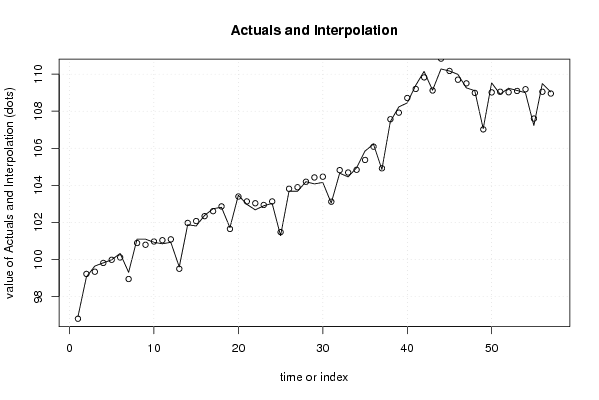
Multiple Linear Regression - Actuals, Interpolation, and Residuals
Time or IndexActualsInterpolationForecastResidualsPrediction Error
196.9296.80724879467550.112751205324474
299.0699.2249989025177-0.164998902517677
399.6599.34212162428270.307878375717331
499.8299.81719053840760.00280946159236502
599.9999.98636278021130.00363721978870009
6100.33100.1145792177300.215420782269713
799.3198.9486062886570.361393711342945
8101.1100.8911566695450.208843330454502
9101.1100.7967478146440.303252185356319
10100.93100.973499698266-0.0434996982663469
11100.85101.042138341588-0.192138341588327
12100.93101.089257302776-0.159257302775590
1399.699.5021322812320.0978677187679605
14101.88101.974255560150-0.0942555601504643
15101.81102.076947986224-0.266947986224065
16102.38102.3408649394410.0391350605591298
17102.74102.6102162897320.129783710268405
18102.82102.865817911751-0.0458179117511944
19101.72101.6494811553970.0705188446032803
20103.47103.3978934600960.0721065399042408
21102.98103.134761312822-0.154761312822396
22102.68103.036242109106-0.356242109106368
23102.9102.943548979422-0.0435489794222405
24103.03103.134355440871-0.104355440870793
25101.29101.478378100563-0.188378100562836
26103.69103.816560767856-0.126560767855689
27103.68103.899466149918-0.219466149918047
28104.2104.1958316963170.00416830368286885
29104.08104.428552244707-0.348552244706930
30104.16104.466943131511-0.306943131510678
31103.05103.119388505175-0.0693885051748819
32104.66104.823906654617-0.163906654617344
33104.46104.693681628681-0.233681628680530
34104.95104.8408451581040.109154841895856
35105.85105.3713846258780.478615374121607
36106.23106.0881294678090.141870532190897
37104.86104.921308391803-0.0613083918033899
38107.44107.566194045780-0.126194045780208
39108.23107.9221799446020.307820055397856
40108.45108.712741277704-0.262741277703879
41109.39109.2022529996650.187747000334932
42110.15109.8261005807620.32389941923794
43109.13109.1181543732970.0118456267025193
44110.28110.837293654506-0.557293654505717
45110.17110.17185542149-0.00185542149005972
46109.99109.6994130345230.290586965476859
47109.26109.502928053111-0.242928053111039
48109.11108.9882577885450.121742211455486
49107.06107.0209324317260.0390675682737915
50109.53109.0179907236960.512009276304038
51108.92109.049284294973-0.129284294973075
52109.24109.0233715481300.216628451869516
53109.12109.0926156856850.0273843143148939
54109109.186559158246-0.186559158245781
55107.23107.604369677474-0.374369677473863
56109.49109.0497495612360.440250438764319
57109.04108.9529538223630.0870461776366666

\begin{tabular}{lllllllll}
\hline
Multiple Linear Regression - Actuals, Interpolation, and Residuals \tabularnewline
Time or Index & Actuals & InterpolationForecast & ResidualsPrediction Error \tabularnewline
1 & 96.92 & 96.8072487946755 & 0.112751205324474 \tabularnewline
2 & 99.06 & 99.2249989025177 & -0.164998902517677 \tabularnewline
3 & 99.65 & 99.3421216242827 & 0.307878375717331 \tabularnewline
4 & 99.82 & 99.8171905384076 & 0.00280946159236502 \tabularnewline
5 & 99.99 & 99.9863627802113 & 0.00363721978870009 \tabularnewline
6 & 100.33 & 100.114579217730 & 0.215420782269713 \tabularnewline
7 & 99.31 & 98.948606288657 & 0.361393711342945 \tabularnewline
8 & 101.1 & 100.891156669545 & 0.208843330454502 \tabularnewline
9 & 101.1 & 100.796747814644 & 0.303252185356319 \tabularnewline
10 & 100.93 & 100.973499698266 & -0.0434996982663469 \tabularnewline
11 & 100.85 & 101.042138341588 & -0.192138341588327 \tabularnewline
12 & 100.93 & 101.089257302776 & -0.159257302775590 \tabularnewline
13 & 99.6 & 99.502132281232 & 0.0978677187679605 \tabularnewline
14 & 101.88 & 101.974255560150 & -0.0942555601504643 \tabularnewline
15 & 101.81 & 102.076947986224 & -0.266947986224065 \tabularnewline
16 & 102.38 & 102.340864939441 & 0.0391350605591298 \tabularnewline
17 & 102.74 & 102.610216289732 & 0.129783710268405 \tabularnewline
18 & 102.82 & 102.865817911751 & -0.0458179117511944 \tabularnewline
19 & 101.72 & 101.649481155397 & 0.0705188446032803 \tabularnewline
20 & 103.47 & 103.397893460096 & 0.0721065399042408 \tabularnewline
21 & 102.98 & 103.134761312822 & -0.154761312822396 \tabularnewline
22 & 102.68 & 103.036242109106 & -0.356242109106368 \tabularnewline
23 & 102.9 & 102.943548979422 & -0.0435489794222405 \tabularnewline
24 & 103.03 & 103.134355440871 & -0.104355440870793 \tabularnewline
25 & 101.29 & 101.478378100563 & -0.188378100562836 \tabularnewline
26 & 103.69 & 103.816560767856 & -0.126560767855689 \tabularnewline
27 & 103.68 & 103.899466149918 & -0.219466149918047 \tabularnewline
28 & 104.2 & 104.195831696317 & 0.00416830368286885 \tabularnewline
29 & 104.08 & 104.428552244707 & -0.348552244706930 \tabularnewline
30 & 104.16 & 104.466943131511 & -0.306943131510678 \tabularnewline
31 & 103.05 & 103.119388505175 & -0.0693885051748819 \tabularnewline
32 & 104.66 & 104.823906654617 & -0.163906654617344 \tabularnewline
33 & 104.46 & 104.693681628681 & -0.233681628680530 \tabularnewline
34 & 104.95 & 104.840845158104 & 0.109154841895856 \tabularnewline
35 & 105.85 & 105.371384625878 & 0.478615374121607 \tabularnewline
36 & 106.23 & 106.088129467809 & 0.141870532190897 \tabularnewline
37 & 104.86 & 104.921308391803 & -0.0613083918033899 \tabularnewline
38 & 107.44 & 107.566194045780 & -0.126194045780208 \tabularnewline
39 & 108.23 & 107.922179944602 & 0.307820055397856 \tabularnewline
40 & 108.45 & 108.712741277704 & -0.262741277703879 \tabularnewline
41 & 109.39 & 109.202252999665 & 0.187747000334932 \tabularnewline
42 & 110.15 & 109.826100580762 & 0.32389941923794 \tabularnewline
43 & 109.13 & 109.118154373297 & 0.0118456267025193 \tabularnewline
44 & 110.28 & 110.837293654506 & -0.557293654505717 \tabularnewline
45 & 110.17 & 110.17185542149 & -0.00185542149005972 \tabularnewline
46 & 109.99 & 109.699413034523 & 0.290586965476859 \tabularnewline
47 & 109.26 & 109.502928053111 & -0.242928053111039 \tabularnewline
48 & 109.11 & 108.988257788545 & 0.121742211455486 \tabularnewline
49 & 107.06 & 107.020932431726 & 0.0390675682737915 \tabularnewline
50 & 109.53 & 109.017990723696 & 0.512009276304038 \tabularnewline
51 & 108.92 & 109.049284294973 & -0.129284294973075 \tabularnewline
52 & 109.24 & 109.023371548130 & 0.216628451869516 \tabularnewline
53 & 109.12 & 109.092615685685 & 0.0273843143148939 \tabularnewline
54 & 109 & 109.186559158246 & -0.186559158245781 \tabularnewline
55 & 107.23 & 107.604369677474 & -0.374369677473863 \tabularnewline
56 & 109.49 & 109.049749561236 & 0.440250438764319 \tabularnewline
57 & 109.04 & 108.952953822363 & 0.0870461776366666 \tabularnewline
\hline
\end{tabular}
%Source: https://freestatistics.org/blog/index.php?pk=58144&T=4

[TABLE]
[ROW][C]Multiple Linear Regression - Actuals, Interpolation, and Residuals[/C][/ROW]
[ROW][C]Time or Index[/C][C]Actuals[/C][C]InterpolationForecast[/C][C]ResidualsPrediction Error[/C][/ROW]
[ROW][C]1[/C][C]96.92[/C][C]96.8072487946755[/C][C]0.112751205324474[/C][/ROW]
[ROW][C]2[/C][C]99.06[/C][C]99.2249989025177[/C][C]-0.164998902517677[/C][/ROW]
[ROW][C]3[/C][C]99.65[/C][C]99.3421216242827[/C][C]0.307878375717331[/C][/ROW]
[ROW][C]4[/C][C]99.82[/C][C]99.8171905384076[/C][C]0.00280946159236502[/C][/ROW]
[ROW][C]5[/C][C]99.99[/C][C]99.9863627802113[/C][C]0.00363721978870009[/C][/ROW]
[ROW][C]6[/C][C]100.33[/C][C]100.114579217730[/C][C]0.215420782269713[/C][/ROW]
[ROW][C]7[/C][C]99.31[/C][C]98.948606288657[/C][C]0.361393711342945[/C][/ROW]
[ROW][C]8[/C][C]101.1[/C][C]100.891156669545[/C][C]0.208843330454502[/C][/ROW]
[ROW][C]9[/C][C]101.1[/C][C]100.796747814644[/C][C]0.303252185356319[/C][/ROW]
[ROW][C]10[/C][C]100.93[/C][C]100.973499698266[/C][C]-0.0434996982663469[/C][/ROW]
[ROW][C]11[/C][C]100.85[/C][C]101.042138341588[/C][C]-0.192138341588327[/C][/ROW]
[ROW][C]12[/C][C]100.93[/C][C]101.089257302776[/C][C]-0.159257302775590[/C][/ROW]
[ROW][C]13[/C][C]99.6[/C][C]99.502132281232[/C][C]0.0978677187679605[/C][/ROW]
[ROW][C]14[/C][C]101.88[/C][C]101.974255560150[/C][C]-0.0942555601504643[/C][/ROW]
[ROW][C]15[/C][C]101.81[/C][C]102.076947986224[/C][C]-0.266947986224065[/C][/ROW]
[ROW][C]16[/C][C]102.38[/C][C]102.340864939441[/C][C]0.0391350605591298[/C][/ROW]
[ROW][C]17[/C][C]102.74[/C][C]102.610216289732[/C][C]0.129783710268405[/C][/ROW]
[ROW][C]18[/C][C]102.82[/C][C]102.865817911751[/C][C]-0.0458179117511944[/C][/ROW]
[ROW][C]19[/C][C]101.72[/C][C]101.649481155397[/C][C]0.0705188446032803[/C][/ROW]
[ROW][C]20[/C][C]103.47[/C][C]103.397893460096[/C][C]0.0721065399042408[/C][/ROW]
[ROW][C]21[/C][C]102.98[/C][C]103.134761312822[/C][C]-0.154761312822396[/C][/ROW]
[ROW][C]22[/C][C]102.68[/C][C]103.036242109106[/C][C]-0.356242109106368[/C][/ROW]
[ROW][C]23[/C][C]102.9[/C][C]102.943548979422[/C][C]-0.0435489794222405[/C][/ROW]
[ROW][C]24[/C][C]103.03[/C][C]103.134355440871[/C][C]-0.104355440870793[/C][/ROW]
[ROW][C]25[/C][C]101.29[/C][C]101.478378100563[/C][C]-0.188378100562836[/C][/ROW]
[ROW][C]26[/C][C]103.69[/C][C]103.816560767856[/C][C]-0.126560767855689[/C][/ROW]
[ROW][C]27[/C][C]103.68[/C][C]103.899466149918[/C][C]-0.219466149918047[/C][/ROW]
[ROW][C]28[/C][C]104.2[/C][C]104.195831696317[/C][C]0.00416830368286885[/C][/ROW]
[ROW][C]29[/C][C]104.08[/C][C]104.428552244707[/C][C]-0.348552244706930[/C][/ROW]
[ROW][C]30[/C][C]104.16[/C][C]104.466943131511[/C][C]-0.306943131510678[/C][/ROW]
[ROW][C]31[/C][C]103.05[/C][C]103.119388505175[/C][C]-0.0693885051748819[/C][/ROW]
[ROW][C]32[/C][C]104.66[/C][C]104.823906654617[/C][C]-0.163906654617344[/C][/ROW]
[ROW][C]33[/C][C]104.46[/C][C]104.693681628681[/C][C]-0.233681628680530[/C][/ROW]
[ROW][C]34[/C][C]104.95[/C][C]104.840845158104[/C][C]0.109154841895856[/C][/ROW]
[ROW][C]35[/C][C]105.85[/C][C]105.371384625878[/C][C]0.478615374121607[/C][/ROW]
[ROW][C]36[/C][C]106.23[/C][C]106.088129467809[/C][C]0.141870532190897[/C][/ROW]
[ROW][C]37[/C][C]104.86[/C][C]104.921308391803[/C][C]-0.0613083918033899[/C][/ROW]
[ROW][C]38[/C][C]107.44[/C][C]107.566194045780[/C][C]-0.126194045780208[/C][/ROW]
[ROW][C]39[/C][C]108.23[/C][C]107.922179944602[/C][C]0.307820055397856[/C][/ROW]
[ROW][C]40[/C][C]108.45[/C][C]108.712741277704[/C][C]-0.262741277703879[/C][/ROW]
[ROW][C]41[/C][C]109.39[/C][C]109.202252999665[/C][C]0.187747000334932[/C][/ROW]
[ROW][C]42[/C][C]110.15[/C][C]109.826100580762[/C][C]0.32389941923794[/C][/ROW]
[ROW][C]43[/C][C]109.13[/C][C]109.118154373297[/C][C]0.0118456267025193[/C][/ROW]
[ROW][C]44[/C][C]110.28[/C][C]110.837293654506[/C][C]-0.557293654505717[/C][/ROW]
[ROW][C]45[/C][C]110.17[/C][C]110.17185542149[/C][C]-0.00185542149005972[/C][/ROW]
[ROW][C]46[/C][C]109.99[/C][C]109.699413034523[/C][C]0.290586965476859[/C][/ROW]
[ROW][C]47[/C][C]109.26[/C][C]109.502928053111[/C][C]-0.242928053111039[/C][/ROW]
[ROW][C]48[/C][C]109.11[/C][C]108.988257788545[/C][C]0.121742211455486[/C][/ROW]
[ROW][C]49[/C][C]107.06[/C][C]107.020932431726[/C][C]0.0390675682737915[/C][/ROW]
[ROW][C]50[/C][C]109.53[/C][C]109.017990723696[/C][C]0.512009276304038[/C][/ROW]
[ROW][C]51[/C][C]108.92[/C][C]109.049284294973[/C][C]-0.129284294973075[/C][/ROW]
[ROW][C]52[/C][C]109.24[/C][C]109.023371548130[/C][C]0.216628451869516[/C][/ROW]
[ROW][C]53[/C][C]109.12[/C][C]109.092615685685[/C][C]0.0273843143148939[/C][/ROW]
[ROW][C]54[/C][C]109[/C][C]109.186559158246[/C][C]-0.186559158245781[/C][/ROW]
[ROW][C]55[/C][C]107.23[/C][C]107.604369677474[/C][C]-0.374369677473863[/C][/ROW]
[ROW][C]56[/C][C]109.49[/C][C]109.049749561236[/C][C]0.440250438764319[/C][/ROW]
[ROW][C]57[/C][C]109.04[/C][C]108.952953822363[/C][C]0.0870461776366666[/C][/ROW]
[/TABLE]
Source: https://freestatistics.org/blog/index.php?pk=58144&T=4

Globally Unique Identifier (entire table): ba.freestatistics.org/blog/index.php?pk=58144&T=4

As an alternative you can also use a QR Code:  

The GUIDs for individual cells are displayed in the table below:

Multiple Linear Regression - Actuals, Interpolation, and Residuals
Time or IndexActualsInterpolationForecastResidualsPrediction Error
196.9296.80724879467550.112751205324474
299.0699.2249989025177-0.164998902517677
399.6599.34212162428270.307878375717331
499.8299.81719053840760.00280946159236502
599.9999.98636278021130.00363721978870009
6100.33100.1145792177300.215420782269713
799.3198.9486062886570.361393711342945
8101.1100.8911566695450.208843330454502
9101.1100.7967478146440.303252185356319
10100.93100.973499698266-0.0434996982663469
11100.85101.042138341588-0.192138341588327
12100.93101.089257302776-0.159257302775590
1399.699.5021322812320.0978677187679605
14101.88101.974255560150-0.0942555601504643
15101.81102.076947986224-0.266947986224065
16102.38102.3408649394410.0391350605591298
17102.74102.6102162897320.129783710268405
18102.82102.865817911751-0.0458179117511944
19101.72101.6494811553970.0705188446032803
20103.47103.3978934600960.0721065399042408
21102.98103.134761312822-0.154761312822396
22102.68103.036242109106-0.356242109106368
23102.9102.943548979422-0.0435489794222405
24103.03103.134355440871-0.104355440870793
25101.29101.478378100563-0.188378100562836
26103.69103.816560767856-0.126560767855689
27103.68103.899466149918-0.219466149918047
28104.2104.1958316963170.00416830368286885
29104.08104.428552244707-0.348552244706930
30104.16104.466943131511-0.306943131510678
31103.05103.119388505175-0.0693885051748819
32104.66104.823906654617-0.163906654617344
33104.46104.693681628681-0.233681628680530
34104.95104.8408451581040.109154841895856
35105.85105.3713846258780.478615374121607
36106.23106.0881294678090.141870532190897
37104.86104.921308391803-0.0613083918033899
38107.44107.566194045780-0.126194045780208
39108.23107.9221799446020.307820055397856
40108.45108.712741277704-0.262741277703879
41109.39109.2022529996650.187747000334932
42110.15109.8261005807620.32389941923794
43109.13109.1181543732970.0118456267025193
44110.28110.837293654506-0.557293654505717
45110.17110.17185542149-0.00185542149005972
46109.99109.6994130345230.290586965476859
47109.26109.502928053111-0.242928053111039
48109.11108.9882577885450.121742211455486
49107.06107.0209324317260.0390675682737915
50109.53109.0179907236960.512009276304038
51108.92109.049284294973-0.129284294973075
52109.24109.0233715481300.216628451869516
53109.12109.0926156856850.0273843143148939
54109109.186559158246-0.186559158245781
55107.23107.604369677474-0.374369677473863
56109.49109.0497495612360.440250438764319
57109.04108.9529538223630.0870461776366666


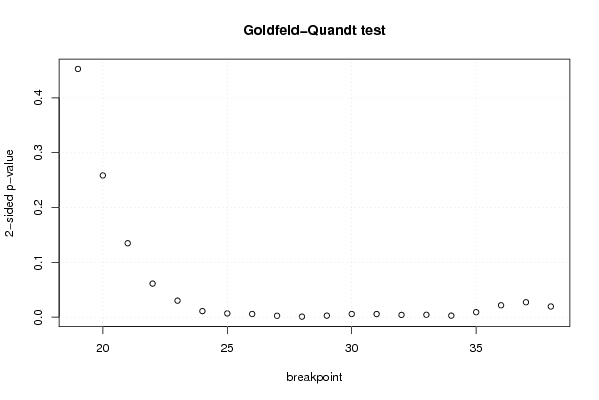
Goldfeld-Quandt test for Heteroskedasticity
p-valuesAlternative Hypothesis
breakpoint indexgreater2-sidedless
190.2263898696163530.4527797392327060.773610130383647
200.1292813865288890.2585627730577780.870718613471111
210.06743706555065190.1348741311013040.932562934449348
220.03064949937286780.06129899874573570.969350500627132
230.01506877567049230.03013755134098450.984931224329508
240.00553834446560310.01107668893120620.994461655534397
250.00346330242076150.0069266048415230.996536697579238
260.002942446533482310.005884893066964620.997057553466518
270.001298644105124420.002597288210248830.998701355894876
280.0005041846983601920.001008369396720380.99949581530164
290.001429329035982250.002858658071964510.998570670964018
300.002911000515384460.005822001030768910.997088999484615
310.002856376166654320.005712752333308630.997143623833346
320.002081533853349460.004163067706698930.99791846614665
330.002188726495228590.004377452990457190.997811273504771
340.001448982650821340.002897965301642670.998551017349179
350.004589665285609490.009179330571218980.99541033471439
360.01086114112708440.02172228225416890.989138858872916
370.01363465068185720.02726930136371430.986365349318143
380.009768122548807770.01953624509761550.990231877451192

\begin{tabular}{lllllllll}
\hline
Goldfeld-Quandt test for Heteroskedasticity \tabularnewline
p-values & Alternative Hypothesis \tabularnewline
breakpoint index & greater & 2-sided & less \tabularnewline
19 & 0.226389869616353 & 0.452779739232706 & 0.773610130383647 \tabularnewline
20 & 0.129281386528889 & 0.258562773057778 & 0.870718613471111 \tabularnewline
21 & 0.0674370655506519 & 0.134874131101304 & 0.932562934449348 \tabularnewline
22 & 0.0306494993728678 & 0.0612989987457357 & 0.969350500627132 \tabularnewline
23 & 0.0150687756704923 & 0.0301375513409845 & 0.984931224329508 \tabularnewline
24 & 0.0055383444656031 & 0.0110766889312062 & 0.994461655534397 \tabularnewline
25 & 0.0034633024207615 & 0.006926604841523 & 0.996536697579238 \tabularnewline
26 & 0.00294244653348231 & 0.00588489306696462 & 0.997057553466518 \tabularnewline
27 & 0.00129864410512442 & 0.00259728821024883 & 0.998701355894876 \tabularnewline
28 & 0.000504184698360192 & 0.00100836939672038 & 0.99949581530164 \tabularnewline
29 & 0.00142932903598225 & 0.00285865807196451 & 0.998570670964018 \tabularnewline
30 & 0.00291100051538446 & 0.00582200103076891 & 0.997088999484615 \tabularnewline
31 & 0.00285637616665432 & 0.00571275233330863 & 0.997143623833346 \tabularnewline
32 & 0.00208153385334946 & 0.00416306770669893 & 0.99791846614665 \tabularnewline
33 & 0.00218872649522859 & 0.00437745299045719 & 0.997811273504771 \tabularnewline
34 & 0.00144898265082134 & 0.00289796530164267 & 0.998551017349179 \tabularnewline
35 & 0.00458966528560949 & 0.00917933057121898 & 0.99541033471439 \tabularnewline
36 & 0.0108611411270844 & 0.0217222822541689 & 0.989138858872916 \tabularnewline
37 & 0.0136346506818572 & 0.0272693013637143 & 0.986365349318143 \tabularnewline
38 & 0.00976812254880777 & 0.0195362450976155 & 0.990231877451192 \tabularnewline
\hline
\end{tabular}
%Source: https://freestatistics.org/blog/index.php?pk=58144&T=5

[TABLE]
[ROW][C]Goldfeld-Quandt test for Heteroskedasticity[/C][/ROW]
[ROW][C]p-values[/C][C]Alternative Hypothesis[/C][/ROW]
[ROW][C]breakpoint index[/C][C]greater[/C][C]2-sided[/C][C]less[/C][/ROW]
[ROW][C]19[/C][C]0.226389869616353[/C][C]0.452779739232706[/C][C]0.773610130383647[/C][/ROW]
[ROW][C]20[/C][C]0.129281386528889[/C][C]0.258562773057778[/C][C]0.870718613471111[/C][/ROW]
[ROW][C]21[/C][C]0.0674370655506519[/C][C]0.134874131101304[/C][C]0.932562934449348[/C][/ROW]
[ROW][C]22[/C][C]0.0306494993728678[/C][C]0.0612989987457357[/C][C]0.969350500627132[/C][/ROW]
[ROW][C]23[/C][C]0.0150687756704923[/C][C]0.0301375513409845[/C][C]0.984931224329508[/C][/ROW]
[ROW][C]24[/C][C]0.0055383444656031[/C][C]0.0110766889312062[/C][C]0.994461655534397[/C][/ROW]
[ROW][C]25[/C][C]0.0034633024207615[/C][C]0.006926604841523[/C][C]0.996536697579238[/C][/ROW]
[ROW][C]26[/C][C]0.00294244653348231[/C][C]0.00588489306696462[/C][C]0.997057553466518[/C][/ROW]
[ROW][C]27[/C][C]0.00129864410512442[/C][C]0.00259728821024883[/C][C]0.998701355894876[/C][/ROW]
[ROW][C]28[/C][C]0.000504184698360192[/C][C]0.00100836939672038[/C][C]0.99949581530164[/C][/ROW]
[ROW][C]29[/C][C]0.00142932903598225[/C][C]0.00285865807196451[/C][C]0.998570670964018[/C][/ROW]
[ROW][C]30[/C][C]0.00291100051538446[/C][C]0.00582200103076891[/C][C]0.997088999484615[/C][/ROW]
[ROW][C]31[/C][C]0.00285637616665432[/C][C]0.00571275233330863[/C][C]0.997143623833346[/C][/ROW]
[ROW][C]32[/C][C]0.00208153385334946[/C][C]0.00416306770669893[/C][C]0.99791846614665[/C][/ROW]
[ROW][C]33[/C][C]0.00218872649522859[/C][C]0.00437745299045719[/C][C]0.997811273504771[/C][/ROW]
[ROW][C]34[/C][C]0.00144898265082134[/C][C]0.00289796530164267[/C][C]0.998551017349179[/C][/ROW]
[ROW][C]35[/C][C]0.00458966528560949[/C][C]0.00917933057121898[/C][C]0.99541033471439[/C][/ROW]
[ROW][C]36[/C][C]0.0108611411270844[/C][C]0.0217222822541689[/C][C]0.989138858872916[/C][/ROW]
[ROW][C]37[/C][C]0.0136346506818572[/C][C]0.0272693013637143[/C][C]0.986365349318143[/C][/ROW]
[ROW][C]38[/C][C]0.00976812254880777[/C][C]0.0195362450976155[/C][C]0.990231877451192[/C][/ROW]
[/TABLE]
Source: https://freestatistics.org/blog/index.php?pk=58144&T=5

Globally Unique Identifier (entire table): ba.freestatistics.org/blog/index.php?pk=58144&T=5

As an alternative you can also use a QR Code:  

The GUIDs for individual cells are displayed in the table below:

Goldfeld-Quandt test for Heteroskedasticity
p-valuesAlternative Hypothesis
breakpoint indexgreater2-sidedless
190.2263898696163530.4527797392327060.773610130383647
200.1292813865288890.2585627730577780.870718613471111
210.06743706555065190.1348741311013040.932562934449348
220.03064949937286780.06129899874573570.969350500627132
230.01506877567049230.03013755134098450.984931224329508
240.00553834446560310.01107668893120620.994461655534397
250.00346330242076150.0069266048415230.996536697579238
260.002942446533482310.005884893066964620.997057553466518
270.001298644105124420.002597288210248830.998701355894876
280.0005041846983601920.001008369396720380.99949581530164
290.001429329035982250.002858658071964510.998570670964018
300.002911000515384460.005822001030768910.997088999484615
310.002856376166654320.005712752333308630.997143623833346
320.002081533853349460.004163067706698930.99791846614665
330.002188726495228590.004377452990457190.997811273504771
340.001448982650821340.002897965301642670.998551017349179
350.004589665285609490.009179330571218980.99541033471439
360.01086114112708440.02172228225416890.989138858872916
370.01363465068185720.02726930136371430.986365349318143
380.009768122548807770.01953624509761550.990231877451192


Meta Analysis of Goldfeld-Quandt test for Heteroskedasticity
Description# significant tests% significant testsOK/NOK
1% type I error level110.55NOK
5% type I error level160.8NOK
10% type I error level170.85NOK

\begin{tabular}{lllllllll}
\hline
Meta Analysis of Goldfeld-Quandt test for Heteroskedasticity \tabularnewline
Description & # significant tests & % significant tests & OK/NOK \tabularnewline
1% type I error level & 11 & 0.55 & NOK \tabularnewline
5% type I error level & 16 & 0.8 & NOK \tabularnewline
10% type I error level & 17 & 0.85 & NOK \tabularnewline
\hline
\end{tabular}
%Source: https://freestatistics.org/blog/index.php?pk=58144&T=6

[TABLE]
[ROW][C]Meta Analysis of Goldfeld-Quandt test for Heteroskedasticity[/C][/ROW]
[ROW][C]Description[/C][C]# significant tests[/C][C]% significant tests[/C][C]OK/NOK[/C][/ROW]
[ROW][C]1% type I error level[/C][C]11[/C][C]0.55[/C][C]NOK[/C][/ROW]
[ROW][C]5% type I error level[/C][C]16[/C][C]0.8[/C][C]NOK[/C][/ROW]
[ROW][C]10% type I error level[/C][C]17[/C][C]0.85[/C][C]NOK[/C][/ROW]
[/TABLE]
Source: https://freestatistics.org/blog/index.php?pk=58144&T=6

Globally Unique Identifier (entire table): ba.freestatistics.org/blog/index.php?pk=58144&T=6

As an alternative you can also use a QR Code:  

The GUIDs for individual cells are displayed in the table below:

Meta Analysis of Goldfeld-Quandt test for Heteroskedasticity
Description# significant tests% significant testsOK/NOK
1% type I error level110.55NOK
5% type I error level160.8NOK
10% type I error level170.85NOK


Parameters (Session):
par1 = 1 ; par2 = Include Monthly Dummies ; par3 = Linear Trend ;
Parameters (R input):
par1 = 1 ; par2 = Include Monthly Dummies ; par3 = Linear Trend ;
R code (references can be found in the software module):
library(lattice)
library(lmtest)
n25 <- 25 #minimum number of obs. for Goldfeld-Quandt test
par1 <- as.numeric(par1)
x <- t(y)
k <- length(x[1,])
n <- length(x[,1])
x1 <- cbind(x[,par1], x[,1:k!=par1])
mycolnames <- c(colnames(x)[par1], colnames(x)[1:k!=par1])
colnames(x1) <- mycolnames #colnames(x)[par1]
x <- x1
if (par3 == 'First Differences'){
x2 <- array(0, dim=c(n-1,k), dimnames=list(1:(n-1), paste('(1-B)',colnames(x),sep='')))
for (i in 1:n-1) {
for (j in 1:k) {
x2[i,j] <- x[i+1,j] - x[i,j]
}
}
x <- x2
}
if (par2 == 'Include Monthly Dummies'){
x2 <- array(0, dim=c(n,11), dimnames=list(1:n, paste('M', seq(1:11), sep ='')))
for (i in 1:11){
x2[seq(i,n,12),i] <- 1
}
x <- cbind(x, x2)
}
if (par2 == 'Include Quarterly Dummies'){
x2 <- array(0, dim=c(n,3), dimnames=list(1:n, paste('Q', seq(1:3), sep ='')))
for (i in 1:3){
x2[seq(i,n,4),i] <- 1
}
x <- cbind(x, x2)
}
k <- length(x[1,])
if (par3 == 'Linear Trend'){
x <- cbind(x, c(1:n))
colnames(x)[k+1] <- 't'
}
x
k <- length(x[1,])
df <- as.data.frame(x)
(mylm <- lm(df))
(mysum <- summary(mylm))
if (n > n25) {
kp3 <- k + 3
nmkm3 <- n - k - 3
gqarr <- array(NA, dim=c(nmkm3-kp3+1,3))
numgqtests <- 0
numsignificant1 <- 0
numsignificant5 <- 0
numsignificant10 <- 0
for (mypoint in kp3:nmkm3) {
j <- 0
numgqtests <- numgqtests + 1
for (myalt in c('greater', 'two.sided', 'less')) {
j <- j + 1
gqarr[mypoint-kp3+1,j] <- gqtest(mylm, point=mypoint, alternative=myalt)$p.value
}
if (gqarr[mypoint-kp3+1,2] < 0.01) numsignificant1 <- numsignificant1 + 1
if (gqarr[mypoint-kp3+1,2] < 0.05) numsignificant5 <- numsignificant5 + 1
if (gqarr[mypoint-kp3+1,2] < 0.10) numsignificant10 <- numsignificant10 + 1
}
gqarr
}
bitmap(file='test0.png')
plot(x[,1], type='l', main='Actuals and Interpolation', ylab='value of Actuals and Interpolation (dots)', xlab='time or index')
points(x[,1]-mysum$resid)
grid()
dev.off()
bitmap(file='test1.png')
plot(mysum$resid, type='b', pch=19, main='Residuals', ylab='value of Residuals', xlab='time or index')
grid()
dev.off()
bitmap(file='test2.png')
hist(mysum$resid, main='Residual Histogram', xlab='values of Residuals')
grid()
dev.off()
bitmap(file='test3.png')
densityplot(~mysum$resid,col='black',main='Residual Density Plot', xlab='values of Residuals')
dev.off()
bitmap(file='test4.png')
qqnorm(mysum$resid, main='Residual Normal Q-Q Plot')
qqline(mysum$resid)
grid()
dev.off()
(myerror <- as.ts(mysum$resid))
bitmap(file='test5.png')
dum <- cbind(lag(myerror,k=1),myerror)
dum
dum1 <- dum[2:length(myerror),]
dum1
z <- as.data.frame(dum1)
z
plot(z,main=paste('Residual Lag plot, lowess, and regression line'), ylab='values of Residuals', xlab='lagged values of Residuals')
lines(lowess(z))
abline(lm(z))
grid()
dev.off()
bitmap(file='test6.png')
acf(mysum$resid, lag.max=length(mysum$resid)/2, main='Residual Autocorrelation Function')
grid()
dev.off()
bitmap(file='test7.png')
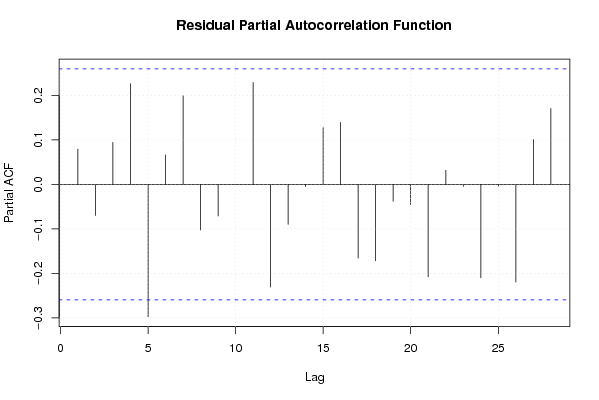
pacf(mysum$resid, lag.max=length(mysum$resid)/2, main='Residual Partial Autocorrelation Function')
grid()
dev.off()
bitmap(file='test8.png')
opar <- par(mfrow = c(2,2), oma = c(0, 0, 1.1, 0))
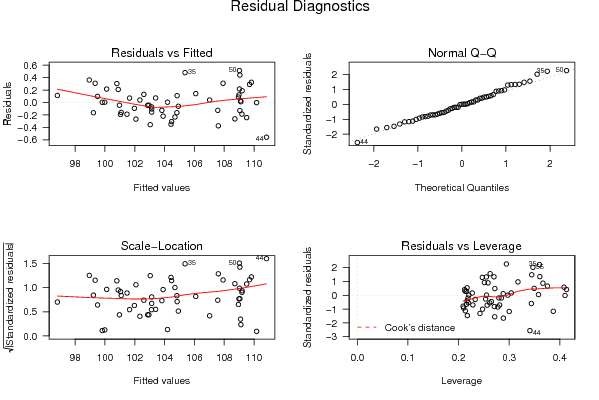
plot(mylm, las = 1, sub='Residual Diagnostics')
par(opar)
dev.off()
if (n > n25) {
bitmap(file='test9.png')
plot(kp3:nmkm3,gqarr[,2], main='Goldfeld-Quandt test',ylab='2-sided p-value',xlab='breakpoint')
grid()
dev.off()
}
load(file='createtable')
a<-table.start()
a<-table.row.start(a)
a<-table.element(a, 'Multiple Linear Regression - Estimated Regression Equation', 1, TRUE)
a<-table.row.end(a)
myeq <- colnames(x)[1]
myeq <- paste(myeq, '[t] = ', sep='')
for (i in 1:k){
if (mysum$coefficients[i,1] > 0) myeq <- paste(myeq, '+', '')
myeq <- paste(myeq, mysum$coefficients[i,1], sep=' ')
if (rownames(mysum$coefficients)[i] != '(Intercept)') {
myeq <- paste(myeq, rownames(mysum$coefficients)[i], sep='')
if (rownames(mysum$coefficients)[i] != 't') myeq <- paste(myeq, '[t]', sep='')
}
}
myeq <- paste(myeq, ' + e[t]')
a<-table.row.start(a)
a<-table.element(a, myeq)
a<-table.row.end(a)
a<-table.end(a)
table.save(a,file='mytable1.tab')
a<-table.start()
a<-table.row.start(a)
a<-table.element(a,hyperlink('ols1.htm','Multiple Linear Regression - Ordinary Least Squares',''), 6, TRUE)
a<-table.row.end(a)
a<-table.row.start(a)
a<-table.element(a,'Variable',header=TRUE)
a<-table.element(a,'Parameter',header=TRUE)
a<-table.element(a,'S.D.',header=TRUE)
a<-table.element(a,'T-STAT
H0: parameter = 0',header=TRUE)
a<-table.element(a,'2-tail p-value',header=TRUE)
a<-table.element(a,'1-tail p-value',header=TRUE)
a<-table.row.end(a)
for (i in 1:k){
a<-table.row.start(a)
a<-table.element(a,rownames(mysum$coefficients)[i],header=TRUE)
a<-table.element(a,mysum$coefficients[i,1])
a<-table.element(a, round(mysum$coefficients[i,2],6))
a<-table.element(a, round(mysum$coefficients[i,3],4))
a<-table.element(a, round(mysum$coefficients[i,4],6))
a<-table.element(a, round(mysum$coefficients[i,4]/2,6))
a<-table.row.end(a)
}
a<-table.end(a)
table.save(a,file='mytable2.tab')
a<-table.start()
a<-table.row.start(a)
a<-table.element(a, 'Multiple Linear Regression - Regression Statistics', 2, TRUE)
a<-table.row.end(a)
a<-table.row.start(a)
a<-table.element(a, 'Multiple R',1,TRUE)
a<-table.element(a, sqrt(mysum$r.squared))
a<-table.row.end(a)
a<-table.row.start(a)
a<-table.element(a, 'R-squared',1,TRUE)
a<-table.element(a, mysum$r.squared)
a<-table.row.end(a)
a<-table.row.start(a)
a<-table.element(a, 'Adjusted R-squared',1,TRUE)
a<-table.element(a, mysum$adj.r.squared)
a<-table.row.end(a)
a<-table.row.start(a)
a<-table.element(a, 'F-TEST (value)',1,TRUE)
a<-table.element(a, mysum$fstatistic[1])
a<-table.row.end(a)
a<-table.row.start(a)
a<-table.element(a, 'F-TEST (DF numerator)',1,TRUE)
a<-table.element(a, mysum$fstatistic[2])
a<-table.row.end(a)
a<-table.row.start(a)
a<-table.element(a, 'F-TEST (DF denominator)',1,TRUE)
a<-table.element(a, mysum$fstatistic[3])
a<-table.row.end(a)
a<-table.row.start(a)
a<-table.element(a, 'p-value',1,TRUE)
a<-table.element(a, 1-pf(mysum$fstatistic[1],mysum$fstatistic[2],mysum$fstatistic[3]))
a<-table.row.end(a)
a<-table.row.start(a)
a<-table.element(a, 'Multiple Linear Regression - Residual Statistics', 2, TRUE)
a<-table.row.end(a)
a<-table.row.start(a)
a<-table.element(a, 'Residual Standard Deviation',1,TRUE)
a<-table.element(a, mysum$sigma)
a<-table.row.end(a)
a<-table.row.start(a)
a<-table.element(a, 'Sum Squared Residuals',1,TRUE)
a<-table.element(a, sum(myerror*myerror))
a<-table.row.end(a)
a<-table.end(a)
table.save(a,file='mytable3.tab')
a<-table.start()
a<-table.row.start(a)
a<-table.element(a, 'Multiple Linear Regression - Actuals, Interpolation, and Residuals', 4, TRUE)
a<-table.row.end(a)
a<-table.row.start(a)
a<-table.element(a, 'Time or Index', 1, TRUE)
a<-table.element(a, 'Actuals', 1, TRUE)
a<-table.element(a, 'Interpolation
Forecast', 1, TRUE)
a<-table.element(a, 'Residuals
Prediction Error', 1, TRUE)
a<-table.row.end(a)
for (i in 1:n) {
a<-table.row.start(a)
a<-table.element(a,i, 1, TRUE)
a<-table.element(a,x[i])
a<-table.element(a,x[i]-mysum$resid[i])
a<-table.element(a,mysum$resid[i])
a<-table.row.end(a)
}
a<-table.end(a)
table.save(a,file='mytable4.tab')
if (n > n25) {
a<-table.start()
a<-table.row.start(a)
a<-table.element(a,'Goldfeld-Quandt test for Heteroskedasticity',4,TRUE)
a<-table.row.end(a)
a<-table.row.start(a)
a<-table.element(a,'p-values',header=TRUE)
a<-table.element(a,'Alternative Hypothesis',3,header=TRUE)
a<-table.row.end(a)
a<-table.row.start(a)
a<-table.element(a,'breakpoint index',header=TRUE)
a<-table.element(a,'greater',header=TRUE)
a<-table.element(a,'2-sided',header=TRUE)
a<-table.element(a,'less',header=TRUE)
a<-table.row.end(a)
for (mypoint in kp3:nmkm3) {
a<-table.row.start(a)
a<-table.element(a,mypoint,header=TRUE)
a<-table.element(a,gqarr[mypoint-kp3+1,1])
a<-table.element(a,gqarr[mypoint-kp3+1,2])
a<-table.element(a,gqarr[mypoint-kp3+1,3])
a<-table.row.end(a)
}
a<-table.end(a)
table.save(a,file='mytable5.tab')
a<-table.start()
a<-table.row.start(a)
a<-table.element(a,'Meta Analysis of Goldfeld-Quandt test for Heteroskedasticity',4,TRUE)
a<-table.row.end(a)
a<-table.row.start(a)
a<-table.element(a,'Description',header=TRUE)
a<-table.element(a,'# significant tests',header=TRUE)
a<-table.element(a,'% significant tests',header=TRUE)
a<-table.element(a,'OK/NOK',header=TRUE)
a<-table.row.end(a)
a<-table.row.start(a)
a<-table.element(a,'1% type I error level',header=TRUE)
a<-table.element(a,numsignificant1)
a<-table.element(a,numsignificant1/numgqtests)
if (numsignificant1/numgqtests < 0.01) dum <- 'OK' else dum <- 'NOK'
a<-table.element(a,dum)
a<-table.row.end(a)
a<-table.row.start(a)
a<-table.element(a,'5% type I error level',header=TRUE)
a<-table.element(a,numsignificant5)
a<-table.element(a,numsignificant5/numgqtests)
if (numsignificant5/numgqtests < 0.05) dum <- 'OK' else dum <- 'NOK'
a<-table.element(a,dum)
a<-table.row.end(a)
a<-table.row.start(a)
a<-table.element(a,'10% type I error level',header=TRUE)
a<-table.element(a,numsignificant10)
a<-table.element(a,numsignificant10/numgqtests)
if (numsignificant10/numgqtests < 0.1) dum <- 'OK' else dum <- 'NOK'
a<-table.element(a,dum)
a<-table.row.end(a)
a<-table.end(a)
table.save(a,file='mytable6.tab')
}