| Multiple Linear Regression - Estimated Regression Equation |
| Y[t] = + 16.11068832504 + 0.00550259812927356X[t] + 0.563481661967873Y1[t] + 0.264939208226435Y2[t] -0.0089156783423854M1[t] -1.63469029339611M2[t] + 1.55987630003095M3[t] + 0.681932272652926M4[t] + 0.249103850212106M5[t] + 0.170577036072006M6[t] + 0.0643935082957647M7[t] -1.38645209180325M8[t] + 0.9533266763827M9[t] + 0.0969898423860808M10[t] -0.171226582904688M11[t] + 0.0245832256744107t + e[t] |
| Multiple Linear Regression - Ordinary Least Squares | |||||
| Variable | Parameter | S.D. | T-STAT H0: parameter = 0 | 2-tail p-value | 1-tail p-value |
| (Intercept) | 16.11068832504 | 4.349466 | 3.7041 | 0.000613 | 0.000307 |
| X | 0.00550259812927356 | 0.000869 | 6.3345 | 0 | 0 |
| Y1 | 0.563481661967873 | 0.13938 | 4.0428 | 0.000221 | 0.00011 |
| Y2 | 0.264939208226435 | 0.130438 | 2.0311 | 0.048601 | 0.0243 |
| M1 | -0.0089156783423854 | 0.184012 | -0.0485 | 0.961586 | 0.480793 |
| M2 | -1.63469029339611 | 0.183923 | -8.8879 | 0 | 0 |
| M3 | 1.55987630003095 | 0.285358 | 5.4664 | 2e-06 | 1e-06 |
| M4 | 0.681932272652926 | 0.361867 | 1.8845 | 0.066433 | 0.033216 |
| M5 | 0.249103850212106 | 0.184143 | 1.3528 | 0.183365 | 0.091683 |
| M6 | 0.170577036072006 | 0.188406 | 0.9054 | 0.370436 | 0.185218 |
| M7 | 0.0643935082957647 | 0.185928 | 0.3463 | 0.73082 | 0.36541 |
| M8 | -1.38645209180325 | 0.185907 | -7.4578 | 0 | 0 |
| M9 | 0.9533266763827 | 0.257504 | 3.7022 | 0.000617 | 0.000308 |
| M10 | 0.0969898423860808 | 0.28776 | 0.3371 | 0.737757 | 0.368878 |
| M11 | -0.171226582904688 | 0.19489 | -0.8786 | 0.384628 | 0.192314 |
| t | 0.0245832256744107 | 0.009308 | 2.6412 | 0.011553 | 0.005776 |
| Multiple Linear Regression - Regression Statistics | |
| Multiple R | 0.99806437715787 |
| R-squared | 0.996132500951525 |
| Adjusted R-squared | 0.994751251291355 |
| F-TEST (value) | 721.182078574541 |
| F-TEST (DF numerator) | 15 |
| F-TEST (DF denominator) | 42 |
| p-value | 0 |
| Multiple Linear Regression - Residual Statistics | |
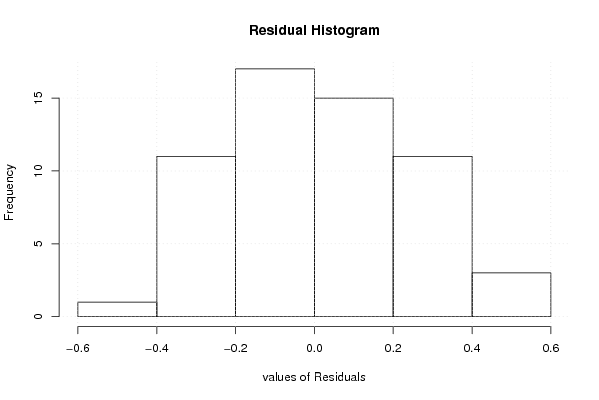
| Residual Standard Deviation | 0.272965625676694 |
| Sum Squared Residuals | 3.12942977764490 |
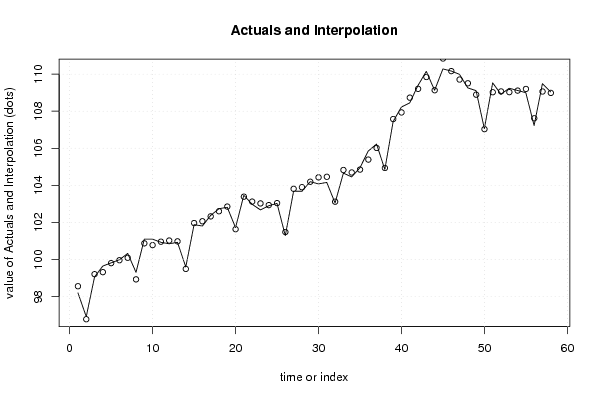
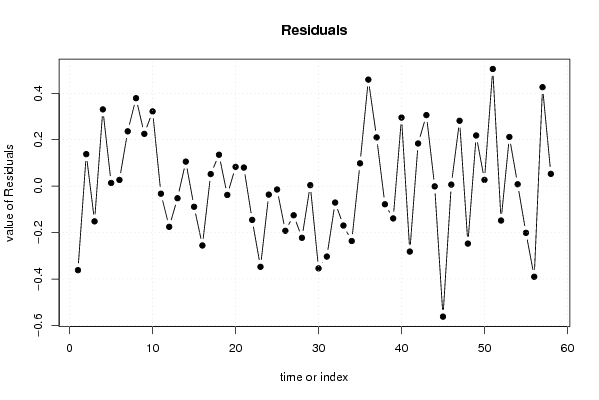
| Multiple Linear Regression - Actuals, Interpolation, and Residuals | |||
| Time or Index | Actuals | Interpolation Forecast | Residuals Prediction Error |
| 1 | 98.2 | 98.5616958491187 | -0.361695849118701 |
| 2 | 96.92 | 96.782208569442 | 0.137791430558001 |
| 3 | 99.06 | 99.2114826631318 | -0.151482663131774 |
| 4 | 99.65 | 99.3194951193331 | 0.330504880666927 |
| 5 | 99.82 | 99.8062719302289 | 0.0137280697711273 |
| 6 | 99.99 | 99.9631648711817 | 0.0268351288182420 |
| 7 | 100.33 | 100.093929892694 | 0.236070107306488 |
| 8 | 99.31 | 98.93125367957 | 0.378746320430079 |
| 9 | 101.1 | 100.874773847320 | 0.225226152680380 |
| 10 | 101.1 | 100.778112862651 | 0.321887137348628 |
| 11 | 100.93 | 100.962499021474 | -0.0324990214744211 |
| 12 | 100.85 | 101.02509928024 | -0.175099280239939 |
| 13 | 100.93 | 100.982013438553 | -0.0520134385528849 |
| 14 | 99.6 | 99.49439779498 | 0.105602205019939 |
| 15 | 101.88 | 101.968804345935 | -0.0888043459345502 |
| 16 | 101.81 | 102.065420900590 | -0.255420900590195 |
| 17 | 102.38 | 102.327993526137 | 0.0520064738627035 |
| 18 | 102.74 | 102.604751990877 | 0.135248009123261 |
| 19 | 102.82 | 102.85776134232 | -0.037761342319952 |
| 20 | 101.72 | 101.636886273740 | 0.0831137262602805 |
| 21 | 103.47 | 103.389957600396 | 0.0800423996037959 |
| 22 | 102.98 | 103.125203494870 | -0.145203494869545 |
| 23 | 102.68 | 103.027288149503 | -0.347288149502712 |
| 24 | 102.9 | 102.936338963345 | -0.0363389633449008 |
| 25 | 103.03 | 103.044363317567 | -0.0143633175666123 |
| 26 | 101.29 | 101.482267521481 | -0.192267521481133 |
| 27 | 103.69 | 103.815379665437 | -0.125379665437035 |
| 28 | 103.68 | 103.902353753493 | -0.222353753492841 |
| 29 | 104.2 | 104.195861615531 | 0.00413838446924012 |
| 30 | 104.08 | 104.433929878645 | -0.353929878644888 |
| 31 | 104.16 | 104.463199391541 | -0.303199391541281 |
| 32 | 103.05 | 103.120656101142 | -0.070656101141637 |
| 33 | 104.66 | 104.829574424274 | -0.169574424273526 |
| 34 | 104.46 | 104.696234041592 | -0.236234041591993 |
| 35 | 104.95 | 104.851746905830 | 0.0982530941696496 |
| 36 | 105.85 | 105.391181786160 | 0.458818213840477 |
| 37 | 106.23 | 106.020141869338 | 0.209858130662301 |
| 38 | 104.86 | 104.938100236274 | -0.0781002362741863 |
| 39 | 107.44 | 107.578950985990 | -0.138950985990441 |
| 40 | 108.23 | 107.934712016673 | 0.295287983326902 |
| 41 | 108.45 | 108.731646604082 | -0.281646604082416 |
| 42 | 109.39 | 109.206313189338 | 0.183686810662242 |
| 43 | 110.15 | 109.844184370585 | 0.305815629414825 |
| 44 | 109.13 | 109.130977802829 | -0.000977802829298137 |
| 45 | 110.28 | 110.841860054954 | -0.56186005495448 |
| 46 | 110.17 | 110.16336636183 | 0.00663363816999925 |
| 47 | 109.99 | 109.708465923193 | 0.281534076807483 |
| 48 | 109.26 | 109.507379970256 | -0.247379970255636 |
| 49 | 109.11 | 108.891785525424 | 0.218214474575898 |
| 50 | 107.06 | 107.033025877823 | 0.0269741221773794 |
| 51 | 109.53 | 109.025382339506 | 0.5046176604938 |
| 52 | 108.92 | 109.068018209911 | -0.148018209910793 |
| 53 | 109.24 | 109.028226324021 | 0.211773675979345 |
| 54 | 109.12 | 109.111840069959 | 0.00815993004114356 |
| 55 | 109 | 109.20092500286 | -0.20092500286008 |
| 56 | 107.23 | 107.620226142719 | -0.390226142719424 |
| 57 | 109.49 | 109.063834073056 | 0.426165926943829 |
| 58 | 109.04 | 108.987083239057 | 0.0529167609429108 |
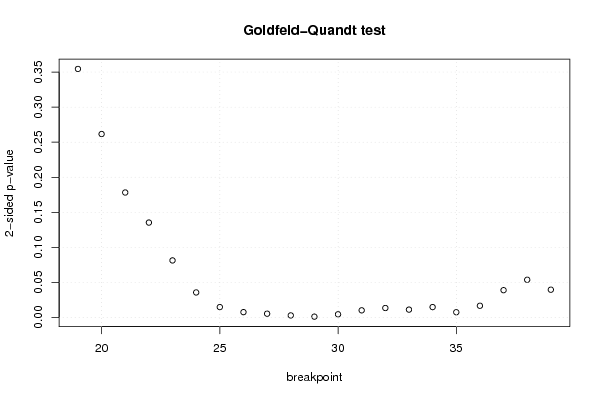
| Goldfeld-Quandt test for Heteroskedasticity | |||
| p-values | Alternative Hypothesis | ||
| breakpoint index | greater | 2-sided | less |
| 19 | 0.177249920439821 | 0.354499840879642 | 0.82275007956018 |
| 20 | 0.130818922608943 | 0.261637845217886 | 0.869181077391057 |
| 21 | 0.0891291954435935 | 0.178258390887187 | 0.910870804556406 |
| 22 | 0.067685756484473 | 0.135371512968946 | 0.932314243515527 |
| 23 | 0.040701040771256 | 0.081402081542512 | 0.959298959228744 |
| 24 | 0.0178522223541326 | 0.0357044447082651 | 0.982147777645867 |
| 25 | 0.00742439256367792 | 0.0148487851273558 | 0.992575607436322 |
| 26 | 0.00380783079774177 | 0.00761566159548354 | 0.996192169202258 |
| 27 | 0.00269038716992946 | 0.00538077433985893 | 0.99730961283007 |
| 28 | 0.00146488056690036 | 0.00292976113380072 | 0.9985351194331 |
| 29 | 0.000588153779758906 | 0.00117630755951781 | 0.99941184622024 |
| 30 | 0.00226356279643795 | 0.00452712559287589 | 0.997736437203562 |
| 31 | 0.00510380251430023 | 0.0102076050286005 | 0.9948961974857 |
| 32 | 0.00675101936927038 | 0.0135020387385408 | 0.99324898063073 |
| 33 | 0.00561057573759687 | 0.0112211514751937 | 0.994389424262403 |
| 34 | 0.00740574269229877 | 0.0148114853845975 | 0.9925942573077 |
| 35 | 0.00374581452602675 | 0.0074916290520535 | 0.996254185473973 |
| 36 | 0.00835298141339484 | 0.0167059628267897 | 0.991647018586605 |
| 37 | 0.0194753229634417 | 0.0389506459268833 | 0.980524677036558 |
| 38 | 0.0268924205842183 | 0.0537848411684366 | 0.973107579415782 |
| 39 | 0.0198125921173112 | 0.0396251842346225 | 0.980187407882689 |
| Meta Analysis of Goldfeld-Quandt test for Heteroskedasticity | |||
| Description | # significant tests | % significant tests | OK/NOK |
| 1% type I error level | 6 | 0.285714285714286 | NOK |
| 5% type I error level | 15 | 0.714285714285714 | NOK |
| 10% type I error level | 17 | 0.80952380952381 | NOK |