| Multiple Linear Regression - Estimated Regression Equation |
| Y[t] = -0.272223696302566 + 0.161944495338189X[t] + 1.20816388613964Y1[t] -0.4678267601091Y2[t] -0.193917063933410Y3[t] + 0.289842816853047Y4[t] + 0.0948685017759605M1[t] + 0.0220364659106159M2[t] + 0.0138541990473369M3[t] + 0.0880521230767941M4[t] + 0.127829043601995M5[t] + 0.146966512755292M6[t] + 0.0874807673669855M7[t] -0.0184272763256771M8[t] -0.0800409575166678M9[t] -0.104472012932639M10[t] + 0.0192887853678653M11[t] + 0.003684875625332t + e[t] |
| Multiple Linear Regression - Ordinary Least Squares | |||||
| Variable | Parameter | S.D. | T-STAT H0: parameter = 0 | 2-tail p-value | 1-tail p-value |
| (Intercept) | -0.272223696302566 | 0.530892 | -0.5128 | 0.611007 | 0.305504 |
| X | 0.161944495338189 | 0.069133 | 2.3425 | 0.024352 | 0.012176 |
| Y1 | 1.20816388613964 | 0.173889 | 6.9479 | 0 | 0 |
| Y2 | -0.4678267601091 | 0.258642 | -1.8088 | 0.078199 | 0.0391 |
| Y3 | -0.193917063933410 | 0.256736 | -0.7553 | 0.454596 | 0.227298 |
| Y4 | 0.289842816853047 | 0.147705 | 1.9623 | 0.05689 | 0.028445 |
| M1 | 0.0948685017759605 | 0.09642 | 0.9839 | 0.331223 | 0.165612 |
| M2 | 0.0220364659106159 | 0.096809 | 0.2276 | 0.821124 | 0.410562 |
| M3 | 0.0138541990473369 | 0.097155 | 0.1426 | 0.887341 | 0.443671 |
| M4 | 0.0880521230767941 | 0.096567 | 0.9118 | 0.367464 | 0.183732 |
| M5 | 0.127829043601995 | 0.097706 | 1.3083 | 0.198427 | 0.099214 |
| M6 | 0.146966512755292 | 0.102955 | 1.4275 | 0.161399 | 0.080699 |
| M7 | 0.0874807673669855 | 0.102078 | 0.857 | 0.396682 | 0.198341 |
| M8 | -0.0184272763256771 | 0.101686 | -0.1812 | 0.857135 | 0.428568 |
| M9 | -0.0800409575166678 | 0.107434 | -0.745 | 0.460722 | 0.230361 |
| M10 | -0.104472012932639 | 0.107614 | -0.9708 | 0.33763 | 0.168815 |
| M11 | 0.0192887853678653 | 0.103038 | 0.1872 | 0.852474 | 0.426237 |
| t | 0.003684875625332 | 0.002479 | 1.4866 | 0.145159 | 0.072579 |
| Multiple Linear Regression - Regression Statistics | |
| Multiple R | 0.981039838756772 |
| R-squared | 0.962439165227914 |
| Adjusted R-squared | 0.946066493660594 |
| F-TEST (value) | 58.7832695031255 |
| F-TEST (DF numerator) | 17 |
| F-TEST (DF denominator) | 39 |
| p-value | 0 |
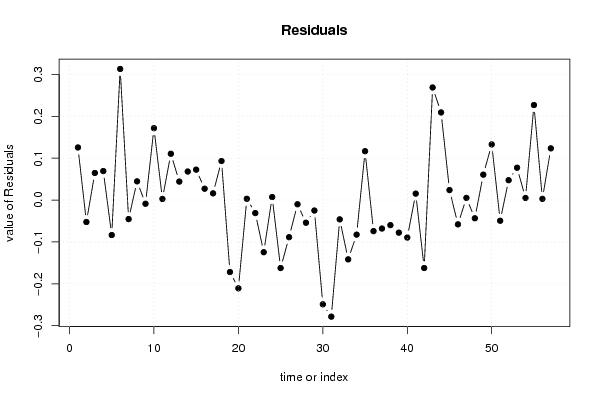
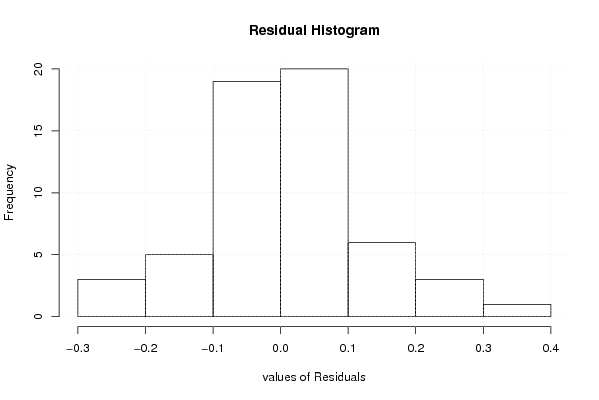
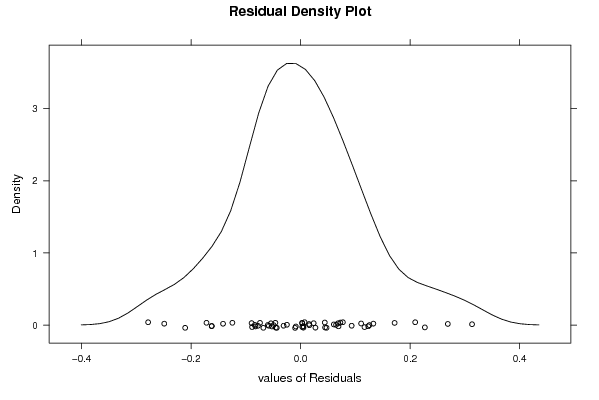
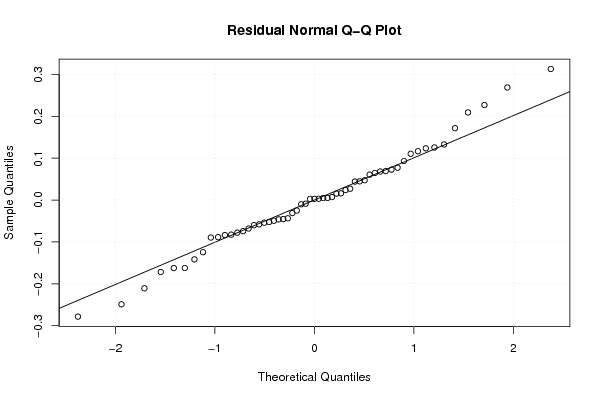
| Multiple Linear Regression - Residual Statistics | |
| Residual Standard Deviation | 0.141875843766754 |
| Sum Squared Residuals | 0.785021446736605 |
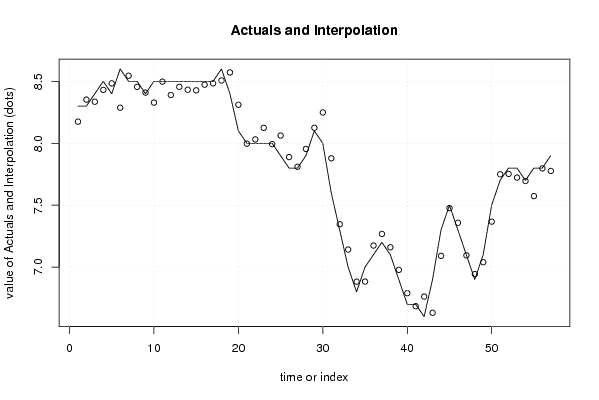
| Multiple Linear Regression - Actuals, Interpolation, and Residuals | |||
| Time or Index | Actuals | Interpolation Forecast | Residuals Prediction Error |
| 1 | 8.3 | 8.17440835721559 | 0.125591642784410 |
| 2 | 8.3 | 8.3523676927898 | -0.052367692789801 |
| 3 | 8.4 | 8.33528702520978 | 0.06471297479022 |
| 4 | 8.5 | 8.4308389188888 | 0.0691610811112 |
| 5 | 8.4 | 8.48355662950711 | -0.0835566295071102 |
| 6 | 8.6 | 8.28699930419989 | 0.313000695800113 |
| 7 | 8.5 | 8.54540091250153 | -0.0454009125015326 |
| 8 | 8.5 | 8.45531093674907 | 0.0446890632509271 |
| 9 | 8.4 | 8.40878601178998 | -0.00878601178997573 |
| 10 | 8.5 | 8.3283892636155 | 0.171610736384496 |
| 11 | 8.5 | 8.497283023278 | 0.00271697672200471 |
| 12 | 8.5 | 8.38951034578262 | 0.110489654217383 |
| 13 | 8.5 | 8.45588218463908 | 0.0441178153609167 |
| 14 | 8.5 | 8.4319137556182 | 0.0680862443818058 |
| 15 | 8.5 | 8.42741636438025 | 0.072583635619753 |
| 16 | 8.5 | 8.4729102649674 | 0.0270897350326019 |
| 17 | 8.5 | 8.4839831620503 | 0.0160168379497067 |
| 18 | 8.6 | 8.50680550682892 | 0.0931944931710776 |
| 19 | 8.4 | 8.57182102567991 | -0.171821025679911 |
| 20 | 8.1 | 8.3107380006443 | -0.210738000644296 |
| 21 | 8 | 7.99692257393286 | 0.00307742606713911 |
| 22 | 8 | 8.03108682896534 | -0.0310868289653364 |
| 23 | 8 | 8.1245494870424 | -0.124549487042402 |
| 24 | 8 | 7.99280109003584 | 0.00719890996416227 |
| 25 | 7.9 | 8.06237018575183 | -0.162370185751825 |
| 26 | 7.8 | 7.88860108643167 | -0.0886010864316686 |
| 27 | 7.8 | 7.81006998259067 | -0.0100699825906667 |
| 28 | 7.9 | 7.9541271646497 | -0.0541271646497065 |
| 29 | 8.1 | 8.12500722365606 | -0.0250072236560602 |
| 30 | 8 | 8.24891758983112 | -0.248917589831125 |
| 31 | 7.6 | 7.87837102536993 | -0.278371025369932 |
| 32 | 7.3 | 7.3460602972901 | -0.0460602972900963 |
| 33 | 7 | 7.14158995108868 | -0.141589951088679 |
| 34 | 6.8 | 6.88254737924166 | -0.0825473792416607 |
| 35 | 7 | 6.88333519547874 | 0.116664804521259 |
| 36 | 7.1 | 7.17415168911006 | -0.0741516891100646 |
| 37 | 7.2 | 7.26798112036809 | -0.0679811203680868 |
| 38 | 7.1 | 7.15992124704002 | -0.0599212470400195 |
| 39 | 6.9 | 6.97781829955301 | -0.0778182995530084 |
| 40 | 6.7 | 6.78947132561365 | -0.0894713256136493 |
| 41 | 6.7 | 6.68465833603526 | 0.0153416639647373 |
| 42 | 6.6 | 6.76226181533563 | -0.162261815335632 |
| 43 | 6.9 | 6.63123720451004 | 0.268762795489959 |
| 44 | 7.3 | 7.09080515886455 | 0.209194841135449 |
| 45 | 7.5 | 7.47615783378445 | 0.0238421662155463 |
| 46 | 7.3 | 7.3579765281775 | -0.0579765281774995 |
| 47 | 7.1 | 7.09483229420086 | 0.00516770579913756 |
| 48 | 6.9 | 6.94353687507148 | -0.0435368750714809 |
| 49 | 7.1 | 7.03935815202541 | 0.0606418479745848 |
| 50 | 7.5 | 7.36719621812032 | 0.132803781879683 |
| 51 | 7.7 | 7.7494083282663 | -0.0494083282662976 |
| 52 | 7.8 | 7.75265232588045 | 0.0473476741195537 |
| 53 | 7.8 | 7.72279464875127 | 0.0772053512487265 |
| 54 | 7.7 | 7.69501578380443 | 0.00498421619556606 |
| 55 | 7.8 | 7.57316983193858 | 0.226830168061416 |
| 56 | 7.8 | 7.79708560645198 | 0.00291439354801666 |
| 57 | 7.9 | 7.77654362940403 | 0.123456370595969 |
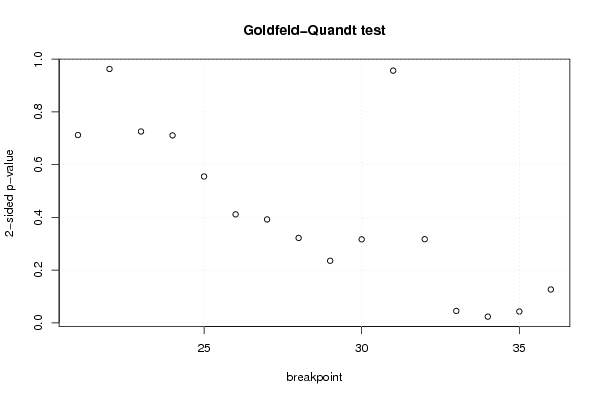
| Goldfeld-Quandt test for Heteroskedasticity | |||
| p-values | Alternative Hypothesis | ||
| breakpoint index | greater | 2-sided | less |
| 21 | 0.643757673305873 | 0.712484653388254 | 0.356242326694127 |
| 22 | 0.518421467965326 | 0.963157064069347 | 0.481578532034674 |
| 23 | 0.362979864301384 | 0.725959728602769 | 0.637020135698616 |
| 24 | 0.355569402950905 | 0.71113880590181 | 0.644430597049095 |
| 25 | 0.277627438212345 | 0.55525487642469 | 0.722372561787655 |
| 26 | 0.205758330188626 | 0.411516660377252 | 0.794241669811374 |
| 27 | 0.196173657676711 | 0.392347315353422 | 0.803826342323289 |
| 28 | 0.161081526607222 | 0.322163053214444 | 0.838918473392778 |
| 29 | 0.117738835647324 | 0.235477671294647 | 0.882261164352676 |
| 30 | 0.158409619724040 | 0.316819239448079 | 0.84159038027596 |
| 31 | 0.521636104133476 | 0.956727791733049 | 0.478363895866524 |
| 32 | 0.841324047940721 | 0.317351904118558 | 0.158675952059279 |
| 33 | 0.977407684972091 | 0.0451846300558172 | 0.0225923150279086 |
| 34 | 0.988250556280508 | 0.0234988874389842 | 0.0117494437194921 |
| 35 | 0.978504159912164 | 0.0429916801756727 | 0.0214958400878364 |
| 36 | 0.936721026339766 | 0.126557947320467 | 0.0632789736602336 |
| Meta Analysis of Goldfeld-Quandt test for Heteroskedasticity | |||
| Description | # significant tests | % significant tests | OK/NOK |
| 1% type I error level | 0 | 0 | OK |
| 5% type I error level | 3 | 0.1875 | NOK |
| 10% type I error level | 3 | 0.1875 | NOK |