| Multiple Linear Regression - Estimated Regression Equation |
| IndGez[t] = + 3.95159574468085 + 0.293617021276596InvlCrisis[t] + 0.249680851063827M1[t] + 0.189680851063829M2[t] + 0.109680851063829M3[t] + 0.189680851063830M4[t] -0.0103191489361709M5[t] -0.230319148936171M6[t] -0.390319148936171M7[t] -0.350319148936171M8[t] -0.325000000000001M9[t] -0.375000000000001M10[t] -0.100000000000001M11[t] + e[t] |
| Multiple Linear Regression - Ordinary Least Squares | |||||
| Variable | Parameter | S.D. | T-STAT H0: parameter = 0 | 2-tail p-value | 1-tail p-value |
| (Intercept) | 3.95159574468085 | 0.596642 | 6.6231 | 0 | 0 |
| InvlCrisis | 0.293617021276596 | 0.384132 | 0.7644 | 0.448824 | 0.224412 |
| M1 | 0.249680851063827 | 0.790276 | 0.3159 | 0.753575 | 0.376788 |
| M2 | 0.189680851063829 | 0.790276 | 0.24 | 0.811456 | 0.405728 |
| M3 | 0.109680851063829 | 0.790276 | 0.1388 | 0.890266 | 0.445133 |
| M4 | 0.189680851063830 | 0.790276 | 0.24 | 0.811456 | 0.405728 |
| M5 | -0.0103191489361709 | 0.790276 | -0.0131 | 0.989642 | 0.494821 |
| M6 | -0.230319148936171 | 0.790276 | -0.2914 | 0.772115 | 0.386058 |
| M7 | -0.390319148936171 | 0.790276 | -0.4939 | 0.623889 | 0.311944 |
| M8 | -0.350319148936171 | 0.790276 | -0.4433 | 0.65978 | 0.32989 |
| M9 | -0.325000000000001 | 0.832778 | -0.3903 | 0.698271 | 0.349135 |
| M10 | -0.375000000000001 | 0.832778 | -0.4503 | 0.654756 | 0.327378 |
| M11 | -0.100000000000001 | 0.832778 | -0.1201 | 0.904979 | 0.45249 |
| Multiple Linear Regression - Regression Statistics | |
| Multiple R | 0.244918091516137 |
| R-squared | 0.0599848715519067 |
| Adjusted R-squared | -0.202344931735933 |
| F-TEST (value) | 0.228662053644315 |
| F-TEST (DF numerator) | 12 |
| F-TEST (DF denominator) | 43 |
| p-value | 0.995819144228298 |
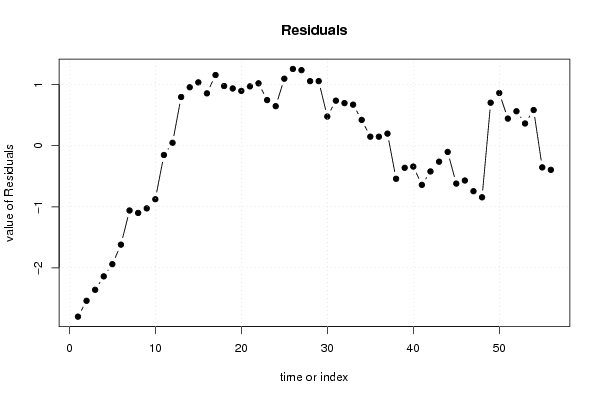
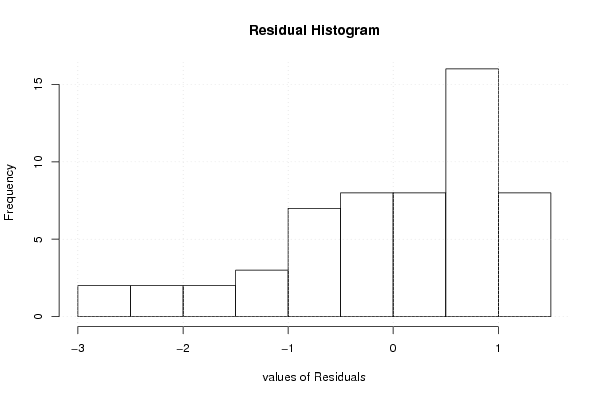
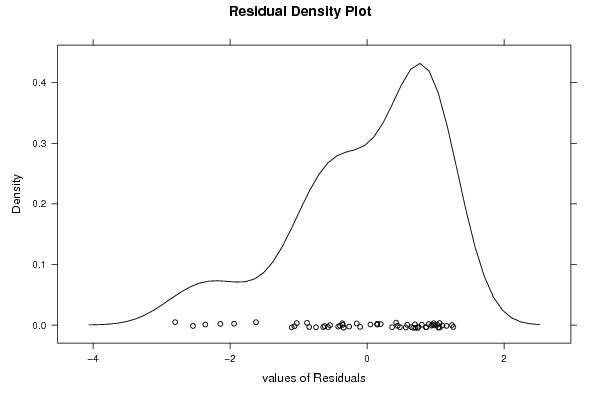
| Multiple Linear Regression - Residual Statistics | |
| Residual Standard Deviation | 1.17772560689915 |
| Sum Squared Residuals | 59.6426170212766 |
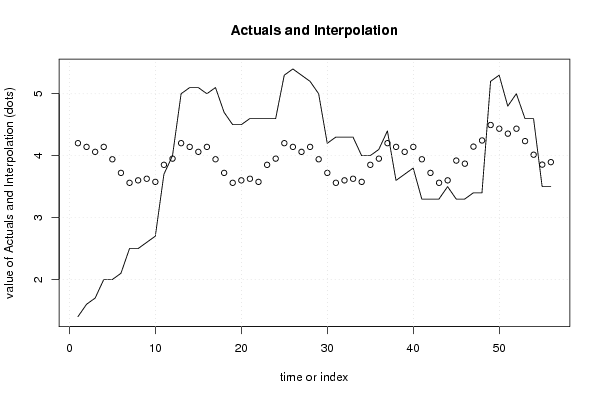
| Multiple Linear Regression - Actuals, Interpolation, and Residuals | |||
| Time or Index | Actuals | Interpolation Forecast | Residuals Prediction Error |
| 1 | 1.4 | 4.20127659574469 | -2.80127659574469 |
| 2 | 1.6 | 4.14127659574468 | -2.54127659574468 |
| 3 | 1.7 | 4.06127659574468 | -2.36127659574468 |
| 4 | 2 | 4.14127659574468 | -2.14127659574468 |
| 5 | 2 | 3.94127659574468 | -1.94127659574468 |
| 6 | 2.1 | 3.72127659574468 | -1.62127659574468 |
| 7 | 2.5 | 3.56127659574468 | -1.06127659574468 |
| 8 | 2.5 | 3.60127659574468 | -1.10127659574468 |
| 9 | 2.6 | 3.62659574468085 | -1.02659574468085 |
| 10 | 2.7 | 3.57659574468085 | -0.87659574468085 |
| 11 | 3.7 | 3.85159574468085 | -0.151595744680851 |
| 12 | 4 | 3.95159574468085 | 0.0484042553191475 |
| 13 | 5 | 4.20127659574468 | 0.798723404255322 |
| 14 | 5.1 | 4.14127659574468 | 0.95872340425532 |
| 15 | 5.1 | 4.06127659574468 | 1.03872340425532 |
| 16 | 5 | 4.14127659574468 | 0.858723404255319 |
| 17 | 5.1 | 3.94127659574468 | 1.15872340425532 |
| 18 | 4.7 | 3.72127659574468 | 0.97872340425532 |
| 19 | 4.5 | 3.56127659574468 | 0.93872340425532 |
| 20 | 4.5 | 3.60127659574468 | 0.898723404255319 |
| 21 | 4.6 | 3.62659574468085 | 0.97340425531915 |
| 22 | 4.6 | 3.57659574468085 | 1.02340425531915 |
| 23 | 4.6 | 3.85159574468085 | 0.748404255319149 |
| 24 | 4.6 | 3.95159574468085 | 0.648404255319148 |
| 25 | 5.3 | 4.20127659574468 | 1.09872340425532 |
| 26 | 5.4 | 4.14127659574468 | 1.25872340425532 |
| 27 | 5.3 | 4.06127659574468 | 1.23872340425532 |
| 28 | 5.2 | 4.14127659574468 | 1.05872340425532 |
| 29 | 5 | 3.94127659574468 | 1.05872340425532 |
| 30 | 4.2 | 3.72127659574468 | 0.478723404255319 |
| 31 | 4.3 | 3.56127659574468 | 0.73872340425532 |
| 32 | 4.3 | 3.60127659574468 | 0.698723404255319 |
| 33 | 4.3 | 3.62659574468085 | 0.67340425531915 |
| 34 | 4 | 3.57659574468085 | 0.423404255319150 |
| 35 | 4 | 3.85159574468085 | 0.148404255319149 |
| 36 | 4.1 | 3.95159574468085 | 0.148404255319148 |
| 37 | 4.4 | 4.20127659574468 | 0.198723404255322 |
| 38 | 3.6 | 4.14127659574468 | -0.54127659574468 |
| 39 | 3.7 | 4.06127659574468 | -0.361276595744681 |
| 40 | 3.8 | 4.14127659574468 | -0.341276595744681 |
| 41 | 3.3 | 3.94127659574468 | -0.641276595744681 |
| 42 | 3.3 | 3.72127659574468 | -0.421276595744681 |
| 43 | 3.3 | 3.56127659574468 | -0.261276595744681 |
| 44 | 3.5 | 3.60127659574468 | -0.101276595744681 |
| 45 | 3.3 | 3.92021276595745 | -0.620212765957447 |
| 46 | 3.3 | 3.87021276595745 | -0.570212765957447 |
| 47 | 3.4 | 4.14521276595745 | -0.745212765957447 |
| 48 | 3.4 | 4.24521276595745 | -0.845212765957448 |
| 49 | 5.2 | 4.49489361702127 | 0.705106382978726 |
| 50 | 5.3 | 4.43489361702128 | 0.865106382978723 |
| 51 | 4.8 | 4.35489361702128 | 0.445106382978723 |
| 52 | 5 | 4.43489361702128 | 0.565106382978723 |
| 53 | 4.6 | 4.23489361702128 | 0.365106382978723 |
| 54 | 4.6 | 4.01489361702128 | 0.585106382978723 |
| 55 | 3.5 | 3.85489361702128 | -0.354893617021277 |
| 56 | 3.5 | 3.89489361702128 | -0.394893617021277 |
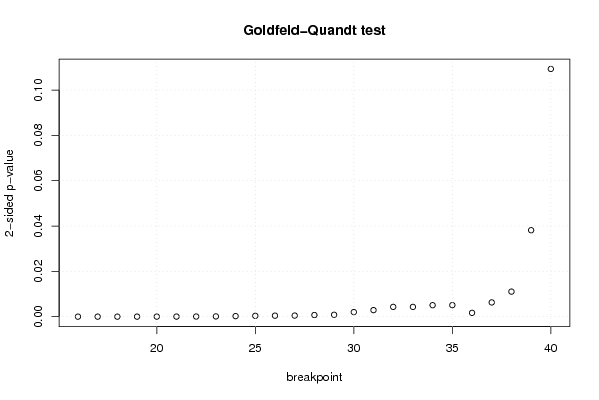
| Goldfeld-Quandt test for Heteroskedasticity | |||
| p-values | Alternative Hypothesis | ||
| breakpoint index | greater | 2-sided | less |
| 16 | 0.999996044996917 | 7.91000616585657e-06 | 3.95500308292829e-06 |
| 17 | 0.999997222325781 | 5.55534843787163e-06 | 2.77767421893581e-06 |
| 18 | 0.99999636585489 | 7.2682902196604e-06 | 3.6341451098302e-06 |
| 19 | 0.999993725270836 | 1.254945832706e-05 | 6.27472916353e-06 |
| 20 | 0.999989000078352 | 2.19998432958388e-05 | 1.09999216479194e-05 |
| 21 | 0.999981275808219 | 3.7448383562669e-05 | 1.87241917813345e-05 |
| 22 | 0.999971286332285 | 5.74273354291272e-05 | 2.87136677145636e-05 |
| 23 | 0.999942536785366 | 0.000114926429267620 | 5.74632146338098e-05 |
| 24 | 0.999882698585769 | 0.000234602828462059 | 0.000117301414231030 |
| 25 | 0.99981690200314 | 0.000366195993722135 | 0.000183097996861068 |
| 26 | 0.999783637591957 | 0.00043272481608552 | 0.00021636240804276 |
| 27 | 0.999759548784868 | 0.000480902430263287 | 0.000240451215131643 |
| 28 | 0.99964250083027 | 0.000714998339462038 | 0.000357499169731019 |
| 29 | 0.999584769297865 | 0.000830461404269521 | 0.000415230702134761 |
| 30 | 0.998987787565668 | 0.00202442486866349 | 0.00101221243433175 |
| 31 | 0.998559895599478 | 0.00288020880104458 | 0.00144010440052229 |
| 32 | 0.9978390540135 | 0.00432189197299845 | 0.00216094598649923 |
| 33 | 0.997842188685963 | 0.00431562262807489 | 0.00215781131403745 |
| 34 | 0.997466367607502 | 0.00506726478499705 | 0.00253363239249852 |
| 35 | 0.99745640935416 | 0.00508718129167849 | 0.00254359064583925 |
| 36 | 0.999157415740752 | 0.00168516851849658 | 0.000842584259248291 |
| 37 | 0.99685664791349 | 0.00628670417301829 | 0.00314335208650915 |
| 38 | 0.994471660095292 | 0.0110566798094169 | 0.00552833990470844 |
| 39 | 0.980923252243788 | 0.0381534955124236 | 0.0190767477562118 |
| 40 | 0.945326351371421 | 0.109347297257157 | 0.0546736486285786 |
| Meta Analysis of Goldfeld-Quandt test for Heteroskedasticity | |||
| Description | # significant tests | % significant tests | OK/NOK |
| 1% type I error level | 22 | 0.88 | NOK |
| 5% type I error level | 24 | 0.96 | NOK |
| 10% type I error level | 24 | 0.96 | NOK |