| Multiple Linear Regression - Estimated Regression Equation |
| Y[t] = + 3354.30967526023 + 0.0263231337674931X[t] -3290.22659632555M1[t] -2995.82535874672M2[t] -2699.26097355517M3[t] -2448.52086637209M4[t] -2163.18883251067M5[t] -1898.93604713372M6[t] -1595.21647601783M7[t] -1294.91359184834M8[t] -985.284579903292M9[t] -677.293648311444M10[t] -357.902102736634M11[t] + 8.41029637407708t + e[t] |
| Multiple Linear Regression - Ordinary Least Squares | |||||
| Variable | Parameter | S.D. | T-STAT H0: parameter = 0 | 2-tail p-value | 1-tail p-value |
| (Intercept) | 3354.30967526023 | 47.110127 | 71.2015 | 0 | 0 |
| X | 0.0263231337674931 | 0.014295 | 1.8414 | 0.072021 | 0.03601 |
| M1 | -3290.22659632555 | 56.484817 | -58.2498 | 0 | 0 |
| M2 | -2995.82535874672 | 56.500306 | -53.0232 | 0 | 0 |
| M3 | -2699.26097355517 | 56.609733 | -47.6819 | 0 | 0 |
| M4 | -2448.52086637209 | 56.870559 | -43.0543 | 0 | 0 |
| M5 | -2163.18883251067 | 58.989503 | -36.6707 | 0 | 0 |
| M6 | -1898.93604713372 | 62.774943 | -30.2499 | 0 | 0 |
| M7 | -1595.21647601783 | 59.861038 | -26.6487 | 0 | 0 |
| M8 | -1294.91359184834 | 58.148033 | -22.2693 | 0 | 0 |
| M9 | -985.284579903292 | 56.978523 | -17.2922 | 0 | 0 |
| M10 | -677.293648311444 | 56.532069 | -11.9807 | 0 | 0 |
| M11 | -357.902102736634 | 56.120128 | -6.3774 | 0 | 0 |
| t | 8.41029637407708 | 0.725339 | 11.595 | 0 | 0 |
| Multiple Linear Regression - Regression Statistics | |
| Multiple R | 0.997355409116792 |
| R-squared | 0.994717812094524 |
| Adjusted R-squared | 0.993225019860367 |
| F-TEST (value) | 666.347124090398 |
| F-TEST (DF numerator) | 13 |
| F-TEST (DF denominator) | 46 |
| p-value | 0 |
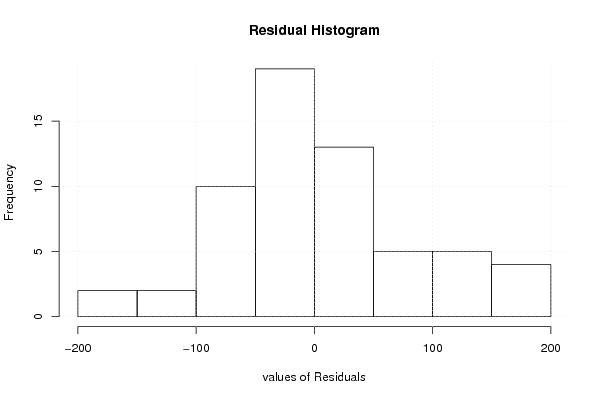
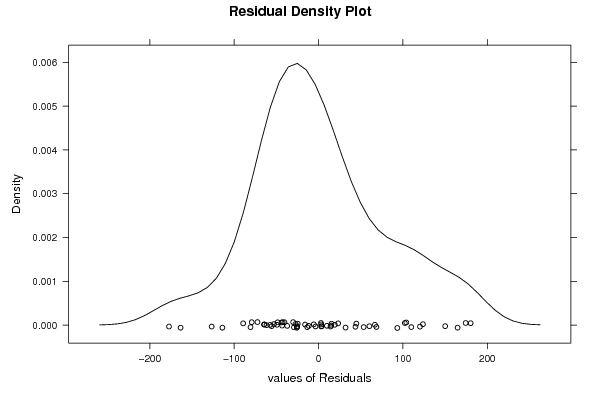
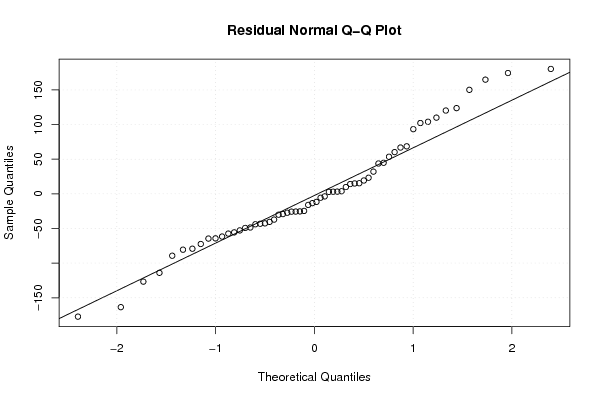
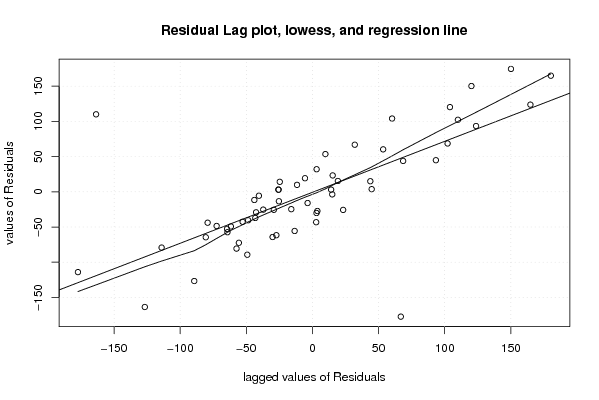
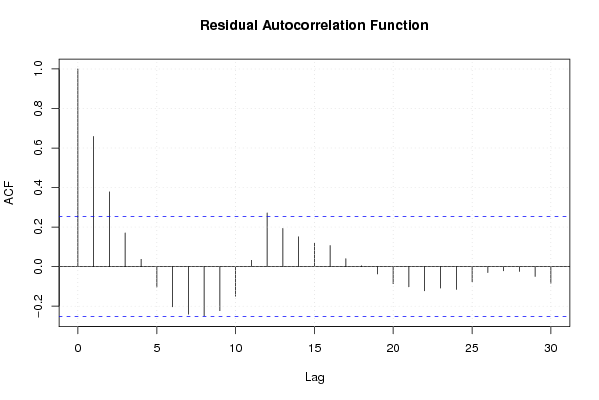
| Multiple Linear Regression - Residual Statistics | |
| Residual Standard Deviation | 88.5111261077739 |
| Sum Squared Residuals | 360374.094463848 |
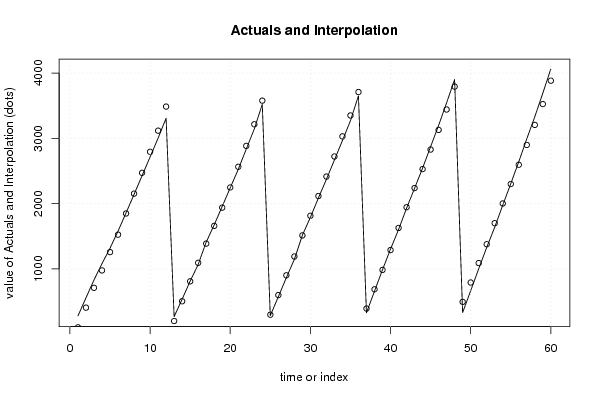
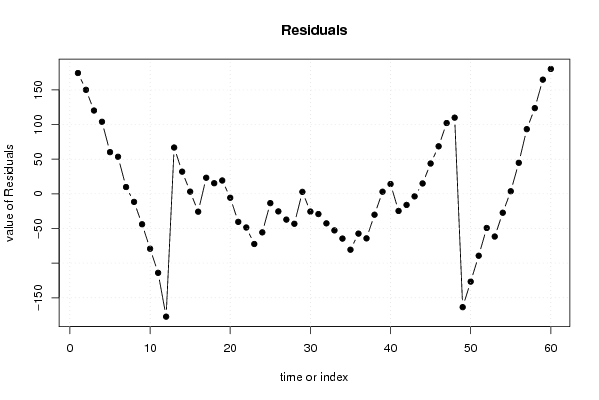
| Multiple Linear Regression - Actuals, Interpolation, and Residuals | |||
| Time or Index | Actuals | Interpolation Forecast | Residuals Prediction Error |
| 1 | 280 | 105.607877588275 | 174.392122411725 |
| 2 | 557 | 406.866346648887 | 150.133653351113 |
| 3 | 831 | 710.761779730045 | 120.238220269955 |
| 4 | 1081 | 976.993106270657 | 104.006893729343 |
| 5 | 1318 | 1257.75813155878 | 60.2418684412153 |
| 6 | 1578 | 1524.49850821213 | 53.5014917878694 |
| 7 | 1859 | 1849.18451050918 | 9.81548949081726 |
| 8 | 2141 | 2152.63306429926 | -11.6330642992569 |
| 9 | 2428 | 2471.90955990545 | -43.9095599054542 |
| 10 | 2715 | 2794.20716983530 | -79.2071698352957 |
| 11 | 3004 | 3118.00789545153 | -114.007895451526 |
| 12 | 3309 | 3486.26820646103 | -177.268206461031 |
| 13 | 269 | 202.161793871788 | 66.8382061282116 |
| 14 | 537 | 504.97332782469 | 32.0266721753097 |
| 15 | 813 | 809.816393721478 | 3.18360627852161 |
| 16 | 1068 | 1093.73686615385 | -25.7368661538465 |
| 17 | 1411 | 1387.76875086079 | 23.2312491392118 |
| 18 | 1675 | 1659.66846173256 | 15.3315382674365 |
| 19 | 1958 | 1938.73647321055 | 19.2635267894478 |
| 20 | 2242 | 2247.60759255673 | -5.60759255672876 |
| 21 | 2524 | 2564.46235985632 | -40.4623598563159 |
| 22 | 2836 | 2884.54882654969 | -48.54882654969 |
| 23 | 3143 | 3215.40415201561 | -72.4041520156063 |
| 24 | 3522 | 3577.61014225859 | -55.6101422585885 |
| 25 | 285 | 298.426155683867 | -13.4261556838671 |
| 26 | 574 | 599.34242400551 | -25.3424240055096 |
| 27 | 865 | 902.1586086022 | -37.1586086022 |
| 28 | 1147 | 1190.18548990230 | -43.1854899022977 |
| 29 | 1516 | 1513.14649861971 | 2.85350138028586 |
| 30 | 1789 | 1814.58076557862 | -25.5807655786167 |
| 31 | 2087 | 2116.18137956158 | -29.1813795615795 |
| 32 | 2372 | 2414.57589166829 | -42.575891668294 |
| 33 | 2669 | 2721.77006887521 | -52.7700688752107 |
| 34 | 2966 | 3030.56391118233 | -64.5639111823307 |
| 35 | 3270 | 3350.62675180357 | -80.6267518035745 |
| 36 | 3652 | 3709.38441152301 | -57.3844115230150 |
| 37 | 329 | 393.242745138733 | -64.2427451387334 |
| 38 | 658 | 688.104692693852 | -30.1046926938525 |
| 39 | 988 | 984.919202791555 | 3.08079720844485 |
| 40 | 1303 | 1288.84525688722 | 14.1547431127822 |
| 41 | 1603 | 1627.67911526643 | -24.679115266433 |
| 42 | 1929 | 1944.98623188713 | -15.9862318871341 |
| 43 | 2235 | 2238.63725947231 | -3.63725947231396 |
| 44 | 2544 | 2529.00321577994 | 14.9967842200572 |
| 45 | 2872 | 2828.22148345531 | 43.7785165446904 |
| 46 | 3198 | 3129.40794010362 | 68.5920598963763 |
| 47 | 3544 | 3441.78442566476 | 102.215574335241 |
| 48 | 3903 | 3793.0136691267 | 109.986330873303 |
| 49 | 332 | 495.561427717336 | -163.561427717336 |
| 50 | 665 | 791.713208827061 | -126.713208827061 |
| 51 | 1001 | 1090.34401515472 | -89.3440151547216 |
| 52 | 1329 | 1378.23928078598 | -49.2392807859809 |
| 53 | 1639 | 1700.64750369428 | -61.6475036942798 |
| 54 | 1975 | 2002.26603258956 | -27.2660325895552 |
| 55 | 2304 | 2300.26037724637 | 3.73962275362838 |
| 56 | 2640 | 2595.18023569578 | 44.8197643042226 |
| 57 | 2992 | 2898.63652790771 | 93.3634720922902 |
| 58 | 3330 | 3206.27215232906 | 123.727847670940 |
| 59 | 3690 | 3525.17677506453 | 164.823224935466 |
| 60 | 4063 | 3882.72357063067 | 180.276429369330 |
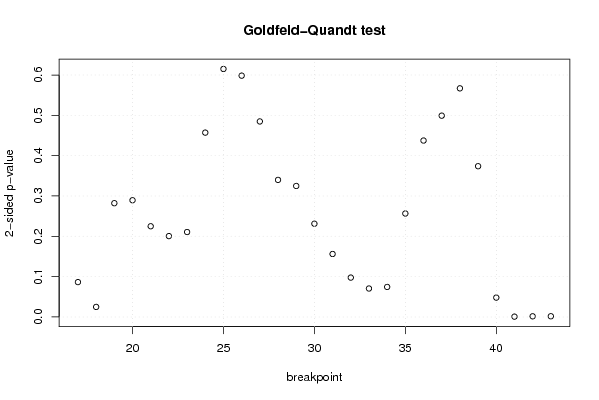
| Goldfeld-Quandt test for Heteroskedasticity | |||
| p-values | Alternative Hypothesis | ||
| breakpoint index | greater | 2-sided | less |
| 17 | 0.0432420155915732 | 0.0864840311831465 | 0.956757984408427 |
| 18 | 0.0124204202621225 | 0.0248408405242451 | 0.987579579737877 |
| 19 | 0.141049668155528 | 0.282099336311056 | 0.858950331844472 |
| 20 | 0.144721986030596 | 0.289443972061191 | 0.855278013969404 |
| 21 | 0.112458304299074 | 0.224916608598149 | 0.887541695700926 |
| 22 | 0.100276518663554 | 0.200553037327109 | 0.899723481336446 |
| 23 | 0.1053307121427 | 0.2106614242854 | 0.8946692878573 |
| 24 | 0.228556982015282 | 0.457113964030564 | 0.771443017984718 |
| 25 | 0.30752487422407 | 0.61504974844814 | 0.69247512577593 |
| 26 | 0.299193524769613 | 0.598387049539226 | 0.700806475230387 |
| 27 | 0.242444803386222 | 0.484889606772445 | 0.757555196613778 |
| 28 | 0.169931059501039 | 0.339862119002077 | 0.830068940498961 |
| 29 | 0.162399000243328 | 0.324798000486656 | 0.837600999756672 |
| 30 | 0.115620030691176 | 0.231240061382353 | 0.884379969308824 |
| 31 | 0.0780872828559032 | 0.156174565711806 | 0.921912717144097 |
| 32 | 0.0487989865266399 | 0.0975979730532797 | 0.95120101347336 |
| 33 | 0.0352801939426494 | 0.0705603878852988 | 0.96471980605735 |
| 34 | 0.0371975284142834 | 0.0743950568285668 | 0.962802471585717 |
| 35 | 0.12827296952074 | 0.25654593904148 | 0.87172703047926 |
| 36 | 0.781256994601329 | 0.437486010797342 | 0.218743005398671 |
| 37 | 0.750415481664047 | 0.499169036671907 | 0.249584518335953 |
| 38 | 0.716515536829269 | 0.566968926341463 | 0.283484463170731 |
| 39 | 0.813087043343334 | 0.373825913313333 | 0.186912956656666 |
| 40 | 0.97601091162152 | 0.0479781767569609 | 0.0239890883784804 |
| 41 | 0.99963230612048 | 0.000735387759042033 | 0.000367693879521017 |
| 42 | 0.999210391142256 | 0.00157921771548736 | 0.00078960885774368 |
| 43 | 0.9991309805363 | 0.00173803892739876 | 0.000869019463699378 |
| Meta Analysis of Goldfeld-Quandt test for Heteroskedasticity | |||
| Description | # significant tests | % significant tests | OK/NOK |
| 1% type I error level | 3 | 0.111111111111111 | NOK |
| 5% type I error level | 5 | 0.185185185185185 | NOK |
| 10% type I error level | 9 | 0.333333333333333 | NOK |