| Multiple Linear Regression - Estimated Regression Equation |
| Y[t] = + 1.34710753037021 + 0.710518726794275X[t] -0.210593615947514M1[t] -0.194875995818465M2[t] + 0.0545559821203266M3[t] + 0.241356836451462M4[t] + 0.207108701921344M5[t] + 0.116019069247684M6[t] + 0.147033181932879M7[t] + 0.305940665441044M8[t] + 0.507479272556865M9[t] + 0.703228254208571M10[t] + 0.625821617821996M11[t] + 0.00319626185069029t + e[t] |
| Multiple Linear Regression - Ordinary Least Squares | |||||
| Variable | Parameter | S.D. | T-STAT H0: parameter = 0 | 2-tail p-value | 1-tail p-value |
| (Intercept) | 1.34710753037021 | 0.735547 | 1.8314 | 0.073378 | 0.036689 |
| X | 0.710518726794275 | 0.068971 | 10.3017 | 0 | 0 |
| M1 | -0.210593615947514 | 0.152691 | -1.3792 | 0.174357 | 0.087179 |
| M2 | -0.194875995818465 | 0.158685 | -1.2281 | 0.225535 | 0.112768 |
| M3 | 0.0545559821203266 | 0.160565 | 0.3398 | 0.73554 | 0.36777 |
| M4 | 0.241356836451462 | 0.165707 | 1.4565 | 0.151895 | 0.075948 |
| M5 | 0.207108701921344 | 0.162893 | 1.2714 | 0.209828 | 0.104914 |
| M6 | 0.116019069247684 | 0.159755 | 0.7262 | 0.471298 | 0.235649 |
| M7 | 0.147033181932879 | 0.159403 | 0.9224 | 0.361032 | 0.180516 |
| M8 | 0.305940665441044 | 0.161149 | 1.8985 | 0.063781 | 0.03189 |
| M9 | 0.507479272556865 | 0.164758 | 3.0801 | 0.003452 | 0.001726 |
| M10 | 0.703228254208571 | 0.170139 | 4.1332 | 0.000146 | 7.3e-05 |
| M11 | 0.625821617821996 | 0.168503 | 3.714 | 0.000541 | 0.00027 |
| t | 0.00319626185069029 | 0.003538 | 0.9034 | 0.370931 | 0.185466 |
| Multiple Linear Regression - Regression Statistics | |
| Multiple R | 0.937247230548335 |
| R-squared | 0.878432371170524 |
| Adjusted R-squared | 0.84480728234535 |
| F-TEST (value) | 26.1243137746855 |
| F-TEST (DF numerator) | 13 |
| F-TEST (DF denominator) | 47 |
| p-value | 0 |
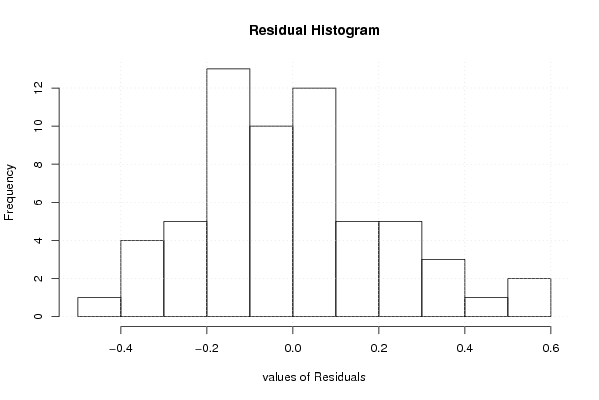
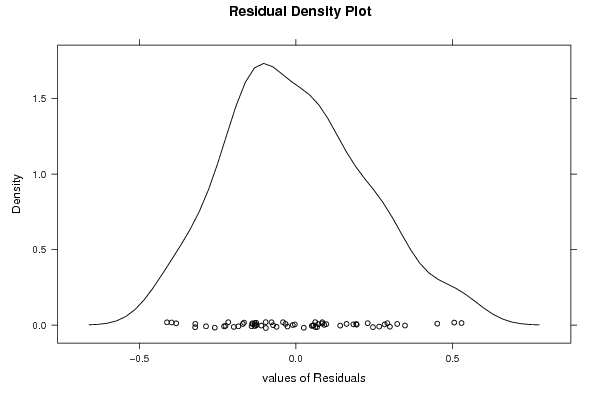
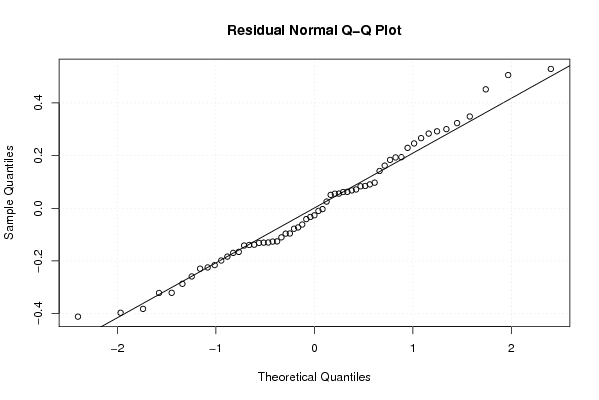
| Multiple Linear Regression - Residual Statistics | |
| Residual Standard Deviation | 0.249200386026404 |
| Sum Squared Residuals | 2.91873912259832 |
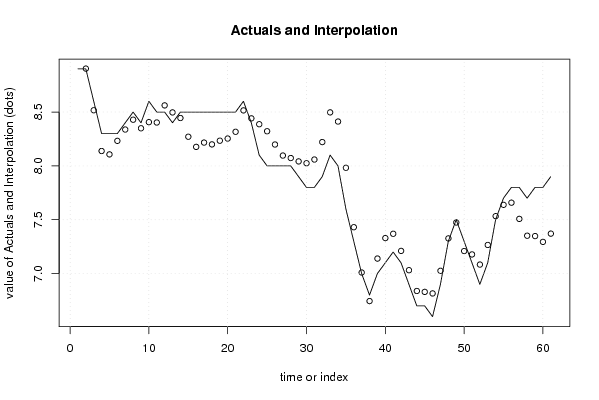
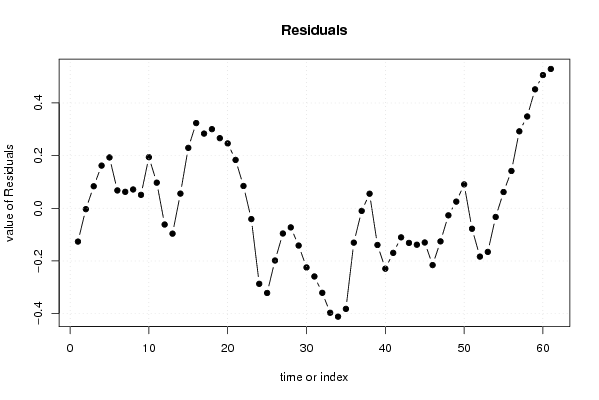
| Multiple Linear Regression - Actuals, Interpolation, and Residuals | |||
| Time or Index | Actuals | Interpolation Forecast | Residuals Prediction Error |
| 1 | 8.9 | 9.02646804368984 | -0.126468043689842 |
| 2 | 8.9 | 8.90327818031073 | -0.00327818031073305 |
| 3 | 8.6 | 8.51643956598537 | 0.0835604340146348 |
| 4 | 8.3 | 8.13802170073177 | 0.161978299268232 |
| 5 | 8.3 | 8.10696982805234 | 0.193030171947659 |
| 6 | 8.3 | 8.23223207526765 | 0.067767924732346 |
| 7 | 8.4 | 8.33749432248297 | 0.0625056775170324 |
| 8 | 8.5 | 8.4285461951624 | 0.0714538048376043 |
| 9 | 8.4 | 8.3490735734112 | 0.0509264265888036 |
| 10 | 8.6 | 8.40591507155474 | 0.194084928445262 |
| 11 | 8.5 | 8.40275656969828 | 0.0972434303017193 |
| 12 | 8.5 | 8.56170181320068 | -0.0617018132006776 |
| 13 | 8.4 | 8.49640820446271 | -0.09640820446271 |
| 14 | 8.5 | 8.44427021376302 | 0.0557297862369788 |
| 15 | 8.5 | 8.27058721747594 | 0.229412782524062 |
| 16 | 8.5 | 8.17637684294005 | 0.323623157059947 |
| 17 | 8.5 | 8.21637684294005 | 0.283623157059947 |
| 18 | 8.5 | 8.19953534479651 | 0.300464655203489 |
| 19 | 8.5 | 8.2337457193324 | 0.266254280667603 |
| 20 | 8.5 | 8.2537457193324 | 0.246254280667604 |
| 21 | 8.5 | 8.31637684294005 | 0.183623157059947 |
| 22 | 8.6 | 8.51532208644245 | 0.0846779135575502 |
| 23 | 8.4 | 8.44111171190657 | -0.0411117119065639 |
| 24 | 8.1 | 8.38690133737068 | -0.286901337370680 |
| 25 | 8 | 8.32160772863271 | -0.321607728632711 |
| 26 | 8 | 8.1984178652536 | -0.198417865253596 |
| 27 | 8 | 8.09578674164594 | -0.0957867416459392 |
| 28 | 8 | 8.07262823978948 | -0.0726282397894817 |
| 29 | 7.9 | 8.04157636711005 | -0.141576367110053 |
| 30 | 7.8 | 8.02473486896651 | -0.224734868966511 |
| 31 | 7.8 | 8.0589452435024 | -0.258945243502397 |
| 32 | 7.9 | 8.22104898886125 | -0.321048988861252 |
| 33 | 8.1 | 8.4968357305072 | -0.396835730507191 |
| 34 | 8 | 8.41157348329188 | -0.411573483291879 |
| 35 | 7.6 | 7.98210374535886 | -0.382103745358856 |
| 36 | 7.3 | 7.43053026206698 | -0.130530262066977 |
| 37 | 7 | 7.00997728993187 | -0.00997728993187062 |
| 38 | 6.8 | 6.7446836811939 | 0.0553163188060994 |
| 39 | 7 | 7.13941566634224 | -0.139415666342237 |
| 40 | 7.1 | 7.32941278252406 | -0.229412782524063 |
| 41 | 7.2 | 7.36941278252406 | -0.169412782524062 |
| 42 | 7.1 | 7.21046753902167 | -0.110467539021665 |
| 43 | 6.9 | 7.03152229551927 | -0.131522295519267 |
| 44 | 6.7 | 6.83836667748098 | -0.138366677480985 |
| 45 | 6.7 | 6.82994592840921 | -0.129945928409214 |
| 46 | 6.6 | 6.81573555387333 | -0.215735553873329 |
| 47 | 6.9 | 7.02573267005515 | -0.125732670055153 |
| 48 | 7.3 | 7.3267816589164 | -0.0267816589164048 |
| 49 | 7.5 | 7.47464366821672 | 0.0253563317832808 |
| 50 | 7.3 | 7.20935005947875 | 0.0906499405212503 |
| 51 | 7.1 | 7.17777080855052 | -0.0777708085505209 |
| 52 | 6.9 | 7.08356043401464 | -0.183560434014635 |
| 53 | 7.1 | 7.26566417937349 | -0.165664179373491 |
| 54 | 7.5 | 7.53303017194766 | -0.0330301719476587 |
| 55 | 7.7 | 7.63829241916297 | 0.0617075808370284 |
| 56 | 7.8 | 7.65829241916297 | 0.141707580837029 |
| 57 | 7.8 | 7.50776792473235 | 0.292232075267654 |
| 58 | 7.7 | 7.35145380483760 | 0.348546195162396 |
| 59 | 7.8 | 7.34829530298115 | 0.451704697018853 |
| 60 | 7.8 | 7.29408492844526 | 0.505915071554739 |
| 61 | 7.9 | 7.37089506506615 | 0.529104934933852 |
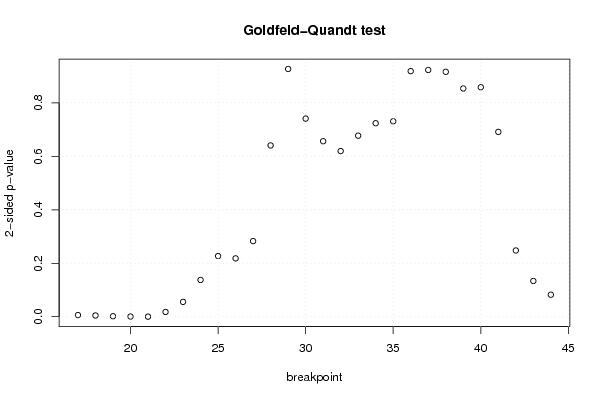
| Goldfeld-Quandt test for Heteroskedasticity | |||
| p-values | Alternative Hypothesis | ||
| breakpoint index | greater | 2-sided | less |
| 17 | 0.00313608424441361 | 0.00627216848882722 | 0.996863915755586 |
| 18 | 0.00238361833414975 | 0.00476723666829949 | 0.99761638166585 |
| 19 | 0.000928337645312247 | 0.00185667529062449 | 0.999071662354688 |
| 20 | 0.000357322829808654 | 0.000714645659617307 | 0.999642677170191 |
| 21 | 0.000152201673941521 | 0.000304403347883041 | 0.999847798326059 |
| 22 | 0.00895181493975177 | 0.0179036298795035 | 0.991048185060248 |
| 23 | 0.0277916927657106 | 0.0555833855314212 | 0.97220830723429 |
| 24 | 0.068766573718415 | 0.13753314743683 | 0.931233426281585 |
| 25 | 0.113452238083703 | 0.226904476167407 | 0.886547761916297 |
| 26 | 0.109171976131787 | 0.218343952263575 | 0.890828023868213 |
| 27 | 0.141403533701404 | 0.282807067402809 | 0.858596466298596 |
| 28 | 0.320241774566180 | 0.640483549132361 | 0.67975822543382 |
| 29 | 0.536718620308047 | 0.926562759383907 | 0.463281379691953 |
| 30 | 0.629572103244496 | 0.740855793511008 | 0.370427896755504 |
| 31 | 0.671865386895622 | 0.656269226208756 | 0.328134613104378 |
| 32 | 0.690276415420623 | 0.619447169158754 | 0.309723584579377 |
| 33 | 0.661473491226986 | 0.677053017546028 | 0.338526508773014 |
| 34 | 0.638180878575963 | 0.723638242848075 | 0.361819121424037 |
| 35 | 0.634546355272165 | 0.730907289455669 | 0.365453644727835 |
| 36 | 0.54082227162493 | 0.91835545675014 | 0.45917772837507 |
| 37 | 0.46136436819478 | 0.92272873638956 | 0.53863563180522 |
| 38 | 0.457885583369924 | 0.915771166739848 | 0.542114416630076 |
| 39 | 0.426776374298019 | 0.853552748596039 | 0.57322362570198 |
| 40 | 0.429119209843677 | 0.858238419687355 | 0.570880790156323 |
| 41 | 0.654415249221468 | 0.691169501557064 | 0.345584750778532 |
| 42 | 0.876124530933486 | 0.247750938133027 | 0.123875469066514 |
| 43 | 0.933196380962913 | 0.133607238074175 | 0.0668036190370875 |
| 44 | 0.958843509703552 | 0.0823129805928954 | 0.0411564902964477 |
| Meta Analysis of Goldfeld-Quandt test for Heteroskedasticity | |||
| Description | # significant tests | % significant tests | OK/NOK |
| 1% type I error level | 5 | 0.178571428571429 | NOK |
| 5% type I error level | 6 | 0.214285714285714 | NOK |
| 10% type I error level | 8 | 0.285714285714286 | NOK |