| Multiple Linear Regression - Estimated Regression Equation |
| TotaleIndustrieleProductie[t] = + 60.5723257968456 + 0.409406491194934Investeringsgoederen[t] -1.73997398875970M1[t] -15.2224134744869M2[t] -6.2587520538734M3[t] -6.80666085283433M4[t] -6.50781928966874M5[t] -6.61544127689258M6[t] -8.39735230028105M7[t] -6.49855556195852M8[t] -11.1638483388052M9[t] -2.95344127395409M10[t] + 0.902654510456986M11[t] + 0.0728314508847354t + e[t] |
| Multiple Linear Regression - Ordinary Least Squares | |||||
| Variable | Parameter | S.D. | T-STAT H0: parameter = 0 | 2-tail p-value | 1-tail p-value |
| (Intercept) | 60.5723257968456 | 4.259408 | 14.2208 | 0 | 0 |
| Investeringsgoederen | 0.409406491194934 | 0.030486 | 13.4294 | 0 | 0 |
| M1 | -1.73997398875970 | 2.199106 | -0.7912 | 0.432877 | 0.216439 |
| M2 | -15.2224134744869 | 2.093141 | -7.2725 | 0 | 0 |
| M3 | -6.2587520538734 | 1.945574 | -3.2169 | 0.002374 | 0.001187 |
| M4 | -6.80666085283433 | 1.927506 | -3.5313 | 0.000953 | 0.000476 |
| M5 | -6.50781928966874 | 1.922936 | -3.3843 | 0.001468 | 0.000734 |
| M6 | -6.61544127689258 | 1.91523 | -3.4541 | 0.001197 | 0.000598 |
| M7 | -8.39735230028105 | 1.928115 | -4.3552 | 7.4e-05 | 3.7e-05 |
| M8 | -6.49855556195852 | 1.980525 | -3.2812 | 0.001976 | 0.000988 |
| M9 | -11.1638483388052 | 1.913423 | -5.8345 | 1e-06 | 0 |
| M10 | -2.95344127395409 | 1.918586 | -1.5394 | 0.130562 | 0.065281 |
| M11 | 0.902654510456986 | 1.900459 | 0.475 | 0.637058 | 0.318529 |
| t | 0.0728314508847354 | 0.023235 | 3.1345 | 0.002996 | 0.001498 |
| Multiple Linear Regression - Regression Statistics | |
| Multiple R | 0.96132580989825 |
| R-squared | 0.924147312776527 |
| Adjusted R-squared | 0.902710683778589 |
| F-TEST (value) | 43.1106641284607 |
| F-TEST (DF numerator) | 13 |
| F-TEST (DF denominator) | 46 |
| p-value | 0 |
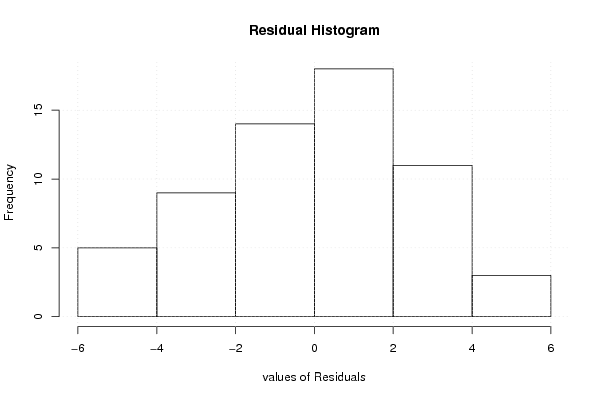
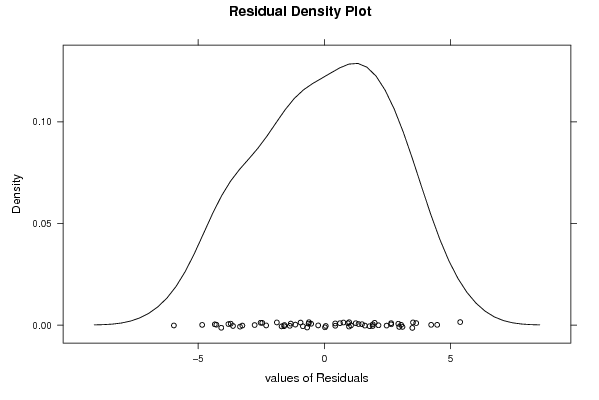
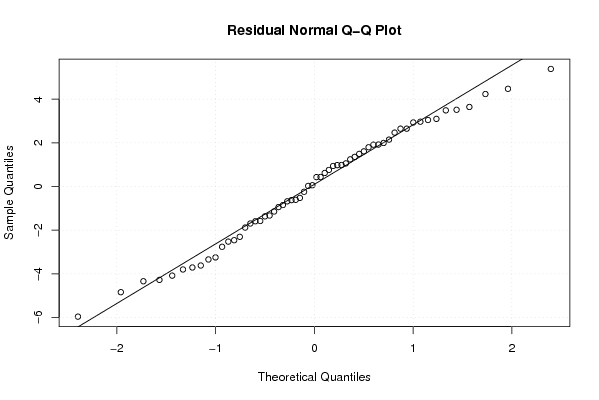
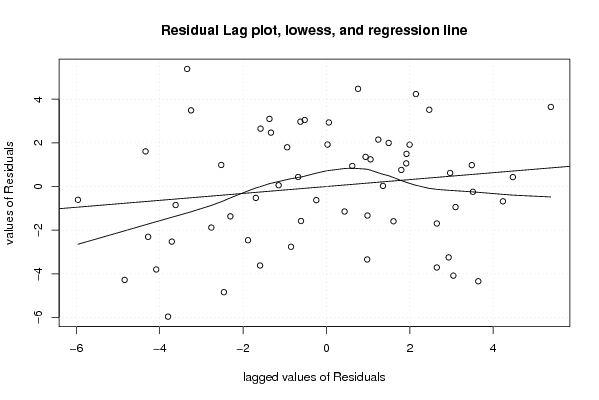
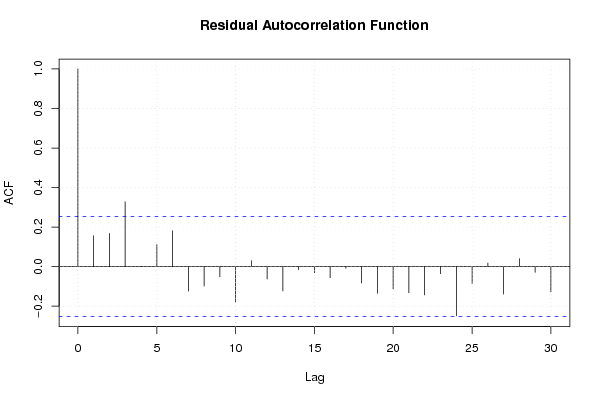
| Multiple Linear Regression - Residual Statistics | |
| Residual Standard Deviation | 3.00233118796081 |
| Sum Squared Residuals | 414.643657861300 |
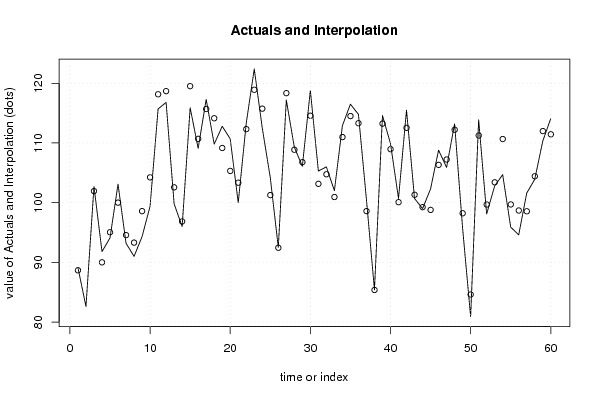
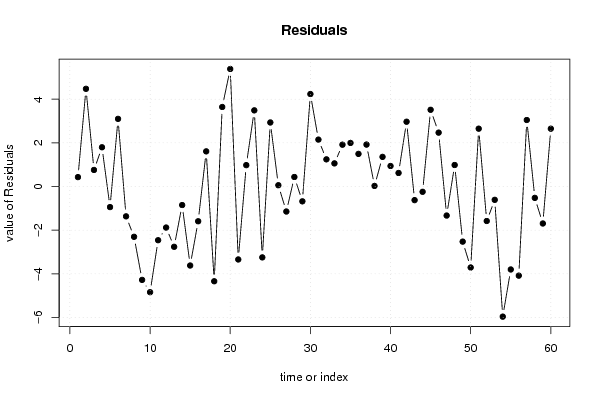
| Multiple Linear Regression - Actuals, Interpolation, and Residuals | |||
| Time or Index | Actuals | Interpolation Forecast | Residuals Prediction Error |
| 1 | 89.1 | 88.6690351688427 | 0.430964831157306 |
| 2 | 82.6 | 78.1252725723645 | 4.4747274276355 |
| 3 | 102.7 | 101.941339776000 | 0.758660224000175 |
| 4 | 91.8 | 90.0028806744654 | 1.79711932553455 |
| 5 | 94.1 | 95.041787688138 | -0.941787688138045 |
| 6 | 103.1 | 100.001756344377 | 3.09824365562285 |
| 7 | 93.2 | 94.5670777019995 | -1.36707770199949 |
| 8 | 91 | 93.3043946107668 | -2.30439461076679 |
| 9 | 94.3 | 98.5786297226028 | -4.27862972260281 |
| 10 | 99.4 | 104.241666694691 | -4.84166669469101 |
| 11 | 115.7 | 118.160112315143 | -2.46011231514323 |
| 12 | 116.8 | 118.681330676514 | -1.88133067651427 |
| 13 | 99.8 | 102.562138999458 | -2.76213899945812 |
| 14 | 96 | 96.8493729990804 | -0.849372999080426 |
| 15 | 115.9 | 119.51910202737 | -3.61910202736996 |
| 16 | 109.1 | 110.692132258917 | -1.59213225891710 |
| 17 | 117.3 | 115.690098623470 | 1.60990137652981 |
| 18 | 109.8 | 114.140504069710 | -4.34050406970983 |
| 19 | 112.8 | 109.156172567647 | 3.64382743235337 |
| 20 | 110.7 | 105.314228581886 | 5.38577141811418 |
| 21 | 100 | 103.341968799572 | -3.3419687995715 |
| 22 | 113.3 | 112.321198350339 | 0.97880164966131 |
| 23 | 122.4 | 118.911267778402 | 3.48873222159844 |
| 24 | 112.5 | 115.747827719018 | -3.2478277190182 |
| 25 | 104.2 | 101.266262006742 | 2.93373799325821 |
| 26 | 92.5 | 92.4420066732826 | 0.057993326717399 |
| 27 | 117.2 | 118.346046982012 | -1.14604698201212 |
| 28 | 109.3 | 108.864026827647 | 0.435973172352637 |
| 29 | 106.1 | 106.779260894528 | -0.679260894528087 |
| 30 | 118.8 | 114.564134340012 | 4.23586565998778 |
| 31 | 105.3 | 103.152120926189 | 2.14787907381145 |
| 32 | 106 | 104.755283273320 | 1.24471672667962 |
| 33 | 102 | 100.940694280629 | 1.05930571937115 |
| 34 | 112.9 | 110.984380708503 | 1.91561929149714 |
| 35 | 116.5 | 114.503901452604 | 1.99609854739626 |
| 36 | 114.8 | 113.305612550956 | 1.49438744904394 |
| 37 | 100.5 | 98.5784029439627 | 1.92159705603731 |
| 38 | 85.4 | 85.3734981547177 | 0.0265018452823059 |
| 39 | 114.6 | 113.242689621183 | 1.35731037881709 |
| 40 | 109.9 | 108.960131904994 | 0.939868095006193 |
| 41 | 100.7 | 100.079218218039 | 0.620781781961381 |
| 42 | 115.5 | 112.531325663145 | 2.96867433685499 |
| 43 | 100.7 | 101.324015494919 | -0.624015494918803 |
| 44 | 99 | 99.2425194212962 | -0.242519421296228 |
| 45 | 102.3 | 98.7850636564032 | 3.51493634359684 |
| 46 | 108.8 | 106.331370487988 | 2.46862951201191 |
| 47 | 105.9 | 107.230689688441 | -1.33068968844137 |
| 48 | 113.2 | 112.214438803837 | 0.985561196162808 |
| 49 | 95.7 | 98.2241608809947 | -2.52416088099471 |
| 50 | 80.9 | 84.6098496005548 | -3.70984960055478 |
| 51 | 113.9 | 111.250821593435 | 2.64917840656482 |
| 52 | 98.1 | 99.6808283339763 | -1.58082833397627 |
| 53 | 102.8 | 103.409634575825 | -0.609634575825055 |
| 54 | 104.7 | 110.662279582756 | -5.96227958275578 |
| 55 | 95.9 | 99.7006133092465 | -3.80061330924653 |
| 56 | 94.6 | 98.6835741127308 | -4.08357411273079 |
| 57 | 101.6 | 98.5536435407937 | 3.04635645920633 |
| 58 | 103.9 | 104.421383758479 | -0.521383758479346 |
| 59 | 110.3 | 111.99402876541 | -1.69402876541008 |
| 60 | 114.1 | 111.450790249674 | 2.64920975032571 |
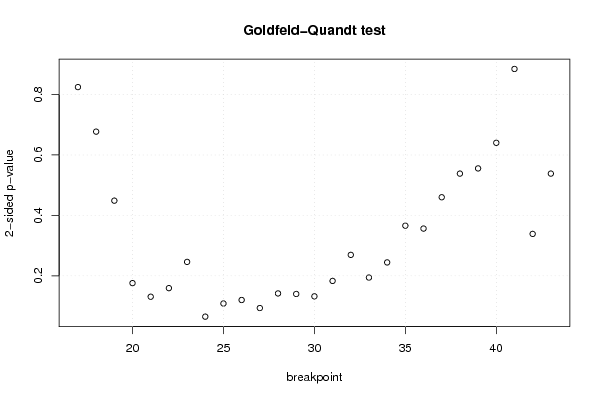
| Goldfeld-Quandt test for Heteroskedasticity | |||
| p-values | Alternative Hypothesis | ||
| breakpoint index | greater | 2-sided | less |
| 17 | 0.412306790361790 | 0.824613580723579 | 0.58769320963821 |
| 18 | 0.338570421617947 | 0.677140843235893 | 0.661429578382053 |
| 19 | 0.775642259353388 | 0.448715481293223 | 0.224357740646612 |
| 20 | 0.912071158511812 | 0.175857682976376 | 0.0879288414881879 |
| 21 | 0.934596857912147 | 0.130806284175706 | 0.0654031420878532 |
| 22 | 0.920353554883096 | 0.159292890233809 | 0.0796464451169044 |
| 23 | 0.876955446835663 | 0.246089106328675 | 0.123044553164337 |
| 24 | 0.96755062418153 | 0.0648987516369419 | 0.0324493758184709 |
| 25 | 0.94581066266743 | 0.10837867466514 | 0.05418933733257 |
| 26 | 0.940003945835165 | 0.119992108329671 | 0.0599960541648355 |
| 27 | 0.953282500358692 | 0.0934349992826159 | 0.0467174996413080 |
| 28 | 0.92915395441313 | 0.141692091173741 | 0.0708460455868707 |
| 29 | 0.93004055612148 | 0.139918887757042 | 0.0699594438785208 |
| 30 | 0.933929296349473 | 0.132141407301054 | 0.0660707036505271 |
| 31 | 0.908426024987212 | 0.183147950025576 | 0.0915739750127881 |
| 32 | 0.865316700957472 | 0.269366598085056 | 0.134683299042528 |
| 33 | 0.902857181618135 | 0.19428563676373 | 0.097142818381865 |
| 34 | 0.877816724801924 | 0.244366550396152 | 0.122183275198076 |
| 35 | 0.817051194411165 | 0.36589761117767 | 0.182948805588835 |
| 36 | 0.821796760967626 | 0.356406478064748 | 0.178203239032374 |
| 37 | 0.769996402982864 | 0.460007194034273 | 0.230003597017136 |
| 38 | 0.730905789635586 | 0.538188420728827 | 0.269094210364414 |
| 39 | 0.72228300267172 | 0.55543399465656 | 0.27771699732828 |
| 40 | 0.679939430071733 | 0.640121139856533 | 0.320060569928267 |
| 41 | 0.557715247915976 | 0.884569504168049 | 0.442284752084024 |
| 42 | 0.830621784338344 | 0.338756431323312 | 0.169378215661656 |
| 43 | 0.730866058853745 | 0.538267882292511 | 0.269133941146255 |
| Meta Analysis of Goldfeld-Quandt test for Heteroskedasticity | |||
| Description | # significant tests | % significant tests | OK/NOK |
| 1% type I error level | 0 | 0 | OK |
| 5% type I error level | 0 | 0 | OK |
| 10% type I error level | 2 | 0.0740740740740741 | OK |