| Multiple Linear Regression - Estimated Regression Equation |
| Y[t] = + 10746.1453026392 + 1.41721562690964X[t] + e[t] |
| Multiple Linear Regression - Ordinary Least Squares | |||||
| Variable | Parameter | S.D. | T-STAT H0: parameter = 0 | 2-tail p-value | 1-tail p-value |
| (Intercept) | 10746.1453026392 | 1219.242775 | 8.8138 | 0 | 0 |
| X | 1.41721562690964 | 0.505825 | 2.8018 | 0.006896 | 0.003448 |
| Multiple Linear Regression - Regression Statistics | |
| Multiple R | 0.345269196870399 |
| R-squared | 0.119210818307530 |
| Adjusted R-squared | 0.104024797933522 |
| F-TEST (value) | 7.85003676878821 |
| F-TEST (DF numerator) | 1 |
| F-TEST (DF denominator) | 58 |
| p-value | 0.00689613986257798 |
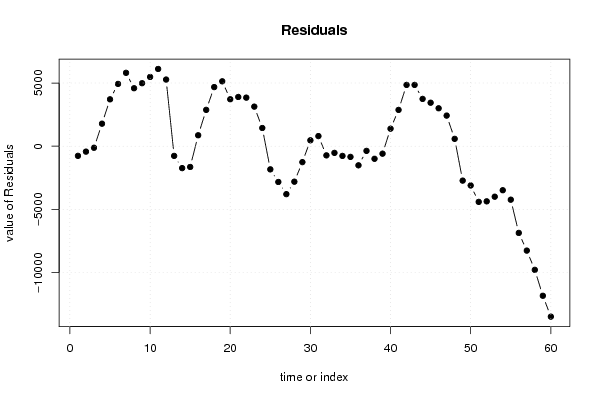
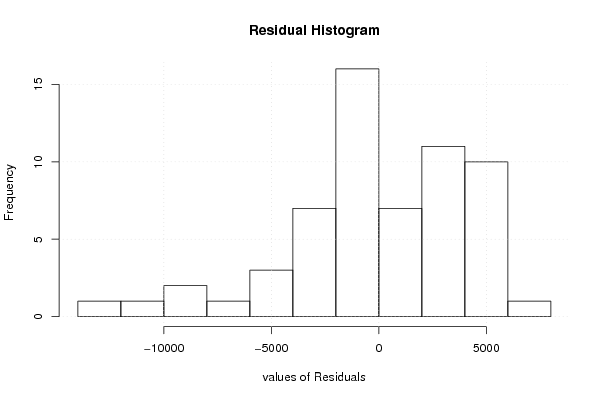
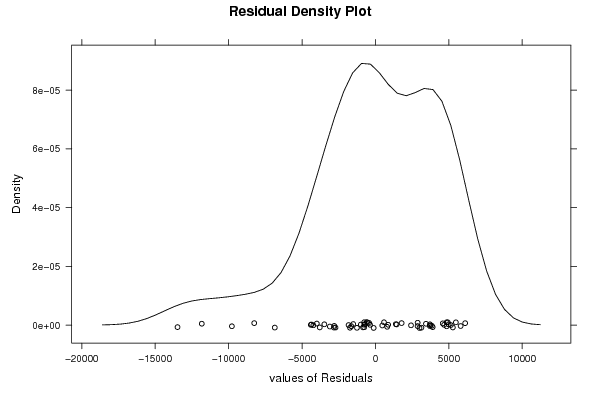
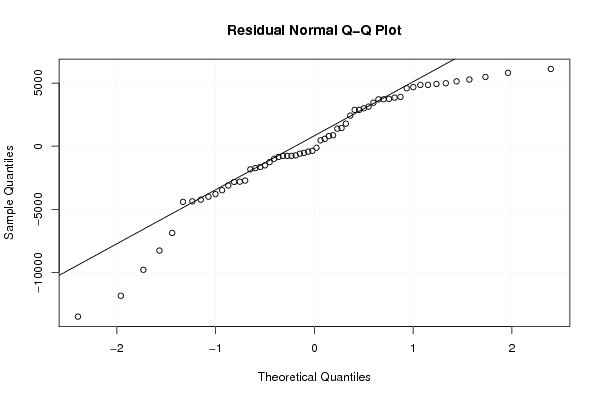
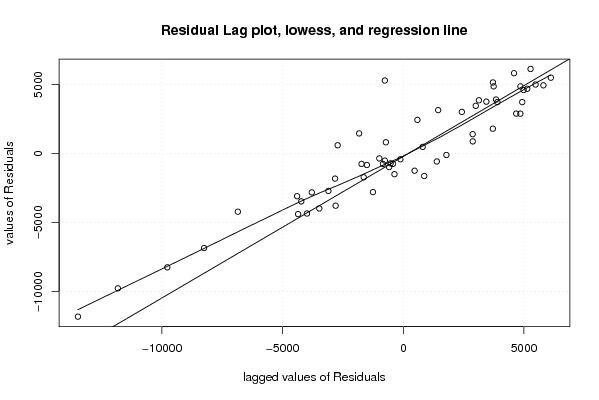
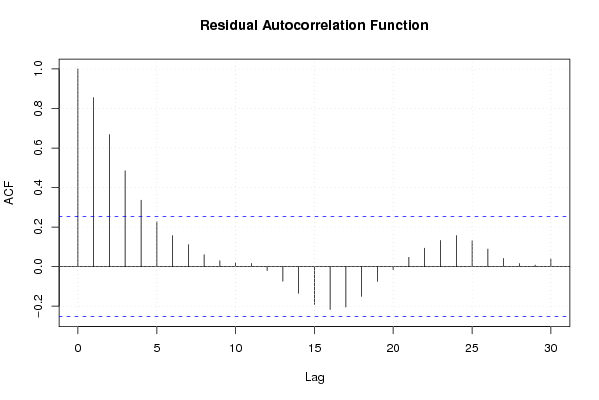
| Multiple Linear Regression - Residual Statistics | |
| Residual Standard Deviation | 4373.91726887107 |
| Sum Squared Residuals | 1109606831.94586 |
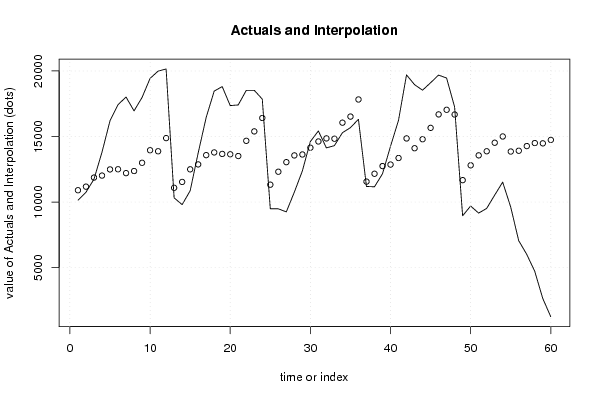
| Multiple Linear Regression - Actuals, Interpolation, and Residuals | |||
| Time or Index | Actuals | Interpolation Forecast | Residuals Prediction Error |
| 1 | 10144 | 10904.8734528531 | -760.873452853079 |
| 2 | 10751 | 11176.9788532197 | -425.978853219690 |
| 3 | 11752 | 11871.4145104054 | -119.414510405411 |
| 4 | 13808 | 12023.0565824847 | 1784.94341751526 |
| 5 | 16203 | 12492.1549549918 | 3710.84504500817 |
| 6 | 17432 | 12503.4926800071 | 4928.50731999289 |
| 7 | 18014 | 12208.7118296099 | 5805.28817039009 |
| 8 | 16956 | 12368.8571954507 | 4587.14280454931 |
| 9 | 17982 | 12996.6837181717 | 4985.31628182834 |
| 10 | 19435 | 13954.7214819626 | 5480.27851803742 |
| 11 | 19990 | 13876.7746224825 | 6113.22537751745 |
| 12 | 20154 | 14880.1632863346 | 5273.83671366543 |
| 13 | 10327 | 11090.5286999782 | -763.528699978201 |
| 14 | 9807 | 11536.9516224547 | -1729.95162245474 |
| 15 | 10862 | 12500.6582487533 | -1638.65824875329 |
| 16 | 13743 | 12874.8031742574 | 868.196825742565 |
| 17 | 16458 | 13580.5765564584 | 2877.42344354157 |
| 18 | 18466 | 13787.4900379872 | 4678.50996201276 |
| 19 | 18810 | 13674.1127878345 | 5135.88721216553 |
| 20 | 17361 | 13645.7684752963 | 3715.23152470372 |
| 21 | 17411 | 13512.5502063668 | 3898.44979363323 |
| 22 | 18517 | 14673.2498048058 | 3843.75019519424 |
| 23 | 18525 | 15391.7781276490 | 3133.22187235105 |
| 24 | 17859 | 16415.0078102777 | 1443.99218972229 |
| 25 | 9499 | 11327.2037096721 | -1828.20370967211 |
| 26 | 9490 | 12315.0030016281 | -2825.00300162813 |
| 27 | 9255 | 13044.8690494866 | -3789.86904948659 |
| 28 | 10758 | 13560.7355376817 | -2802.7355376817 |
| 29 | 12375 | 13631.5963190272 | -1256.59631902718 |
| 30 | 14617 | 14147.4628072223 | 469.537192777711 |
| 31 | 15427 | 14623.6472578639 | 803.352742136073 |
| 32 | 14136 | 14857.4878363040 | -721.487836304017 |
| 33 | 14308 | 14831.9779550196 | -523.977955019644 |
| 34 | 15293 | 16056.4522566696 | -763.45225666957 |
| 35 | 15679 | 16521.2989822959 | -842.298982295932 |
| 36 | 16319 | 17826.5545746797 | -1507.55457467971 |
| 37 | 11196 | 11561.0442881122 | -365.044288112201 |
| 38 | 11169 | 12161.9437139219 | -992.943713921887 |
| 39 | 12158 | 12745.8365522087 | -587.836552208658 |
| 40 | 14251 | 12862.0482336152 | 1388.95176638475 |
| 41 | 16237 | 13362.3253499144 | 2874.67465008565 |
| 42 | 19706 | 14854.6534050502 | 4851.3465949498 |
| 43 | 18960 | 14107.7807696688 | 4852.21923033118 |
| 44 | 18537 | 14793.7131330931 | 3743.28686690692 |
| 45 | 19103 | 15661.0490967618 | 3441.95090323822 |
| 46 | 19691 | 16688.5304262713 | 3002.46957372873 |
| 47 | 19464 | 17038.5826861179 | 2425.41731388205 |
| 48 | 17264 | 16678.6099168829 | 585.390083117098 |
| 49 | 8957 | 11674.4215382650 | -2717.42153826497 |
| 50 | 9703 | 12805.3596085389 | -3102.35960853886 |
| 51 | 9166 | 13564.9871845624 | -4398.98718456243 |
| 52 | 9519 | 13876.7746224825 | -4357.77462248255 |
| 53 | 10535 | 14525.8593796072 | -3990.85937960716 |
| 54 | 11526 | 15004.8782615026 | -3478.87826150262 |
| 55 | 9630 | 13856.9336037058 | -4226.93360370581 |
| 56 | 7061 | 13915.0394444091 | -6854.03944440911 |
| 57 | 6021 | 14273.5949980172 | -8252.59499801725 |
| 58 | 4728 | 14503.1839295766 | -9775.1839295766 |
| 59 | 2657 | 14481.9256951730 | -11824.9256951730 |
| 60 | 1264 | 14741.2761548974 | -13477.2761548974 |
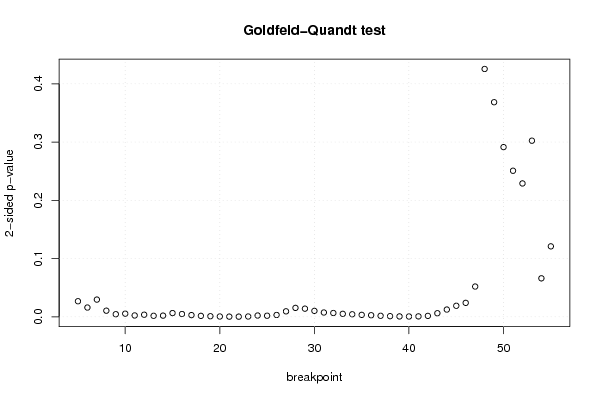
| Goldfeld-Quandt test for Heteroskedasticity | |||
| p-values | Alternative Hypothesis | ||
| breakpoint index | greater | 2-sided | less |
| 5 | 0.0134212683948824 | 0.0268425367897647 | 0.986578731605118 |
| 6 | 0.00799445963605446 | 0.0159889192721089 | 0.992005540363946 |
| 7 | 0.0148401486796582 | 0.0296802973593164 | 0.985159851320342 |
| 8 | 0.0052972107328393 | 0.0105944214656786 | 0.99470278926716 |
| 9 | 0.00229132179119115 | 0.00458264358238229 | 0.997708678208809 |
| 10 | 0.00273310757909739 | 0.00546621515819477 | 0.997266892420903 |
| 11 | 0.00121654530261787 | 0.00243309060523574 | 0.998783454697382 |
| 12 | 0.00185020893073329 | 0.00370041786146659 | 0.998149791069267 |
| 13 | 0.000916952578270615 | 0.00183390515654123 | 0.99908304742173 |
| 14 | 0.00107211844999425 | 0.00214423689998851 | 0.998927881550006 |
| 15 | 0.0032587687193253 | 0.0065175374386506 | 0.996741231280675 |
| 16 | 0.00244686840228203 | 0.00489373680456405 | 0.997553131597718 |
| 17 | 0.00150426268603524 | 0.00300852537207048 | 0.998495737313965 |
| 18 | 0.000853343539560415 | 0.00170668707912083 | 0.99914665646044 |
| 19 | 0.000542001408531942 | 0.00108400281706388 | 0.999457998591468 |
| 20 | 0.000319211419403156 | 0.000638422838806313 | 0.999680788580597 |
| 21 | 0.000189554002515980 | 0.000379108005031960 | 0.999810445997484 |
| 22 | 0.000182659897913647 | 0.000365319795827293 | 0.999817340102086 |
| 23 | 0.000309291833493604 | 0.000618583666987207 | 0.999690708166506 |
| 24 | 0.00115415411476263 | 0.00230830822952527 | 0.998845845885237 |
| 25 | 0.000975129616077955 | 0.00195025923215591 | 0.999024870383922 |
| 26 | 0.00162796921800542 | 0.00325593843601084 | 0.998372030781995 |
| 27 | 0.0047519978027026 | 0.0095039956054052 | 0.995248002197297 |
| 28 | 0.00770759356311508 | 0.0154151871262302 | 0.992292406436885 |
| 29 | 0.00704415327376774 | 0.0140883065475355 | 0.992955846726232 |
| 30 | 0.00515575861356541 | 0.0103115172271308 | 0.994844241386435 |
| 31 | 0.00374205336670692 | 0.00748410673341384 | 0.996257946633293 |
| 32 | 0.00331329305804467 | 0.00662658611608934 | 0.996686706941955 |
| 33 | 0.00259832868863594 | 0.00519665737727188 | 0.997401671311364 |
| 34 | 0.002215478083035 | 0.00443095616607 | 0.997784521916965 |
| 35 | 0.00172170441586316 | 0.00344340883172631 | 0.998278295584137 |
| 36 | 0.00139433103047864 | 0.00278866206095727 | 0.998605668969521 |
| 37 | 0.00091383782172331 | 0.00182767564344662 | 0.999086162178277 |
| 38 | 0.00060356772745295 | 0.0012071354549059 | 0.999396432272547 |
| 39 | 0.000387860250910582 | 0.000775720501821164 | 0.99961213974909 |
| 40 | 0.000321051035832586 | 0.000642102071665173 | 0.999678948964167 |
| 41 | 0.000426629484409001 | 0.000853258968818003 | 0.99957337051559 |
| 42 | 0.000835742354980828 | 0.00167148470996166 | 0.99916425764502 |
| 43 | 0.00312305514887167 | 0.00624611029774334 | 0.996876944851128 |
| 44 | 0.00627936628292355 | 0.0125587325658471 | 0.993720633717077 |
| 45 | 0.0095102325846023 | 0.0190204651692046 | 0.990489767415398 |
| 46 | 0.0120223062402335 | 0.024044612480467 | 0.987977693759767 |
| 47 | 0.0260269080720892 | 0.0520538161441785 | 0.973973091927911 |
| 48 | 0.212809332570543 | 0.425618665141087 | 0.787190667429457 |
| 49 | 0.184247439834151 | 0.368494879668301 | 0.81575256016585 |
| 50 | 0.145703791952100 | 0.291407583904199 | 0.8542962080479 |
| 51 | 0.125425768824986 | 0.250851537649972 | 0.874574231175014 |
| 52 | 0.114534302947803 | 0.229068605895607 | 0.885465697052197 |
| 53 | 0.151230300696335 | 0.302460601392671 | 0.848769699303665 |
| 54 | 0.966915485183038 | 0.0661690296339246 | 0.0330845148169623 |
| 55 | 0.939472335134497 | 0.121055329731006 | 0.0605276648655028 |
| Meta Analysis of Goldfeld-Quandt test for Heteroskedasticity | |||
| Description | # significant tests | % significant tests | OK/NOK |
| 1% type I error level | 32 | 0.627450980392157 | NOK |
| 5% type I error level | 42 | 0.823529411764706 | NOK |
| 10% type I error level | 44 | 0.862745098039216 | NOK |