| Multiple Linear Regression - Estimated Regression Equation |
| geb[t] = + 2.25568655873471 + 0.00518056008851177auto[t] + e[t] |
| Multiple Linear Regression - Ordinary Least Squares | |||||
| Variable | Parameter | S.D. | T-STAT H0: parameter = 0 | 2-tail p-value | 1-tail p-value |
| (Intercept) | 2.25568655873471 | 0.174453 | 12.93 | 0 | 0 |
| auto | 0.00518056008851177 | 0.007439 | 0.6964 | 0.48893 | 0.244465 |
| Multiple Linear Regression - Regression Statistics | |
| Multiple R | 0.090289779416755 |
| R-squared | 0.00815224426712628 |
| Adjusted R-squared | -0.00865873464360045 |
| F-TEST (value) | 0.484935726254735 |
| F-TEST (DF numerator) | 1 |
| F-TEST (DF denominator) | 59 |
| p-value | 0.488929557573516 |
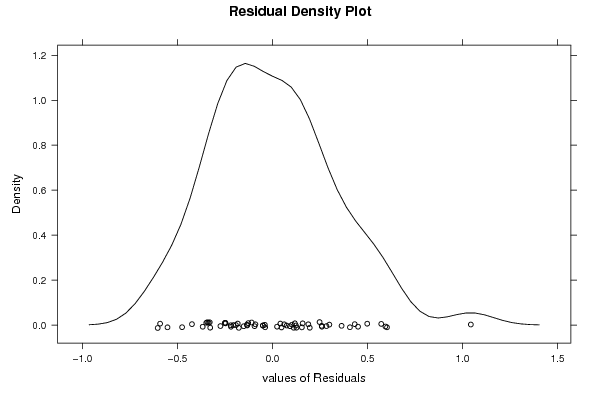
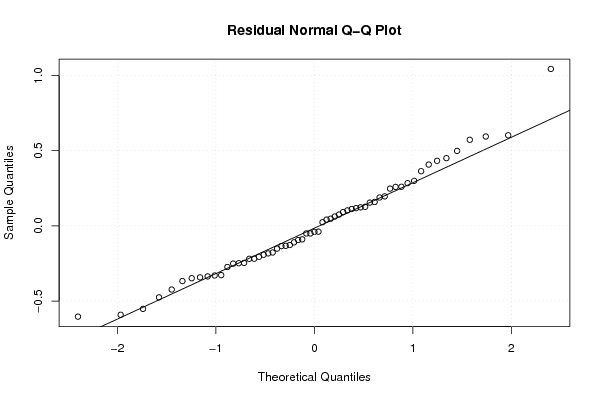
| Multiple Linear Regression - Residual Statistics | |
| Residual Standard Deviation | 0.329111628192011 |
| Sum Squared Residuals | 6.39055336486061 |
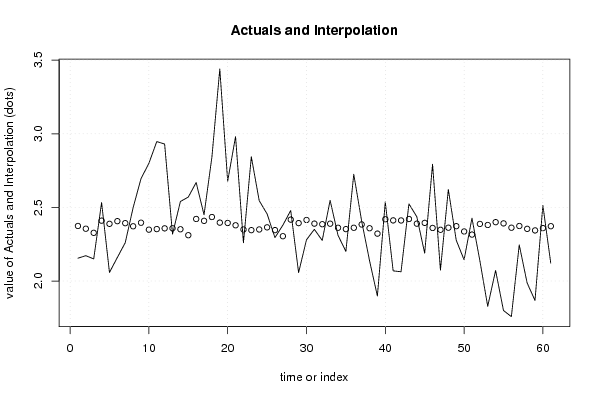
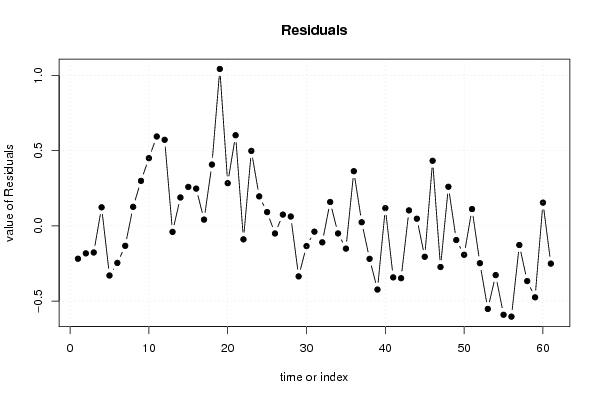
| Multiple Linear Regression - Actuals, Interpolation, and Residuals | |||
| Time or Index | Actuals | Interpolation Forecast | Residuals Prediction Error |
| 1 | 2.155 | 2.37371007867118 | -0.218710078671178 |
| 2 | 2.172 | 2.35499271507139 | -0.182992715071388 |
| 3 | 2.15 | 2.32721455187679 | -0.177214551876788 |
| 4 | 2.533 | 2.40977195744731 | 0.123228042552688 |
| 5 | 2.058 | 2.38826227195981 | -0.330262271959811 |
| 6 | 2.16 | 2.40642013507004 | -0.246420135070045 |
| 7 | 2.26 | 2.39287815099867 | -0.132878150998675 |
| 8 | 2.498 | 2.37175700751781 | 0.126242992482188 |
| 9 | 2.695 | 2.39578962576842 | 0.299210374231581 |
| 10 | 2.799 | 2.34878122352526 | 0.450218776474737 |
| 11 | 2.947 | 2.35271844919253 | 0.594281550807468 |
| 12 | 2.93 | 2.35766070351697 | 0.572339296483028 |
| 13 | 2.318 | 2.35818394008591 | -0.0401839400859115 |
| 14 | 2.54 | 2.35141812861032 | 0.188581871389685 |
| 15 | 2.57 | 2.31110819056161 | 0.258891809438395 |
| 16 | 2.669 | 2.42123653692319 | 0.247763463076812 |
| 17 | 2.45 | 2.40854416470633 | 0.0414558352936657 |
| 18 | 2.842 | 2.43444696514889 | 0.407553034851107 |
| 19 | 3.44 | 2.39641647353913 | 1.04358352646087 |
| 20 | 2.678 | 2.39419401326116 | 0.283805986738843 |
| 21 | 2.981 | 2.37841920779164 | 0.602580792208361 |
| 22 | 2.26 | 2.34974998826181 | -0.0897499882618146 |
| 23 | 2.844 | 2.34545530394844 | 0.498544696051562 |
| 24 | 2.546 | 2.34999865514606 | 0.196001344853937 |
| 25 | 2.456 | 2.36445241779301 | 0.0915475822069892 |
| 26 | 2.295 | 2.34573505419322 | -0.0507350541932179 |
| 27 | 2.379 | 2.30421286508380 | 0.074787134916204 |
| 28 | 2.479 | 2.41692631092955 | 0.0620736890704536 |
| 29 | 2.057 | 2.39323560964478 | -0.336235609644782 |
| 30 | 2.28 | 2.41447590600768 | -0.134475906007681 |
| 31 | 2.351 | 2.38965066206353 | -0.0386506620635321 |
| 32 | 2.276 | 2.38571861695635 | -0.109718616956352 |
| 33 | 2.548 | 2.38923103669636 | 0.158768963303637 |
| 34 | 2.311 | 2.36146323462194 | -0.0504632346219396 |
| 35 | 2.201 | 2.35250086566881 | -0.151500865668814 |
| 36 | 2.725 | 2.36149431798247 | 0.363505682017530 |
| 37 | 2.408 | 2.38404011548767 | 0.0239598845123261 |
| 38 | 2.139 | 2.35833417632848 | -0.219334176328479 |
| 39 | 1.898 | 2.32167653314217 | -0.423676533142169 |
| 40 | 2.537 | 2.41921611848867 | 0.117783881511331 |
| 41 | 2.069 | 2.41167840355988 | -0.342678403559884 |
| 42 | 2.063 | 2.41120179203174 | -0.348201792031741 |
| 43 | 2.524 | 2.42112256460124 | 0.102877435398759 |
| 44 | 2.437 | 2.38947970358061 | 0.0475202964193887 |
| 45 | 2.189 | 2.39470688870992 | -0.205706888709919 |
| 46 | 2.793 | 2.36035977532309 | 0.432640224676914 |
| 47 | 2.074 | 2.34784354214924 | -0.273843542149242 |
| 48 | 2.622 | 2.36199165175097 | 0.260008348249032 |
| 49 | 2.278 | 2.37234241080781 | -0.0943424108078142 |
| 50 | 2.144 | 2.33635824043301 | -0.192358240433011 |
| 51 | 2.427 | 2.31530962479339 | 0.111690375206612 |
| 52 | 2.139 | 2.38751627130707 | -0.248516271307065 |
| 53 | 1.828 | 2.38048625126695 | -0.552486251266955 |
| 54 | 2.072 | 2.39963360135409 | -0.327633601354094 |
| 55 | 1.8 | 2.39139133025327 | -0.591391330253272 |
| 56 | 1.758 | 2.36197092951061 | -0.603970929510614 |
| 57 | 2.246 | 2.37359092578915 | -0.127590925789146 |
| 58 | 1.987 | 2.35426225609891 | -0.367262256098908 |
| 59 | 1.868 | 2.34360584399684 | -0.475605843996839 |
| 60 | 2.514 | 2.35948426066813 | 0.154515739331872 |
| 61 | 2.121 | 2.37217145232489 | -0.251171452324893 |
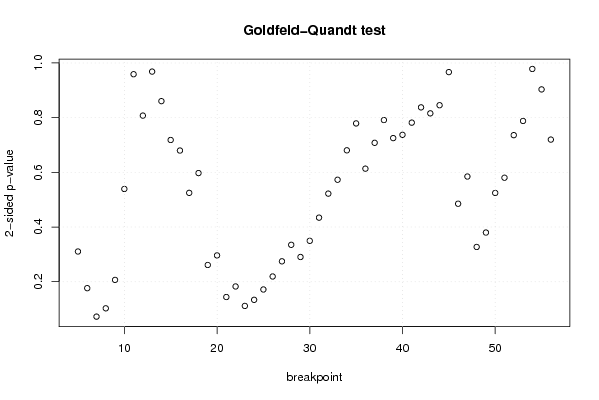
| Goldfeld-Quandt test for Heteroskedasticity | |||
| p-values | Alternative Hypothesis | ||
| breakpoint index | greater | 2-sided | less |
| 5 | 0.155272057440774 | 0.310544114881548 | 0.844727942559226 |
| 6 | 0.0882425640186288 | 0.176485128037258 | 0.911757435981371 |
| 7 | 0.0361526923853145 | 0.072305384770629 | 0.963847307614686 |
| 8 | 0.0514079343248494 | 0.102815868649699 | 0.94859206567515 |
| 9 | 0.103313030245672 | 0.206626060491344 | 0.896686969754328 |
| 10 | 0.269609857466106 | 0.539219714932213 | 0.730390142533894 |
| 11 | 0.479385324141844 | 0.958770648283689 | 0.520614675858156 |
| 12 | 0.596248125623177 | 0.807503748753645 | 0.403751874376823 |
| 13 | 0.515804755694768 | 0.968390488610463 | 0.484195244305232 |
| 14 | 0.430167851484381 | 0.860335702968762 | 0.569832148515619 |
| 15 | 0.359133086496969 | 0.718266172993938 | 0.640866913503031 |
| 16 | 0.339847538645462 | 0.679695077290923 | 0.660152461354538 |
| 17 | 0.262470725399036 | 0.524941450798073 | 0.737529274600964 |
| 18 | 0.298652280942175 | 0.597304561884349 | 0.701347719057825 |
| 19 | 0.869377958160475 | 0.261244083679049 | 0.130622041839525 |
| 20 | 0.851893053494913 | 0.296213893010174 | 0.148106946505087 |
| 21 | 0.927982312806564 | 0.144035374386873 | 0.0720176871934364 |
| 22 | 0.908639659958935 | 0.182720680082130 | 0.0913603400410648 |
| 23 | 0.944239401512995 | 0.111521196974011 | 0.0557605984870054 |
| 24 | 0.933074024593712 | 0.133851950812576 | 0.0669259754062878 |
| 25 | 0.91417011985187 | 0.171659760296259 | 0.0858298801481295 |
| 26 | 0.89041294864393 | 0.219174102712138 | 0.109587051356069 |
| 27 | 0.862672533278229 | 0.274654933443542 | 0.137327466721771 |
| 28 | 0.832517407688786 | 0.334965184622429 | 0.167482592311214 |
| 29 | 0.854789965335394 | 0.290420069329212 | 0.145210034664606 |
| 30 | 0.825216861304845 | 0.349566277390311 | 0.174783138695155 |
| 31 | 0.782870246059426 | 0.434259507881148 | 0.217129753940574 |
| 32 | 0.738920390299766 | 0.522159219400468 | 0.261079609700234 |
| 33 | 0.713546352701121 | 0.572907294597758 | 0.286453647298879 |
| 34 | 0.659736149542526 | 0.680527700914949 | 0.340263850457474 |
| 35 | 0.610562100139168 | 0.778875799721665 | 0.389437899860832 |
| 36 | 0.693269289816343 | 0.613461420367314 | 0.306730710183657 |
| 37 | 0.646042122097132 | 0.707915755805736 | 0.353957877902868 |
| 38 | 0.604407731024801 | 0.791184537950398 | 0.395592268975199 |
| 39 | 0.637390586662685 | 0.725218826674631 | 0.362609413337315 |
| 40 | 0.631392945251274 | 0.737214109497451 | 0.368607054748726 |
| 41 | 0.609161907496162 | 0.781676185007677 | 0.390838092503838 |
| 42 | 0.581210800271958 | 0.837578399456085 | 0.418789199728042 |
| 43 | 0.592137786117669 | 0.815724427764661 | 0.407862213882331 |
| 44 | 0.577298507078165 | 0.84540298584367 | 0.422701492921835 |
| 45 | 0.516712025041128 | 0.966575949917744 | 0.483287974958872 |
| 46 | 0.757418700150713 | 0.485162599698574 | 0.242581299849287 |
| 47 | 0.707647443068747 | 0.584705113862506 | 0.292352556931253 |
| 48 | 0.836404515097618 | 0.327190969804764 | 0.163595484902382 |
| 49 | 0.81008784232423 | 0.379824315351539 | 0.189912157675770 |
| 50 | 0.737687842590025 | 0.524624314819951 | 0.262312157409975 |
| 51 | 0.709836071608148 | 0.580327856783704 | 0.290163928391852 |
| 52 | 0.632009155522194 | 0.735981688955611 | 0.367990844477806 |
| 53 | 0.606073591614996 | 0.787852816770007 | 0.393926408385004 |
| 54 | 0.489025237064886 | 0.978050474129772 | 0.510974762935114 |
| 55 | 0.5483606679293 | 0.9032786641414 | 0.4516393320707 |
| 56 | 0.640130774576604 | 0.719738450846792 | 0.359869225423396 |
| Meta Analysis of Goldfeld-Quandt test for Heteroskedasticity | |||
| Description | # significant tests | % significant tests | OK/NOK |
| 1% type I error level | 0 | 0 | OK |
| 5% type I error level | 0 | 0 | OK |
| 10% type I error level | 1 | 0.0192307692307692 | OK |