| Multiple Linear Regression - Estimated Regression Equation |
| Y[t] = + 51.8113889492929 + 18.2085406063896X[t] + 0.271210793016475Y1[t] + 0.178741922485548Y2[t] + 2.56273080422700M1[t] + 5.67578036676462M2[t] -13.7940300961573M3[t] + 4.70725653390193M4[t] -1.077914935995M5[t] -1.85769590905666M6[t] + 12.8906641756498M7[t] -4.24578668033340M8[t] + 2.00799178358461M9[t] + 10.0895616108159M10[t] -12.0140621863243M11[t] -0.123585395824864t + e[t] |
| Multiple Linear Regression - Ordinary Least Squares | |||||
| Variable | Parameter | S.D. | T-STAT H0: parameter = 0 | 2-tail p-value | 1-tail p-value |
| (Intercept) | 51.8113889492929 | 20.163007 | 2.5696 | 0.01382 | 0.00691 |
| X | 18.2085406063896 | 5.138222 | 3.5437 | 0.000983 | 0.000491 |
| Y1 | 0.271210793016475 | 0.128645 | 2.1082 | 0.041019 | 0.02051 |
| Y2 | 0.178741922485548 | 0.127557 | 1.4013 | 0.168479 | 0.084239 |
| M1 | 2.56273080422700 | 8.423075 | 0.3043 | 0.762439 | 0.381219 |
| M2 | 5.67578036676462 | 8.347617 | 0.6799 | 0.500281 | 0.25014 |
| M3 | -13.7940300961573 | 8.455493 | -1.6314 | 0.110289 | 0.055145 |
| M4 | 4.70725653390193 | 7.633775 | 0.6166 | 0.540803 | 0.270402 |
| M5 | -1.077914935995 | 8.610897 | -0.1252 | 0.900978 | 0.450489 |
| M6 | -1.85769590905666 | 7.854358 | -0.2365 | 0.814181 | 0.40709 |
| M7 | 12.8906641756498 | 8.079168 | 1.5955 | 0.118089 | 0.059044 |
| M8 | -4.24578668033340 | 8.741576 | -0.4857 | 0.629704 | 0.314852 |
| M9 | 2.00799178358461 | 7.717854 | 0.2602 | 0.796 | 0.398 |
| M10 | 10.0895616108159 | 8.25559 | 1.2221 | 0.228466 | 0.114233 |
| M11 | -12.0140621863243 | 8.902205 | -1.3496 | 0.184387 | 0.092193 |
| t | -0.123585395824864 | 0.113949 | -1.0846 | 0.284301 | 0.142151 |
| Multiple Linear Regression - Regression Statistics | |
| Multiple R | 0.795209101442698 |
| R-squared | 0.632357515017304 |
| Adjusted R-squared | 0.501056627523484 |
| F-TEST (value) | 4.81609475067004 |
| F-TEST (DF numerator) | 15 |
| F-TEST (DF denominator) | 42 |
| p-value | 2.73510789530196e-05 |
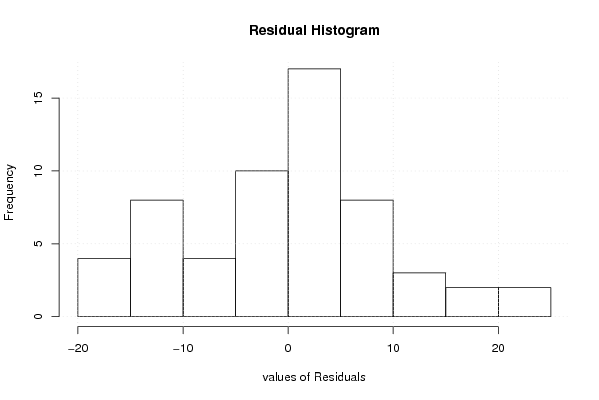
| Multiple Linear Regression - Residual Statistics | |
| Residual Standard Deviation | 11.1876886667339 |
| Sum Squared Residuals | 5256.90386355821 |
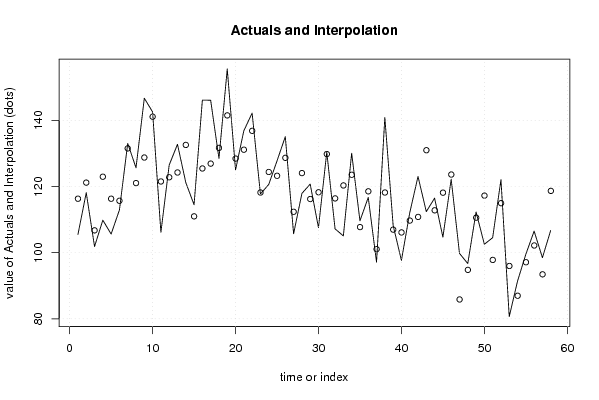
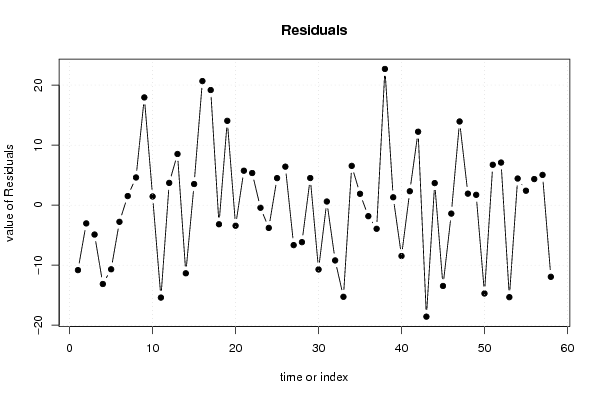
| Multiple Linear Regression - Actuals, Interpolation, and Residuals | |||
| Time or Index | Actuals | Interpolation Forecast | Residuals Prediction Error |
| 1 | 105.5073942 | 116.327182839840 | -10.8197886398403 |
| 2 | 118.1540031 | 121.194616342282 | -3.04061324228207 |
| 3 | 101.8612953 | 106.758378626621 | -4.89708332662111 |
| 4 | 109.8419174 | 122.977800845741 | -13.1358834457407 |
| 5 | 105.6348802 | 116.321284913857 | -10.6864047138574 |
| 6 | 112.927078 | 115.703396386494 | -2.77631838649371 |
| 7 | 133.0698623 | 131.55391990645 | 1.51594239354994 |
| 8 | 125.6756757 | 121.060245612122 | 4.61543008787832 |
| 9 | 146.736359 | 128.785415458711 | 17.9509435412892 |
| 10 | 142.5803162 | 141.133633381278 | 1.4466828187219 |
| 11 | 106.1448241 | 121.543687546616 | -15.3988634466159 |
| 12 | 126.5170831 | 122.809606550725 | 3.70747654927534 |
| 13 | 132.7893932 | 124.261378573393 | 8.5280146266072 |
| 14 | 121.2391637 | 132.593337675405 | -11.3541739754053 |
| 15 | 114.5079041 | 110.988519680141 | 3.51938441985927 |
| 16 | 146.1499235 | 125.47612043428 | 20.6738030657199 |
| 17 | 146.1244263 | 126.945862461022 | 19.1785638389783 |
| 18 | 128.5058644 | 131.691336355184 | -3.18547195518444 |
| 19 | 155.5838858 | 141.533209480811 | 14.0506763191888 |
| 20 | 125.0382458 | 128.467849260778 | -3.42960346077757 |
| 21 | 136.8944416 | 131.153712683416 | 5.74072891658421 |
| 22 | 142.2233554 | 136.867438962747 | 5.35591643725269 |
| 23 | 117.7715451 | 118.204687938054 | -0.433142838053818 |
| 24 | 120.627231 | 124.416070163774 | -3.78883916377362 |
| 25 | 127.7664457 | 123.259144828447 | 4.50730087155322 |
| 26 | 135.1096379 | 128.695271863242 | 6.41436603675772 |
| 27 | 105.7113717 | 112.369505944845 | -6.65813424484494 |
| 28 | 117.9245283 | 124.086616380677 | -6.1620880806768 |
| 29 | 120.754717 | 116.235496783345 | 4.5192202166545 |
| 30 | 107.572667 | 118.282711226473 | -10.7100442264733 |
| 31 | 130.4436512 | 129.838245050507 | 0.605406149493046 |
| 32 | 107.2157063 | 116.424881601348 | -9.20917530134752 |
| 33 | 105.0739419 | 120.343408998013 | -15.2694670980133 |
| 34 | 130.1121877 | 123.568716281227 | 6.54347141877314 |
| 35 | 109.6379398 | 107.749326501054 | 1.88861329894587 |
| 36 | 116.7261601 | 118.562350472136 | -1.83619037213637 |
| 37 | 97.11881693 | 101.055750691696 | -3.93693376169571 |
| 38 | 140.8975013 | 118.202994498139 | 22.6945068018607 |
| 39 | 108.2865885 | 106.978196131558 | 1.30839236844158 |
| 40 | 97.65425803 | 106.128011446106 | -8.47375341610594 |
| 41 | 112.0346762 | 109.715255160511 | 2.31942103948877 |
| 42 | 123.0494646 | 110.811570218709 | 12.2378943812905 |
| 43 | 112.4171341 | 130.994057994316 | -18.5769238943156 |
| 44 | 116.4966854 | 112.819223410377 | 3.67746198962318 |
| 45 | 104.6914839 | 118.155391627623 | -13.4639077276226 |
| 46 | 122.2335543 | 123.640864840735 | -1.40731054073518 |
| 47 | 99.79602244 | 85.8526294542761 | 13.9433929857239 |
| 48 | 96.71086181 | 94.7933088233654 | 1.91755298663464 |
| 49 | 112.3151453 | 110.593738396624 | 1.72140690337555 |
| 50 | 102.5497195 | 117.263805120931 | -14.7140856209310 |
| 51 | 104.5385008 | 97.8110600168348 | 6.7274407831652 |
| 52 | 122.0805711 | 114.982649223197 | 7.09792187680345 |
| 53 | 80.64762876 | 95.9784291412642 | -15.3308003812642 |
| 54 | 91.40744518 | 86.973504993139 | 4.43394018686092 |
| 55 | 99.51555329 | 97.110654257916 | 2.40489903208389 |
| 56 | 106.527282 | 102.181395315376 | 4.34588668462361 |
| 57 | 98.49566548 | 93.4539631122375 | 5.0417023677625 |
| 58 | 106.7567568 | 118.695516934013 | -11.9387601340126 |
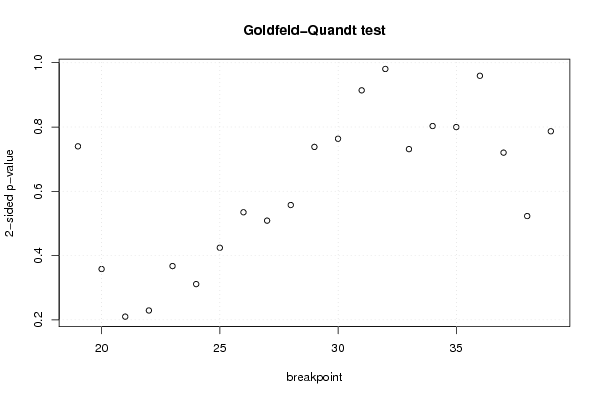
| Goldfeld-Quandt test for Heteroskedasticity | |||
| p-values | Alternative Hypothesis | ||
| breakpoint index | greater | 2-sided | less |
| 19 | 0.630020210057301 | 0.739959579885398 | 0.369979789942699 |
| 20 | 0.82092496406138 | 0.358150071877241 | 0.179075035938621 |
| 21 | 0.89498690218012 | 0.210026195639759 | 0.105013097819880 |
| 22 | 0.885389154014937 | 0.229221691970126 | 0.114610845985063 |
| 23 | 0.816287903987791 | 0.367424192024418 | 0.183712096012209 |
| 24 | 0.844328517188251 | 0.311342965623498 | 0.155671482811749 |
| 25 | 0.787820017091317 | 0.424359965817366 | 0.212179982908683 |
| 26 | 0.732594353564806 | 0.534811292870388 | 0.267405646435194 |
| 27 | 0.745628920767198 | 0.508742158465604 | 0.254371079232802 |
| 28 | 0.721363353248639 | 0.557273293502722 | 0.278636646751361 |
| 29 | 0.630955851103879 | 0.738088297792242 | 0.369044148896121 |
| 30 | 0.618269315211205 | 0.76346136957759 | 0.381730684788795 |
| 31 | 0.542937773523549 | 0.914124452952902 | 0.457062226476451 |
| 32 | 0.509674284004705 | 0.98065143199059 | 0.490325715995295 |
| 33 | 0.634379953341872 | 0.731240093316255 | 0.365620046658128 |
| 34 | 0.598490066303061 | 0.803019867393877 | 0.401509933696939 |
| 35 | 0.600113327514185 | 0.79977334497163 | 0.399886672485815 |
| 36 | 0.479699937170052 | 0.959399874340103 | 0.520300062829948 |
| 37 | 0.360128060257287 | 0.720256120514575 | 0.639871939742713 |
| 38 | 0.738502665268615 | 0.522994669462771 | 0.261497334731385 |
| 39 | 0.606595952862864 | 0.786808094274271 | 0.393404047137136 |
| Meta Analysis of Goldfeld-Quandt test for Heteroskedasticity | |||
| Description | # significant tests | % significant tests | OK/NOK |
| 1% type I error level | 0 | 0 | OK |
| 5% type I error level | 0 | 0 | OK |
| 10% type I error level | 0 | 0 | OK |