Free Statistics

of Irreproducible Research!

Author's title

Author*The author of this computation has been verified*
R Software Modulerwasp_multipleregression.wasp
Title produced by softwareMultiple Regression
Date of computationFri, 20 Nov 2009 05:42:41 -0700
Cite this page as followsStatistical Computations at FreeStatistics.org, Office for Research Development and Education, URL https://freestatistics.org/blog/index.php?v=date/2009/Nov/20/t12587210243tp87m4mks3l2aj.htm/, Retrieved Fri, 19 Apr 2024 04:39:45 +0000
Statistical Computations at FreeStatistics.org, Office for Research Development and Education, URL https://freestatistics.org/blog/index.php?pk=58090, Retrieved Fri, 19 Apr 2024 04:39:45 +0000
QR Codes:

Original text written by user:
IsPrivate?No (this computation is public)
User-defined keywords
Estimated Impact122
Family? (F = Feedback message, R = changed R code, M = changed R Module, P = changed Parameters, D = changed Data)
-     [Multiple Regression] [Q1 The Seatbeltlaw] [2007-11-14 19:27:43] [8cd6641b921d30ebe00b648d1481bba0]
- RM D  [Multiple Regression] [Seatbelt] [2009-11-12 14:14:11] [b98453cac15ba1066b407e146608df68]
F    D      [Multiple Regression] [ws7777777] [2009-11-20 12:42:41] [9a1fef436e1d399a5ecd6808bfbd8489] [Current]
Feedback Forum
2009-11-26 09:48:01 [Angelo Stuer] [reply
conclusie:
in je samenvatting kan je zien dat door de trend te verwijderen en je Y(t) reeks 4 periodes te vertragen, je door dit model (model 4) 54% van de steekproeven kan verklaren met een zekerheid van 95% (vertrouweninterval).
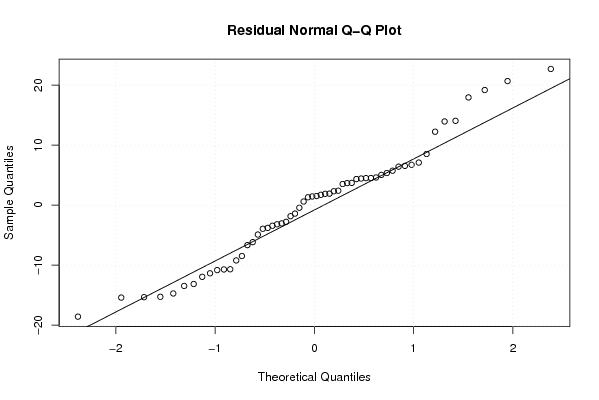
Het model is volgens mij toch nog steeds niet goed, aangezien er toch nog een aanzienlijke residu aanwezig is, namelijk 10,78. indien je een goed model had, zou dit heel dicht bij nul moeten liggen. Het 5de model lijkt mij overbodig, aangezien de cijfers slechter zijn dan je vierde model.

Post a new message
Dataseries X:
105,5073942	1	95,84395716	100
118,1540031	1	105,5073942	95,84395716
101,8612953	1	118,1540031	105,5073942
109,8419174	1	101,8612953	118,1540031
105,6348802	1	109,8419174	101,8612953
112,927078	1	105,6348802	109,8419174
133,0698623	1	112,927078	105,6348802
125,6756757	1	133,0698623	112,927078
146,736359	1	125,6756757	133,0698623
142,5803162	1	146,736359	125,6756757
106,1448241	1	142,5803162	146,736359
126,5170831	1	106,1448241	142,5803162
132,7893932	1	126,5170831	106,1448241
121,2391637	1	132,7893932	126,5170831
114,5079041	1	121,2391637	132,7893932
146,1499235	1	114,5079041	121,2391637
146,1244263	1	146,1499235	114,5079041
128,5058644	1	146,1244263	146,1499235
155,5838858	1	128,5058644	146,1244263
125,0382458	1	155,5838858	128,5058644
136,8944416	1	125,0382458	155,5838858
142,2233554	1	136,8944416	125,0382458
117,7715451	1	142,2233554	136,8944416
120,627231	1	117,7715451	142,2233554
127,7664457	1	120,627231	117,7715451
135,1096379	1	127,7664457	120,627231
105,7113717	1	135,1096379	127,7664457
117,9245283	1	105,7113717	135,1096379
120,754717	1	117,9245283	105,7113717
107,572667	1	120,754717	117,9245283
130,4436512	1	107,572667	120,754717
107,2157063	1	130,4436512	107,572667
105,0739419	1	107,2157063	130,4436512
130,1121877	1	105,0739419	107,2157063
109,6379398	1	130,1121877	105,0739419
116,7261601	1	109,6379398	130,1121877
97,11881693	0	116,7261601	109,6379398
140,8975013	1	97,11881693	116,7261601
108,2865885	1	140,8975013	97,11881693
97,65425803	0	108,2865885	140,8975013
112,0346762	1	97,65425803	108,2865885
123,0494646	1	112,0346762	97,65425803
112,4171341	1	123,0494646	112,0346762
116,4966854	1	112,4171341	123,0494646
104,6914839	1	116,4966854	112,4171341
122,2335543	1	104,6914839	116,4966854
99,79602244	0	122,2335543	104,6914839
96,71086181	0	99,79602244	122,2335543
112,3151453	1	96,71086181	99,79602244
102,5497195	1	112,3151453	96,71086181
104,5385008	1	102,5497195	112,3151453
122,0805711	1	104,5385008	102,5497195
80,64762876	0	122,0805711	104,5385008
91,40744518	0	80,64762876	122,0805711
99,51555329	0	91,40744518	80,64762876
106,527282	1	99,51555329	91,40744518
98,49566548	0	106,527282	99,51555329
106,7567568	1	98,49566548	106,527282


Summary of computational transaction
Raw Inputview raw input (R code)
Raw Outputview raw output of R engine
Computing time4 seconds
R Server'Gwilym Jenkins' @ 72.249.127.135

\begin{tabular}{lllllllll}
\hline
Summary of computational transaction \tabularnewline
Raw Input & view raw input (R code)  \tabularnewline
Raw Output & view raw output of R engine  \tabularnewline
Computing time & 4 seconds \tabularnewline
R Server & 'Gwilym Jenkins' @ 72.249.127.135 \tabularnewline
\hline
\end{tabular}
%Source: https://freestatistics.org/blog/index.php?pk=58090&T=0

[TABLE]
[ROW][C]Summary of computational transaction[/C][/ROW]
[ROW][C]Raw Input[/C][C]view raw input (R code) [/C][/ROW]
[ROW][C]Raw Output[/C][C]view raw output of R engine [/C][/ROW]
[ROW][C]Computing time[/C][C]4 seconds[/C][/ROW]
[ROW][C]R Server[/C][C]'Gwilym Jenkins' @ 72.249.127.135[/C][/ROW]
[/TABLE]
Source: https://freestatistics.org/blog/index.php?pk=58090&T=0

Globally Unique Identifier (entire table): ba.freestatistics.org/blog/index.php?pk=58090&T=0

As an alternative you can also use a QR Code:  

The GUIDs for individual cells are displayed in the table below:

Summary of computational transaction
Raw Inputview raw input (R code)
Raw Outputview raw output of R engine
Computing time4 seconds
R Server'Gwilym Jenkins' @ 72.249.127.135


Multiple Linear Regression - Estimated Regression Equation
Y[t] = + 51.8113889492929 + 18.2085406063896X[t] + 0.271210793016475Y1[t] + 0.178741922485548Y2[t] + 2.56273080422700M1[t] + 5.67578036676462M2[t] -13.7940300961573M3[t] + 4.70725653390193M4[t] -1.077914935995M5[t] -1.85769590905666M6[t] + 12.8906641756498M7[t] -4.24578668033340M8[t] + 2.00799178358461M9[t] + 10.0895616108159M10[t] -12.0140621863243M11[t] -0.123585395824864t + e[t]

\begin{tabular}{lllllllll}
\hline
Multiple Linear Regression - Estimated Regression Equation \tabularnewline
Y[t] =  +  51.8113889492929 +  18.2085406063896X[t] +  0.271210793016475Y1[t] +  0.178741922485548Y2[t] +  2.56273080422700M1[t] +  5.67578036676462M2[t] -13.7940300961573M3[t] +  4.70725653390193M4[t] -1.077914935995M5[t] -1.85769590905666M6[t] +  12.8906641756498M7[t] -4.24578668033340M8[t] +  2.00799178358461M9[t] +  10.0895616108159M10[t] -12.0140621863243M11[t] -0.123585395824864t  + e[t] \tabularnewline
\hline
\end{tabular}
%Source: https://freestatistics.org/blog/index.php?pk=58090&T=1

[TABLE]
[ROW][C]Multiple Linear Regression - Estimated Regression Equation[/C][/ROW]
[ROW][C]Y[t] =  +  51.8113889492929 +  18.2085406063896X[t] +  0.271210793016475Y1[t] +  0.178741922485548Y2[t] +  2.56273080422700M1[t] +  5.67578036676462M2[t] -13.7940300961573M3[t] +  4.70725653390193M4[t] -1.077914935995M5[t] -1.85769590905666M6[t] +  12.8906641756498M7[t] -4.24578668033340M8[t] +  2.00799178358461M9[t] +  10.0895616108159M10[t] -12.0140621863243M11[t] -0.123585395824864t  + e[t][/C][/ROW]
[/TABLE]
Source: https://freestatistics.org/blog/index.php?pk=58090&T=1

Globally Unique Identifier (entire table): ba.freestatistics.org/blog/index.php?pk=58090&T=1

As an alternative you can also use a QR Code:  

The GUIDs for individual cells are displayed in the table below:

Multiple Linear Regression - Estimated Regression Equation
Y[t] = + 51.8113889492929 + 18.2085406063896X[t] + 0.271210793016475Y1[t] + 0.178741922485548Y2[t] + 2.56273080422700M1[t] + 5.67578036676462M2[t] -13.7940300961573M3[t] + 4.70725653390193M4[t] -1.077914935995M5[t] -1.85769590905666M6[t] + 12.8906641756498M7[t] -4.24578668033340M8[t] + 2.00799178358461M9[t] + 10.0895616108159M10[t] -12.0140621863243M11[t] -0.123585395824864t + e[t]


Multiple Linear Regression - Ordinary Least Squares
VariableParameterS.D.T-STATH0: parameter = 02-tail p-value1-tail p-value
(Intercept)51.811388949292920.1630072.56960.013820.00691
X18.20854060638965.1382223.54370.0009830.000491
Y10.2712107930164750.1286452.10820.0410190.02051
Y20.1787419224855480.1275571.40130.1684790.084239
M12.562730804227008.4230750.30430.7624390.381219
M25.675780366764628.3476170.67990.5002810.25014
M3-13.79403009615738.455493-1.63140.1102890.055145
M44.707256533901937.6337750.61660.5408030.270402
M5-1.0779149359958.610897-0.12520.9009780.450489
M6-1.857695909056667.854358-0.23650.8141810.40709
M712.89066417564988.0791681.59550.1180890.059044
M8-4.245786680333408.741576-0.48570.6297040.314852
M92.007991783584617.7178540.26020.7960.398
M1010.08956161081598.255591.22210.2284660.114233
M11-12.01406218632438.902205-1.34960.1843870.092193
t-0.1235853958248640.113949-1.08460.2843010.142151

\begin{tabular}{lllllllll}
\hline
Multiple Linear Regression - Ordinary Least Squares \tabularnewline
Variable & Parameter & S.D. & T-STATH0: parameter = 0 & 2-tail p-value & 1-tail p-value \tabularnewline
(Intercept) & 51.8113889492929 & 20.163007 & 2.5696 & 0.01382 & 0.00691 \tabularnewline
X & 18.2085406063896 & 5.138222 & 3.5437 & 0.000983 & 0.000491 \tabularnewline
Y1 & 0.271210793016475 & 0.128645 & 2.1082 & 0.041019 & 0.02051 \tabularnewline
Y2 & 0.178741922485548 & 0.127557 & 1.4013 & 0.168479 & 0.084239 \tabularnewline
M1 & 2.56273080422700 & 8.423075 & 0.3043 & 0.762439 & 0.381219 \tabularnewline
M2 & 5.67578036676462 & 8.347617 & 0.6799 & 0.500281 & 0.25014 \tabularnewline
M3 & -13.7940300961573 & 8.455493 & -1.6314 & 0.110289 & 0.055145 \tabularnewline
M4 & 4.70725653390193 & 7.633775 & 0.6166 & 0.540803 & 0.270402 \tabularnewline
M5 & -1.077914935995 & 8.610897 & -0.1252 & 0.900978 & 0.450489 \tabularnewline
M6 & -1.85769590905666 & 7.854358 & -0.2365 & 0.814181 & 0.40709 \tabularnewline
M7 & 12.8906641756498 & 8.079168 & 1.5955 & 0.118089 & 0.059044 \tabularnewline
M8 & -4.24578668033340 & 8.741576 & -0.4857 & 0.629704 & 0.314852 \tabularnewline
M9 & 2.00799178358461 & 7.717854 & 0.2602 & 0.796 & 0.398 \tabularnewline
M10 & 10.0895616108159 & 8.25559 & 1.2221 & 0.228466 & 0.114233 \tabularnewline
M11 & -12.0140621863243 & 8.902205 & -1.3496 & 0.184387 & 0.092193 \tabularnewline
t & -0.123585395824864 & 0.113949 & -1.0846 & 0.284301 & 0.142151 \tabularnewline
\hline
\end{tabular}
%Source: https://freestatistics.org/blog/index.php?pk=58090&T=2

[TABLE]
[ROW][C]Multiple Linear Regression - Ordinary Least Squares[/C][/ROW]
[ROW][C]Variable[/C][C]Parameter[/C][C]S.D.[/C][C]T-STATH0: parameter = 0[/C][C]2-tail p-value[/C][C]1-tail p-value[/C][/ROW]
[ROW][C](Intercept)[/C][C]51.8113889492929[/C][C]20.163007[/C][C]2.5696[/C][C]0.01382[/C][C]0.00691[/C][/ROW]
[ROW][C]X[/C][C]18.2085406063896[/C][C]5.138222[/C][C]3.5437[/C][C]0.000983[/C][C]0.000491[/C][/ROW]
[ROW][C]Y1[/C][C]0.271210793016475[/C][C]0.128645[/C][C]2.1082[/C][C]0.041019[/C][C]0.02051[/C][/ROW]
[ROW][C]Y2[/C][C]0.178741922485548[/C][C]0.127557[/C][C]1.4013[/C][C]0.168479[/C][C]0.084239[/C][/ROW]
[ROW][C]M1[/C][C]2.56273080422700[/C][C]8.423075[/C][C]0.3043[/C][C]0.762439[/C][C]0.381219[/C][/ROW]
[ROW][C]M2[/C][C]5.67578036676462[/C][C]8.347617[/C][C]0.6799[/C][C]0.500281[/C][C]0.25014[/C][/ROW]
[ROW][C]M3[/C][C]-13.7940300961573[/C][C]8.455493[/C][C]-1.6314[/C][C]0.110289[/C][C]0.055145[/C][/ROW]
[ROW][C]M4[/C][C]4.70725653390193[/C][C]7.633775[/C][C]0.6166[/C][C]0.540803[/C][C]0.270402[/C][/ROW]
[ROW][C]M5[/C][C]-1.077914935995[/C][C]8.610897[/C][C]-0.1252[/C][C]0.900978[/C][C]0.450489[/C][/ROW]
[ROW][C]M6[/C][C]-1.85769590905666[/C][C]7.854358[/C][C]-0.2365[/C][C]0.814181[/C][C]0.40709[/C][/ROW]
[ROW][C]M7[/C][C]12.8906641756498[/C][C]8.079168[/C][C]1.5955[/C][C]0.118089[/C][C]0.059044[/C][/ROW]
[ROW][C]M8[/C][C]-4.24578668033340[/C][C]8.741576[/C][C]-0.4857[/C][C]0.629704[/C][C]0.314852[/C][/ROW]
[ROW][C]M9[/C][C]2.00799178358461[/C][C]7.717854[/C][C]0.2602[/C][C]0.796[/C][C]0.398[/C][/ROW]
[ROW][C]M10[/C][C]10.0895616108159[/C][C]8.25559[/C][C]1.2221[/C][C]0.228466[/C][C]0.114233[/C][/ROW]
[ROW][C]M11[/C][C]-12.0140621863243[/C][C]8.902205[/C][C]-1.3496[/C][C]0.184387[/C][C]0.092193[/C][/ROW]
[ROW][C]t[/C][C]-0.123585395824864[/C][C]0.113949[/C][C]-1.0846[/C][C]0.284301[/C][C]0.142151[/C][/ROW]
[/TABLE]
Source: https://freestatistics.org/blog/index.php?pk=58090&T=2

Globally Unique Identifier (entire table): ba.freestatistics.org/blog/index.php?pk=58090&T=2

As an alternative you can also use a QR Code:  

The GUIDs for individual cells are displayed in the table below:

Multiple Linear Regression - Ordinary Least Squares
VariableParameterS.D.T-STATH0: parameter = 02-tail p-value1-tail p-value
(Intercept)51.811388949292920.1630072.56960.013820.00691
X18.20854060638965.1382223.54370.0009830.000491
Y10.2712107930164750.1286452.10820.0410190.02051
Y20.1787419224855480.1275571.40130.1684790.084239
M12.562730804227008.4230750.30430.7624390.381219
M25.675780366764628.3476170.67990.5002810.25014
M3-13.79403009615738.455493-1.63140.1102890.055145
M44.707256533901937.6337750.61660.5408030.270402
M5-1.0779149359958.610897-0.12520.9009780.450489
M6-1.857695909056667.854358-0.23650.8141810.40709
M712.89066417564988.0791681.59550.1180890.059044
M8-4.245786680333408.741576-0.48570.6297040.314852
M92.007991783584617.7178540.26020.7960.398
M1010.08956161081598.255591.22210.2284660.114233
M11-12.01406218632438.902205-1.34960.1843870.092193
t-0.1235853958248640.113949-1.08460.2843010.142151


Multiple Linear Regression - Regression Statistics
Multiple R0.795209101442698
R-squared0.632357515017304
Adjusted R-squared0.501056627523484
F-TEST (value)4.81609475067004
F-TEST (DF numerator)15
F-TEST (DF denominator)42
p-value2.73510789530196e-05
Multiple Linear Regression - Residual Statistics
Residual Standard Deviation11.1876886667339
Sum Squared Residuals5256.90386355821

\begin{tabular}{lllllllll}
\hline
Multiple Linear Regression - Regression Statistics \tabularnewline
Multiple R & 0.795209101442698 \tabularnewline
R-squared & 0.632357515017304 \tabularnewline
Adjusted R-squared & 0.501056627523484 \tabularnewline
F-TEST (value) & 4.81609475067004 \tabularnewline
F-TEST (DF numerator) & 15 \tabularnewline
F-TEST (DF denominator) & 42 \tabularnewline
p-value & 2.73510789530196e-05 \tabularnewline
Multiple Linear Regression - Residual Statistics \tabularnewline
Residual Standard Deviation & 11.1876886667339 \tabularnewline
Sum Squared Residuals & 5256.90386355821 \tabularnewline
\hline
\end{tabular}
%Source: https://freestatistics.org/blog/index.php?pk=58090&T=3

[TABLE]
[ROW][C]Multiple Linear Regression - Regression Statistics[/C][/ROW]
[ROW][C]Multiple R[/C][C]0.795209101442698[/C][/ROW]
[ROW][C]R-squared[/C][C]0.632357515017304[/C][/ROW]
[ROW][C]Adjusted R-squared[/C][C]0.501056627523484[/C][/ROW]
[ROW][C]F-TEST (value)[/C][C]4.81609475067004[/C][/ROW]
[ROW][C]F-TEST (DF numerator)[/C][C]15[/C][/ROW]
[ROW][C]F-TEST (DF denominator)[/C][C]42[/C][/ROW]
[ROW][C]p-value[/C][C]2.73510789530196e-05[/C][/ROW]
[ROW][C]Multiple Linear Regression - Residual Statistics[/C][/ROW]
[ROW][C]Residual Standard Deviation[/C][C]11.1876886667339[/C][/ROW]
[ROW][C]Sum Squared Residuals[/C][C]5256.90386355821[/C][/ROW]
[/TABLE]
Source: https://freestatistics.org/blog/index.php?pk=58090&T=3

Globally Unique Identifier (entire table): ba.freestatistics.org/blog/index.php?pk=58090&T=3

As an alternative you can also use a QR Code:  

The GUIDs for individual cells are displayed in the table below:

Multiple Linear Regression - Regression Statistics
Multiple R0.795209101442698
R-squared0.632357515017304
Adjusted R-squared0.501056627523484
F-TEST (value)4.81609475067004
F-TEST (DF numerator)15
F-TEST (DF denominator)42
p-value2.73510789530196e-05
Multiple Linear Regression - Residual Statistics
Residual Standard Deviation11.1876886667339
Sum Squared Residuals5256.90386355821


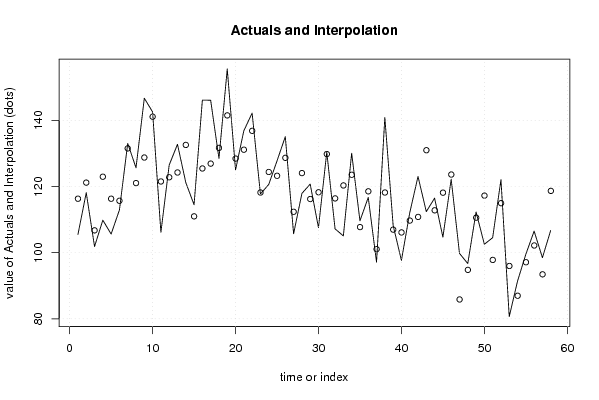
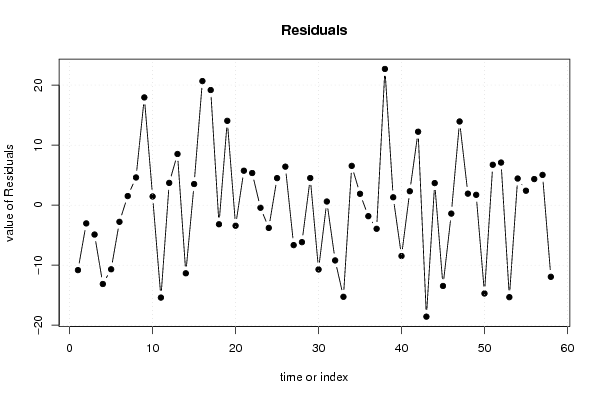
Multiple Linear Regression - Actuals, Interpolation, and Residuals
Time or IndexActualsInterpolationForecastResidualsPrediction Error
1105.5073942116.327182839840-10.8197886398403
2118.1540031121.194616342282-3.04061324228207
3101.8612953106.758378626621-4.89708332662111
4109.8419174122.977800845741-13.1358834457407
5105.6348802116.321284913857-10.6864047138574
6112.927078115.703396386494-2.77631838649371
7133.0698623131.553919906451.51594239354994
8125.6756757121.0602456121224.61543008787832
9146.736359128.78541545871117.9509435412892
10142.5803162141.1336333812781.4466828187219
11106.1448241121.543687546616-15.3988634466159
12126.5170831122.8096065507253.70747654927534
13132.7893932124.2613785733938.5280146266072
14121.2391637132.593337675405-11.3541739754053
15114.5079041110.9885196801413.51938441985927
16146.1499235125.4761204342820.6738030657199
17146.1244263126.94586246102219.1785638389783
18128.5058644131.691336355184-3.18547195518444
19155.5838858141.53320948081114.0506763191888
20125.0382458128.467849260778-3.42960346077757
21136.8944416131.1537126834165.74072891658421
22142.2233554136.8674389627475.35591643725269
23117.7715451118.204687938054-0.433142838053818
24120.627231124.416070163774-3.78883916377362
25127.7664457123.2591448284474.50730087155322
26135.1096379128.6952718632426.41436603675772
27105.7113717112.369505944845-6.65813424484494
28117.9245283124.086616380677-6.1620880806768
29120.754717116.2354967833454.5192202166545
30107.572667118.282711226473-10.7100442264733
31130.4436512129.8382450505070.605406149493046
32107.2157063116.424881601348-9.20917530134752
33105.0739419120.343408998013-15.2694670980133
34130.1121877123.5687162812276.54347141877314
35109.6379398107.7493265010541.88861329894587
36116.7261601118.562350472136-1.83619037213637
3797.11881693101.055750691696-3.93693376169571
38140.8975013118.20299449813922.6945068018607
39108.2865885106.9781961315581.30839236844158
4097.65425803106.128011446106-8.47375341610594
41112.0346762109.7152551605112.31942103948877
42123.0494646110.81157021870912.2378943812905
43112.4171341130.994057994316-18.5769238943156
44116.4966854112.8192234103773.67746198962318
45104.6914839118.155391627623-13.4639077276226
46122.2335543123.640864840735-1.40731054073518
4799.7960224485.852629454276113.9433929857239
4896.7108618194.79330882336541.91755298663464
49112.3151453110.5937383966241.72140690337555
50102.5497195117.263805120931-14.7140856209310
51104.538500897.81106001683486.7274407831652
52122.0805711114.9826492231977.09792187680345
5380.6476287695.9784291412642-15.3308003812642
5491.4074451886.9735049931394.43394018686092
5599.5155532997.1106542579162.40489903208389
56106.527282102.1813953153764.34588668462361
5798.4956654893.45396311223755.0417023677625
58106.7567568118.695516934013-11.9387601340126

\begin{tabular}{lllllllll}
\hline
Multiple Linear Regression - Actuals, Interpolation, and Residuals \tabularnewline
Time or Index & Actuals & InterpolationForecast & ResidualsPrediction Error \tabularnewline
1 & 105.5073942 & 116.327182839840 & -10.8197886398403 \tabularnewline
2 & 118.1540031 & 121.194616342282 & -3.04061324228207 \tabularnewline
3 & 101.8612953 & 106.758378626621 & -4.89708332662111 \tabularnewline
4 & 109.8419174 & 122.977800845741 & -13.1358834457407 \tabularnewline
5 & 105.6348802 & 116.321284913857 & -10.6864047138574 \tabularnewline
6 & 112.927078 & 115.703396386494 & -2.77631838649371 \tabularnewline
7 & 133.0698623 & 131.55391990645 & 1.51594239354994 \tabularnewline
8 & 125.6756757 & 121.060245612122 & 4.61543008787832 \tabularnewline
9 & 146.736359 & 128.785415458711 & 17.9509435412892 \tabularnewline
10 & 142.5803162 & 141.133633381278 & 1.4466828187219 \tabularnewline
11 & 106.1448241 & 121.543687546616 & -15.3988634466159 \tabularnewline
12 & 126.5170831 & 122.809606550725 & 3.70747654927534 \tabularnewline
13 & 132.7893932 & 124.261378573393 & 8.5280146266072 \tabularnewline
14 & 121.2391637 & 132.593337675405 & -11.3541739754053 \tabularnewline
15 & 114.5079041 & 110.988519680141 & 3.51938441985927 \tabularnewline
16 & 146.1499235 & 125.47612043428 & 20.6738030657199 \tabularnewline
17 & 146.1244263 & 126.945862461022 & 19.1785638389783 \tabularnewline
18 & 128.5058644 & 131.691336355184 & -3.18547195518444 \tabularnewline
19 & 155.5838858 & 141.533209480811 & 14.0506763191888 \tabularnewline
20 & 125.0382458 & 128.467849260778 & -3.42960346077757 \tabularnewline
21 & 136.8944416 & 131.153712683416 & 5.74072891658421 \tabularnewline
22 & 142.2233554 & 136.867438962747 & 5.35591643725269 \tabularnewline
23 & 117.7715451 & 118.204687938054 & -0.433142838053818 \tabularnewline
24 & 120.627231 & 124.416070163774 & -3.78883916377362 \tabularnewline
25 & 127.7664457 & 123.259144828447 & 4.50730087155322 \tabularnewline
26 & 135.1096379 & 128.695271863242 & 6.41436603675772 \tabularnewline
27 & 105.7113717 & 112.369505944845 & -6.65813424484494 \tabularnewline
28 & 117.9245283 & 124.086616380677 & -6.1620880806768 \tabularnewline
29 & 120.754717 & 116.235496783345 & 4.5192202166545 \tabularnewline
30 & 107.572667 & 118.282711226473 & -10.7100442264733 \tabularnewline
31 & 130.4436512 & 129.838245050507 & 0.605406149493046 \tabularnewline
32 & 107.2157063 & 116.424881601348 & -9.20917530134752 \tabularnewline
33 & 105.0739419 & 120.343408998013 & -15.2694670980133 \tabularnewline
34 & 130.1121877 & 123.568716281227 & 6.54347141877314 \tabularnewline
35 & 109.6379398 & 107.749326501054 & 1.88861329894587 \tabularnewline
36 & 116.7261601 & 118.562350472136 & -1.83619037213637 \tabularnewline
37 & 97.11881693 & 101.055750691696 & -3.93693376169571 \tabularnewline
38 & 140.8975013 & 118.202994498139 & 22.6945068018607 \tabularnewline
39 & 108.2865885 & 106.978196131558 & 1.30839236844158 \tabularnewline
40 & 97.65425803 & 106.128011446106 & -8.47375341610594 \tabularnewline
41 & 112.0346762 & 109.715255160511 & 2.31942103948877 \tabularnewline
42 & 123.0494646 & 110.811570218709 & 12.2378943812905 \tabularnewline
43 & 112.4171341 & 130.994057994316 & -18.5769238943156 \tabularnewline
44 & 116.4966854 & 112.819223410377 & 3.67746198962318 \tabularnewline
45 & 104.6914839 & 118.155391627623 & -13.4639077276226 \tabularnewline
46 & 122.2335543 & 123.640864840735 & -1.40731054073518 \tabularnewline
47 & 99.79602244 & 85.8526294542761 & 13.9433929857239 \tabularnewline
48 & 96.71086181 & 94.7933088233654 & 1.91755298663464 \tabularnewline
49 & 112.3151453 & 110.593738396624 & 1.72140690337555 \tabularnewline
50 & 102.5497195 & 117.263805120931 & -14.7140856209310 \tabularnewline
51 & 104.5385008 & 97.8110600168348 & 6.7274407831652 \tabularnewline
52 & 122.0805711 & 114.982649223197 & 7.09792187680345 \tabularnewline
53 & 80.64762876 & 95.9784291412642 & -15.3308003812642 \tabularnewline
54 & 91.40744518 & 86.973504993139 & 4.43394018686092 \tabularnewline
55 & 99.51555329 & 97.110654257916 & 2.40489903208389 \tabularnewline
56 & 106.527282 & 102.181395315376 & 4.34588668462361 \tabularnewline
57 & 98.49566548 & 93.4539631122375 & 5.0417023677625 \tabularnewline
58 & 106.7567568 & 118.695516934013 & -11.9387601340126 \tabularnewline
\hline
\end{tabular}
%Source: https://freestatistics.org/blog/index.php?pk=58090&T=4

[TABLE]
[ROW][C]Multiple Linear Regression - Actuals, Interpolation, and Residuals[/C][/ROW]
[ROW][C]Time or Index[/C][C]Actuals[/C][C]InterpolationForecast[/C][C]ResidualsPrediction Error[/C][/ROW]
[ROW][C]1[/C][C]105.5073942[/C][C]116.327182839840[/C][C]-10.8197886398403[/C][/ROW]
[ROW][C]2[/C][C]118.1540031[/C][C]121.194616342282[/C][C]-3.04061324228207[/C][/ROW]
[ROW][C]3[/C][C]101.8612953[/C][C]106.758378626621[/C][C]-4.89708332662111[/C][/ROW]
[ROW][C]4[/C][C]109.8419174[/C][C]122.977800845741[/C][C]-13.1358834457407[/C][/ROW]
[ROW][C]5[/C][C]105.6348802[/C][C]116.321284913857[/C][C]-10.6864047138574[/C][/ROW]
[ROW][C]6[/C][C]112.927078[/C][C]115.703396386494[/C][C]-2.77631838649371[/C][/ROW]
[ROW][C]7[/C][C]133.0698623[/C][C]131.55391990645[/C][C]1.51594239354994[/C][/ROW]
[ROW][C]8[/C][C]125.6756757[/C][C]121.060245612122[/C][C]4.61543008787832[/C][/ROW]
[ROW][C]9[/C][C]146.736359[/C][C]128.785415458711[/C][C]17.9509435412892[/C][/ROW]
[ROW][C]10[/C][C]142.5803162[/C][C]141.133633381278[/C][C]1.4466828187219[/C][/ROW]
[ROW][C]11[/C][C]106.1448241[/C][C]121.543687546616[/C][C]-15.3988634466159[/C][/ROW]
[ROW][C]12[/C][C]126.5170831[/C][C]122.809606550725[/C][C]3.70747654927534[/C][/ROW]
[ROW][C]13[/C][C]132.7893932[/C][C]124.261378573393[/C][C]8.5280146266072[/C][/ROW]
[ROW][C]14[/C][C]121.2391637[/C][C]132.593337675405[/C][C]-11.3541739754053[/C][/ROW]
[ROW][C]15[/C][C]114.5079041[/C][C]110.988519680141[/C][C]3.51938441985927[/C][/ROW]
[ROW][C]16[/C][C]146.1499235[/C][C]125.47612043428[/C][C]20.6738030657199[/C][/ROW]
[ROW][C]17[/C][C]146.1244263[/C][C]126.945862461022[/C][C]19.1785638389783[/C][/ROW]
[ROW][C]18[/C][C]128.5058644[/C][C]131.691336355184[/C][C]-3.18547195518444[/C][/ROW]
[ROW][C]19[/C][C]155.5838858[/C][C]141.533209480811[/C][C]14.0506763191888[/C][/ROW]
[ROW][C]20[/C][C]125.0382458[/C][C]128.467849260778[/C][C]-3.42960346077757[/C][/ROW]
[ROW][C]21[/C][C]136.8944416[/C][C]131.153712683416[/C][C]5.74072891658421[/C][/ROW]
[ROW][C]22[/C][C]142.2233554[/C][C]136.867438962747[/C][C]5.35591643725269[/C][/ROW]
[ROW][C]23[/C][C]117.7715451[/C][C]118.204687938054[/C][C]-0.433142838053818[/C][/ROW]
[ROW][C]24[/C][C]120.627231[/C][C]124.416070163774[/C][C]-3.78883916377362[/C][/ROW]
[ROW][C]25[/C][C]127.7664457[/C][C]123.259144828447[/C][C]4.50730087155322[/C][/ROW]
[ROW][C]26[/C][C]135.1096379[/C][C]128.695271863242[/C][C]6.41436603675772[/C][/ROW]
[ROW][C]27[/C][C]105.7113717[/C][C]112.369505944845[/C][C]-6.65813424484494[/C][/ROW]
[ROW][C]28[/C][C]117.9245283[/C][C]124.086616380677[/C][C]-6.1620880806768[/C][/ROW]
[ROW][C]29[/C][C]120.754717[/C][C]116.235496783345[/C][C]4.5192202166545[/C][/ROW]
[ROW][C]30[/C][C]107.572667[/C][C]118.282711226473[/C][C]-10.7100442264733[/C][/ROW]
[ROW][C]31[/C][C]130.4436512[/C][C]129.838245050507[/C][C]0.605406149493046[/C][/ROW]
[ROW][C]32[/C][C]107.2157063[/C][C]116.424881601348[/C][C]-9.20917530134752[/C][/ROW]
[ROW][C]33[/C][C]105.0739419[/C][C]120.343408998013[/C][C]-15.2694670980133[/C][/ROW]
[ROW][C]34[/C][C]130.1121877[/C][C]123.568716281227[/C][C]6.54347141877314[/C][/ROW]
[ROW][C]35[/C][C]109.6379398[/C][C]107.749326501054[/C][C]1.88861329894587[/C][/ROW]
[ROW][C]36[/C][C]116.7261601[/C][C]118.562350472136[/C][C]-1.83619037213637[/C][/ROW]
[ROW][C]37[/C][C]97.11881693[/C][C]101.055750691696[/C][C]-3.93693376169571[/C][/ROW]
[ROW][C]38[/C][C]140.8975013[/C][C]118.202994498139[/C][C]22.6945068018607[/C][/ROW]
[ROW][C]39[/C][C]108.2865885[/C][C]106.978196131558[/C][C]1.30839236844158[/C][/ROW]
[ROW][C]40[/C][C]97.65425803[/C][C]106.128011446106[/C][C]-8.47375341610594[/C][/ROW]
[ROW][C]41[/C][C]112.0346762[/C][C]109.715255160511[/C][C]2.31942103948877[/C][/ROW]
[ROW][C]42[/C][C]123.0494646[/C][C]110.811570218709[/C][C]12.2378943812905[/C][/ROW]
[ROW][C]43[/C][C]112.4171341[/C][C]130.994057994316[/C][C]-18.5769238943156[/C][/ROW]
[ROW][C]44[/C][C]116.4966854[/C][C]112.819223410377[/C][C]3.67746198962318[/C][/ROW]
[ROW][C]45[/C][C]104.6914839[/C][C]118.155391627623[/C][C]-13.4639077276226[/C][/ROW]
[ROW][C]46[/C][C]122.2335543[/C][C]123.640864840735[/C][C]-1.40731054073518[/C][/ROW]
[ROW][C]47[/C][C]99.79602244[/C][C]85.8526294542761[/C][C]13.9433929857239[/C][/ROW]
[ROW][C]48[/C][C]96.71086181[/C][C]94.7933088233654[/C][C]1.91755298663464[/C][/ROW]
[ROW][C]49[/C][C]112.3151453[/C][C]110.593738396624[/C][C]1.72140690337555[/C][/ROW]
[ROW][C]50[/C][C]102.5497195[/C][C]117.263805120931[/C][C]-14.7140856209310[/C][/ROW]
[ROW][C]51[/C][C]104.5385008[/C][C]97.8110600168348[/C][C]6.7274407831652[/C][/ROW]
[ROW][C]52[/C][C]122.0805711[/C][C]114.982649223197[/C][C]7.09792187680345[/C][/ROW]
[ROW][C]53[/C][C]80.64762876[/C][C]95.9784291412642[/C][C]-15.3308003812642[/C][/ROW]
[ROW][C]54[/C][C]91.40744518[/C][C]86.973504993139[/C][C]4.43394018686092[/C][/ROW]
[ROW][C]55[/C][C]99.51555329[/C][C]97.110654257916[/C][C]2.40489903208389[/C][/ROW]
[ROW][C]56[/C][C]106.527282[/C][C]102.181395315376[/C][C]4.34588668462361[/C][/ROW]
[ROW][C]57[/C][C]98.49566548[/C][C]93.4539631122375[/C][C]5.0417023677625[/C][/ROW]
[ROW][C]58[/C][C]106.7567568[/C][C]118.695516934013[/C][C]-11.9387601340126[/C][/ROW]
[/TABLE]
Source: https://freestatistics.org/blog/index.php?pk=58090&T=4

Globally Unique Identifier (entire table): ba.freestatistics.org/blog/index.php?pk=58090&T=4

As an alternative you can also use a QR Code:  

The GUIDs for individual cells are displayed in the table below:

Multiple Linear Regression - Actuals, Interpolation, and Residuals
Time or IndexActualsInterpolationForecastResidualsPrediction Error
1105.5073942116.327182839840-10.8197886398403
2118.1540031121.194616342282-3.04061324228207
3101.8612953106.758378626621-4.89708332662111
4109.8419174122.977800845741-13.1358834457407
5105.6348802116.321284913857-10.6864047138574
6112.927078115.703396386494-2.77631838649371
7133.0698623131.553919906451.51594239354994
8125.6756757121.0602456121224.61543008787832
9146.736359128.78541545871117.9509435412892
10142.5803162141.1336333812781.4466828187219
11106.1448241121.543687546616-15.3988634466159
12126.5170831122.8096065507253.70747654927534
13132.7893932124.2613785733938.5280146266072
14121.2391637132.593337675405-11.3541739754053
15114.5079041110.9885196801413.51938441985927
16146.1499235125.4761204342820.6738030657199
17146.1244263126.94586246102219.1785638389783
18128.5058644131.691336355184-3.18547195518444
19155.5838858141.53320948081114.0506763191888
20125.0382458128.467849260778-3.42960346077757
21136.8944416131.1537126834165.74072891658421
22142.2233554136.8674389627475.35591643725269
23117.7715451118.204687938054-0.433142838053818
24120.627231124.416070163774-3.78883916377362
25127.7664457123.2591448284474.50730087155322
26135.1096379128.6952718632426.41436603675772
27105.7113717112.369505944845-6.65813424484494
28117.9245283124.086616380677-6.1620880806768
29120.754717116.2354967833454.5192202166545
30107.572667118.282711226473-10.7100442264733
31130.4436512129.8382450505070.605406149493046
32107.2157063116.424881601348-9.20917530134752
33105.0739419120.343408998013-15.2694670980133
34130.1121877123.5687162812276.54347141877314
35109.6379398107.7493265010541.88861329894587
36116.7261601118.562350472136-1.83619037213637
3797.11881693101.055750691696-3.93693376169571
38140.8975013118.20299449813922.6945068018607
39108.2865885106.9781961315581.30839236844158
4097.65425803106.128011446106-8.47375341610594
41112.0346762109.7152551605112.31942103948877
42123.0494646110.81157021870912.2378943812905
43112.4171341130.994057994316-18.5769238943156
44116.4966854112.8192234103773.67746198962318
45104.6914839118.155391627623-13.4639077276226
46122.2335543123.640864840735-1.40731054073518
4799.7960224485.852629454276113.9433929857239
4896.7108618194.79330882336541.91755298663464
49112.3151453110.5937383966241.72140690337555
50102.5497195117.263805120931-14.7140856209310
51104.538500897.81106001683486.7274407831652
52122.0805711114.9826492231977.09792187680345
5380.6476287695.9784291412642-15.3308003812642
5491.4074451886.9735049931394.43394018686092
5599.5155532997.1106542579162.40489903208389
56106.527282102.1813953153764.34588668462361
5798.4956654893.45396311223755.0417023677625
58106.7567568118.695516934013-11.9387601340126


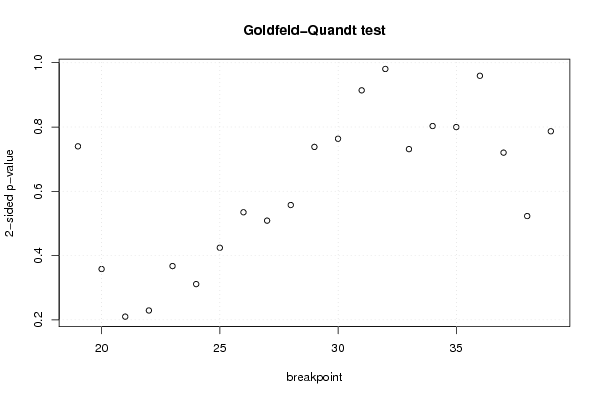
Goldfeld-Quandt test for Heteroskedasticity
p-valuesAlternative Hypothesis
breakpoint indexgreater2-sidedless
190.6300202100573010.7399595798853980.369979789942699
200.820924964061380.3581500718772410.179075035938621
210.894986902180120.2100261956397590.105013097819880
220.8853891540149370.2292216919701260.114610845985063
230.8162879039877910.3674241920244180.183712096012209
240.8443285171882510.3113429656234980.155671482811749
250.7878200170913170.4243599658173660.212179982908683
260.7325943535648060.5348112928703880.267405646435194
270.7456289207671980.5087421584656040.254371079232802
280.7213633532486390.5572732935027220.278636646751361
290.6309558511038790.7380882977922420.369044148896121
300.6182693152112050.763461369577590.381730684788795
310.5429377735235490.9141244529529020.457062226476451
320.5096742840047050.980651431990590.490325715995295
330.6343799533418720.7312400933162550.365620046658128
340.5984900663030610.8030198673938770.401509933696939
350.6001133275141850.799773344971630.399886672485815
360.4796999371700520.9593998743401030.520300062829948
370.3601280602572870.7202561205145750.639871939742713
380.7385026652686150.5229946694627710.261497334731385
390.6065959528628640.7868080942742710.393404047137136

\begin{tabular}{lllllllll}
\hline
Goldfeld-Quandt test for Heteroskedasticity \tabularnewline
p-values & Alternative Hypothesis \tabularnewline
breakpoint index & greater & 2-sided & less \tabularnewline
19 & 0.630020210057301 & 0.739959579885398 & 0.369979789942699 \tabularnewline
20 & 0.82092496406138 & 0.358150071877241 & 0.179075035938621 \tabularnewline
21 & 0.89498690218012 & 0.210026195639759 & 0.105013097819880 \tabularnewline
22 & 0.885389154014937 & 0.229221691970126 & 0.114610845985063 \tabularnewline
23 & 0.816287903987791 & 0.367424192024418 & 0.183712096012209 \tabularnewline
24 & 0.844328517188251 & 0.311342965623498 & 0.155671482811749 \tabularnewline
25 & 0.787820017091317 & 0.424359965817366 & 0.212179982908683 \tabularnewline
26 & 0.732594353564806 & 0.534811292870388 & 0.267405646435194 \tabularnewline
27 & 0.745628920767198 & 0.508742158465604 & 0.254371079232802 \tabularnewline
28 & 0.721363353248639 & 0.557273293502722 & 0.278636646751361 \tabularnewline
29 & 0.630955851103879 & 0.738088297792242 & 0.369044148896121 \tabularnewline
30 & 0.618269315211205 & 0.76346136957759 & 0.381730684788795 \tabularnewline
31 & 0.542937773523549 & 0.914124452952902 & 0.457062226476451 \tabularnewline
32 & 0.509674284004705 & 0.98065143199059 & 0.490325715995295 \tabularnewline
33 & 0.634379953341872 & 0.731240093316255 & 0.365620046658128 \tabularnewline
34 & 0.598490066303061 & 0.803019867393877 & 0.401509933696939 \tabularnewline
35 & 0.600113327514185 & 0.79977334497163 & 0.399886672485815 \tabularnewline
36 & 0.479699937170052 & 0.959399874340103 & 0.520300062829948 \tabularnewline
37 & 0.360128060257287 & 0.720256120514575 & 0.639871939742713 \tabularnewline
38 & 0.738502665268615 & 0.522994669462771 & 0.261497334731385 \tabularnewline
39 & 0.606595952862864 & 0.786808094274271 & 0.393404047137136 \tabularnewline
\hline
\end{tabular}
%Source: https://freestatistics.org/blog/index.php?pk=58090&T=5

[TABLE]
[ROW][C]Goldfeld-Quandt test for Heteroskedasticity[/C][/ROW]
[ROW][C]p-values[/C][C]Alternative Hypothesis[/C][/ROW]
[ROW][C]breakpoint index[/C][C]greater[/C][C]2-sided[/C][C]less[/C][/ROW]
[ROW][C]19[/C][C]0.630020210057301[/C][C]0.739959579885398[/C][C]0.369979789942699[/C][/ROW]
[ROW][C]20[/C][C]0.82092496406138[/C][C]0.358150071877241[/C][C]0.179075035938621[/C][/ROW]
[ROW][C]21[/C][C]0.89498690218012[/C][C]0.210026195639759[/C][C]0.105013097819880[/C][/ROW]
[ROW][C]22[/C][C]0.885389154014937[/C][C]0.229221691970126[/C][C]0.114610845985063[/C][/ROW]
[ROW][C]23[/C][C]0.816287903987791[/C][C]0.367424192024418[/C][C]0.183712096012209[/C][/ROW]
[ROW][C]24[/C][C]0.844328517188251[/C][C]0.311342965623498[/C][C]0.155671482811749[/C][/ROW]
[ROW][C]25[/C][C]0.787820017091317[/C][C]0.424359965817366[/C][C]0.212179982908683[/C][/ROW]
[ROW][C]26[/C][C]0.732594353564806[/C][C]0.534811292870388[/C][C]0.267405646435194[/C][/ROW]
[ROW][C]27[/C][C]0.745628920767198[/C][C]0.508742158465604[/C][C]0.254371079232802[/C][/ROW]
[ROW][C]28[/C][C]0.721363353248639[/C][C]0.557273293502722[/C][C]0.278636646751361[/C][/ROW]
[ROW][C]29[/C][C]0.630955851103879[/C][C]0.738088297792242[/C][C]0.369044148896121[/C][/ROW]
[ROW][C]30[/C][C]0.618269315211205[/C][C]0.76346136957759[/C][C]0.381730684788795[/C][/ROW]
[ROW][C]31[/C][C]0.542937773523549[/C][C]0.914124452952902[/C][C]0.457062226476451[/C][/ROW]
[ROW][C]32[/C][C]0.509674284004705[/C][C]0.98065143199059[/C][C]0.490325715995295[/C][/ROW]
[ROW][C]33[/C][C]0.634379953341872[/C][C]0.731240093316255[/C][C]0.365620046658128[/C][/ROW]
[ROW][C]34[/C][C]0.598490066303061[/C][C]0.803019867393877[/C][C]0.401509933696939[/C][/ROW]
[ROW][C]35[/C][C]0.600113327514185[/C][C]0.79977334497163[/C][C]0.399886672485815[/C][/ROW]
[ROW][C]36[/C][C]0.479699937170052[/C][C]0.959399874340103[/C][C]0.520300062829948[/C][/ROW]
[ROW][C]37[/C][C]0.360128060257287[/C][C]0.720256120514575[/C][C]0.639871939742713[/C][/ROW]
[ROW][C]38[/C][C]0.738502665268615[/C][C]0.522994669462771[/C][C]0.261497334731385[/C][/ROW]
[ROW][C]39[/C][C]0.606595952862864[/C][C]0.786808094274271[/C][C]0.393404047137136[/C][/ROW]
[/TABLE]
Source: https://freestatistics.org/blog/index.php?pk=58090&T=5

Globally Unique Identifier (entire table): ba.freestatistics.org/blog/index.php?pk=58090&T=5

As an alternative you can also use a QR Code:  

The GUIDs for individual cells are displayed in the table below:

Goldfeld-Quandt test for Heteroskedasticity
p-valuesAlternative Hypothesis
breakpoint indexgreater2-sidedless
190.6300202100573010.7399595798853980.369979789942699
200.820924964061380.3581500718772410.179075035938621
210.894986902180120.2100261956397590.105013097819880
220.8853891540149370.2292216919701260.114610845985063
230.8162879039877910.3674241920244180.183712096012209
240.8443285171882510.3113429656234980.155671482811749
250.7878200170913170.4243599658173660.212179982908683
260.7325943535648060.5348112928703880.267405646435194
270.7456289207671980.5087421584656040.254371079232802
280.7213633532486390.5572732935027220.278636646751361
290.6309558511038790.7380882977922420.369044148896121
300.6182693152112050.763461369577590.381730684788795
310.5429377735235490.9141244529529020.457062226476451
320.5096742840047050.980651431990590.490325715995295
330.6343799533418720.7312400933162550.365620046658128
340.5984900663030610.8030198673938770.401509933696939
350.6001133275141850.799773344971630.399886672485815
360.4796999371700520.9593998743401030.520300062829948
370.3601280602572870.7202561205145750.639871939742713
380.7385026652686150.5229946694627710.261497334731385
390.6065959528628640.7868080942742710.393404047137136


Meta Analysis of Goldfeld-Quandt test for Heteroskedasticity
Description# significant tests% significant testsOK/NOK
1% type I error level00OK
5% type I error level00OK
10% type I error level00OK

\begin{tabular}{lllllllll}
\hline
Meta Analysis of Goldfeld-Quandt test for Heteroskedasticity \tabularnewline
Description & # significant tests & % significant tests & OK/NOK \tabularnewline
1% type I error level & 0 & 0 & OK \tabularnewline
5% type I error level & 0 & 0 & OK \tabularnewline
10% type I error level & 0 & 0 & OK \tabularnewline
\hline
\end{tabular}
%Source: https://freestatistics.org/blog/index.php?pk=58090&T=6

[TABLE]
[ROW][C]Meta Analysis of Goldfeld-Quandt test for Heteroskedasticity[/C][/ROW]
[ROW][C]Description[/C][C]# significant tests[/C][C]% significant tests[/C][C]OK/NOK[/C][/ROW]
[ROW][C]1% type I error level[/C][C]0[/C][C]0[/C][C]OK[/C][/ROW]
[ROW][C]5% type I error level[/C][C]0[/C][C]0[/C][C]OK[/C][/ROW]
[ROW][C]10% type I error level[/C][C]0[/C][C]0[/C][C]OK[/C][/ROW]
[/TABLE]
Source: https://freestatistics.org/blog/index.php?pk=58090&T=6

Globally Unique Identifier (entire table): ba.freestatistics.org/blog/index.php?pk=58090&T=6

As an alternative you can also use a QR Code:  

The GUIDs for individual cells are displayed in the table below:

Meta Analysis of Goldfeld-Quandt test for Heteroskedasticity
Description# significant tests% significant testsOK/NOK
1% type I error level00OK
5% type I error level00OK
10% type I error level00OK


Parameters (Session):
par1 = 1 ; par2 = Include Monthly Dummies ; par3 = Linear Trend ;
Parameters (R input):
par1 = 1 ; par2 = Include Monthly Dummies ; par3 = Linear Trend ;
R code (references can be found in the software module):
library(lattice)
library(lmtest)
n25 <- 25 #minimum number of obs. for Goldfeld-Quandt test
par1 <- as.numeric(par1)
x <- t(y)
k <- length(x[1,])
n <- length(x[,1])
x1 <- cbind(x[,par1], x[,1:k!=par1])
mycolnames <- c(colnames(x)[par1], colnames(x)[1:k!=par1])
colnames(x1) <- mycolnames #colnames(x)[par1]
x <- x1
if (par3 == 'First Differences'){
x2 <- array(0, dim=c(n-1,k), dimnames=list(1:(n-1), paste('(1-B)',colnames(x),sep='')))
for (i in 1:n-1) {
for (j in 1:k) {
x2[i,j] <- x[i+1,j] - x[i,j]
}
}
x <- x2
}
if (par2 == 'Include Monthly Dummies'){
x2 <- array(0, dim=c(n,11), dimnames=list(1:n, paste('M', seq(1:11), sep ='')))
for (i in 1:11){
x2[seq(i,n,12),i] <- 1
}
x <- cbind(x, x2)
}
if (par2 == 'Include Quarterly Dummies'){
x2 <- array(0, dim=c(n,3), dimnames=list(1:n, paste('Q', seq(1:3), sep ='')))
for (i in 1:3){
x2[seq(i,n,4),i] <- 1
}
x <- cbind(x, x2)
}
k <- length(x[1,])
if (par3 == 'Linear Trend'){
x <- cbind(x, c(1:n))
colnames(x)[k+1] <- 't'
}
x
k <- length(x[1,])
df <- as.data.frame(x)
(mylm <- lm(df))
(mysum <- summary(mylm))
if (n > n25) {
kp3 <- k + 3
nmkm3 <- n - k - 3
gqarr <- array(NA, dim=c(nmkm3-kp3+1,3))
numgqtests <- 0
numsignificant1 <- 0
numsignificant5 <- 0
numsignificant10 <- 0
for (mypoint in kp3:nmkm3) {
j <- 0
numgqtests <- numgqtests + 1
for (myalt in c('greater', 'two.sided', 'less')) {
j <- j + 1
gqarr[mypoint-kp3+1,j] <- gqtest(mylm, point=mypoint, alternative=myalt)$p.value
}
if (gqarr[mypoint-kp3+1,2] < 0.01) numsignificant1 <- numsignificant1 + 1
if (gqarr[mypoint-kp3+1,2] < 0.05) numsignificant5 <- numsignificant5 + 1
if (gqarr[mypoint-kp3+1,2] < 0.10) numsignificant10 <- numsignificant10 + 1
}
gqarr
}
bitmap(file='test0.png')
plot(x[,1], type='l', main='Actuals and Interpolation', ylab='value of Actuals and Interpolation (dots)', xlab='time or index')
points(x[,1]-mysum$resid)
grid()
dev.off()
bitmap(file='test1.png')
plot(mysum$resid, type='b', pch=19, main='Residuals', ylab='value of Residuals', xlab='time or index')
grid()
dev.off()
bitmap(file='test2.png')
hist(mysum$resid, main='Residual Histogram', xlab='values of Residuals')
grid()
dev.off()
bitmap(file='test3.png')
densityplot(~mysum$resid,col='black',main='Residual Density Plot', xlab='values of Residuals')
dev.off()
bitmap(file='test4.png')
qqnorm(mysum$resid, main='Residual Normal Q-Q Plot')
qqline(mysum$resid)
grid()
dev.off()
(myerror <- as.ts(mysum$resid))
bitmap(file='test5.png')
dum <- cbind(lag(myerror,k=1),myerror)
dum
dum1 <- dum[2:length(myerror),]
dum1
z <- as.data.frame(dum1)
z
plot(z,main=paste('Residual Lag plot, lowess, and regression line'), ylab='values of Residuals', xlab='lagged values of Residuals')
lines(lowess(z))
abline(lm(z))
grid()
dev.off()
bitmap(file='test6.png')
acf(mysum$resid, lag.max=length(mysum$resid)/2, main='Residual Autocorrelation Function')
grid()
dev.off()
bitmap(file='test7.png')
pacf(mysum$resid, lag.max=length(mysum$resid)/2, main='Residual Partial Autocorrelation Function')
grid()
dev.off()
bitmap(file='test8.png')
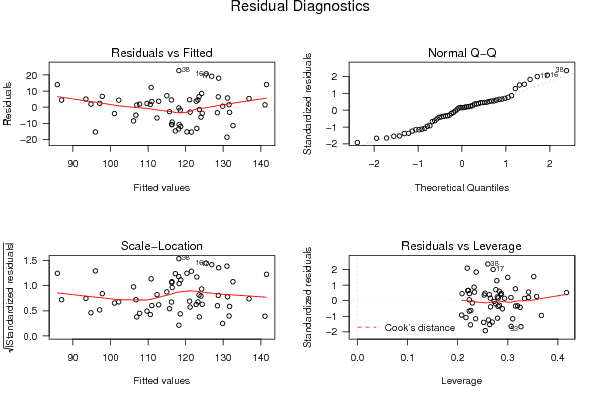
opar <- par(mfrow = c(2,2), oma = c(0, 0, 1.1, 0))
plot(mylm, las = 1, sub='Residual Diagnostics')
par(opar)
dev.off()
if (n > n25) {
bitmap(file='test9.png')
plot(kp3:nmkm3,gqarr[,2], main='Goldfeld-Quandt test',ylab='2-sided p-value',xlab='breakpoint')
grid()
dev.off()
}
load(file='createtable')
a<-table.start()
a<-table.row.start(a)
a<-table.element(a, 'Multiple Linear Regression - Estimated Regression Equation', 1, TRUE)
a<-table.row.end(a)
myeq <- colnames(x)[1]
myeq <- paste(myeq, '[t] = ', sep='')
for (i in 1:k){
if (mysum$coefficients[i,1] > 0) myeq <- paste(myeq, '+', '')
myeq <- paste(myeq, mysum$coefficients[i,1], sep=' ')
if (rownames(mysum$coefficients)[i] != '(Intercept)') {
myeq <- paste(myeq, rownames(mysum$coefficients)[i], sep='')
if (rownames(mysum$coefficients)[i] != 't') myeq <- paste(myeq, '[t]', sep='')
}
}
myeq <- paste(myeq, ' + e[t]')
a<-table.row.start(a)
a<-table.element(a, myeq)
a<-table.row.end(a)
a<-table.end(a)
table.save(a,file='mytable1.tab')
a<-table.start()
a<-table.row.start(a)
a<-table.element(a,hyperlink('ols1.htm','Multiple Linear Regression - Ordinary Least Squares',''), 6, TRUE)
a<-table.row.end(a)
a<-table.row.start(a)
a<-table.element(a,'Variable',header=TRUE)
a<-table.element(a,'Parameter',header=TRUE)
a<-table.element(a,'S.D.',header=TRUE)
a<-table.element(a,'T-STAT
H0: parameter = 0',header=TRUE)
a<-table.element(a,'2-tail p-value',header=TRUE)
a<-table.element(a,'1-tail p-value',header=TRUE)
a<-table.row.end(a)
for (i in 1:k){
a<-table.row.start(a)
a<-table.element(a,rownames(mysum$coefficients)[i],header=TRUE)
a<-table.element(a,mysum$coefficients[i,1])
a<-table.element(a, round(mysum$coefficients[i,2],6))
a<-table.element(a, round(mysum$coefficients[i,3],4))
a<-table.element(a, round(mysum$coefficients[i,4],6))
a<-table.element(a, round(mysum$coefficients[i,4]/2,6))
a<-table.row.end(a)
}
a<-table.end(a)
table.save(a,file='mytable2.tab')
a<-table.start()
a<-table.row.start(a)
a<-table.element(a, 'Multiple Linear Regression - Regression Statistics', 2, TRUE)
a<-table.row.end(a)
a<-table.row.start(a)
a<-table.element(a, 'Multiple R',1,TRUE)
a<-table.element(a, sqrt(mysum$r.squared))
a<-table.row.end(a)
a<-table.row.start(a)
a<-table.element(a, 'R-squared',1,TRUE)
a<-table.element(a, mysum$r.squared)
a<-table.row.end(a)
a<-table.row.start(a)
a<-table.element(a, 'Adjusted R-squared',1,TRUE)
a<-table.element(a, mysum$adj.r.squared)
a<-table.row.end(a)
a<-table.row.start(a)
a<-table.element(a, 'F-TEST (value)',1,TRUE)
a<-table.element(a, mysum$fstatistic[1])
a<-table.row.end(a)
a<-table.row.start(a)
a<-table.element(a, 'F-TEST (DF numerator)',1,TRUE)
a<-table.element(a, mysum$fstatistic[2])
a<-table.row.end(a)
a<-table.row.start(a)
a<-table.element(a, 'F-TEST (DF denominator)',1,TRUE)
a<-table.element(a, mysum$fstatistic[3])
a<-table.row.end(a)
a<-table.row.start(a)
a<-table.element(a, 'p-value',1,TRUE)
a<-table.element(a, 1-pf(mysum$fstatistic[1],mysum$fstatistic[2],mysum$fstatistic[3]))
a<-table.row.end(a)
a<-table.row.start(a)
a<-table.element(a, 'Multiple Linear Regression - Residual Statistics', 2, TRUE)
a<-table.row.end(a)
a<-table.row.start(a)
a<-table.element(a, 'Residual Standard Deviation',1,TRUE)
a<-table.element(a, mysum$sigma)
a<-table.row.end(a)
a<-table.row.start(a)
a<-table.element(a, 'Sum Squared Residuals',1,TRUE)
a<-table.element(a, sum(myerror*myerror))
a<-table.row.end(a)
a<-table.end(a)
table.save(a,file='mytable3.tab')
a<-table.start()
a<-table.row.start(a)
a<-table.element(a, 'Multiple Linear Regression - Actuals, Interpolation, and Residuals', 4, TRUE)
a<-table.row.end(a)
a<-table.row.start(a)
a<-table.element(a, 'Time or Index', 1, TRUE)
a<-table.element(a, 'Actuals', 1, TRUE)
a<-table.element(a, 'Interpolation
Forecast', 1, TRUE)
a<-table.element(a, 'Residuals
Prediction Error', 1, TRUE)
a<-table.row.end(a)
for (i in 1:n) {
a<-table.row.start(a)
a<-table.element(a,i, 1, TRUE)
a<-table.element(a,x[i])
a<-table.element(a,x[i]-mysum$resid[i])
a<-table.element(a,mysum$resid[i])
a<-table.row.end(a)
}
a<-table.end(a)
table.save(a,file='mytable4.tab')
if (n > n25) {
a<-table.start()
a<-table.row.start(a)
a<-table.element(a,'Goldfeld-Quandt test for Heteroskedasticity',4,TRUE)
a<-table.row.end(a)
a<-table.row.start(a)
a<-table.element(a,'p-values',header=TRUE)
a<-table.element(a,'Alternative Hypothesis',3,header=TRUE)
a<-table.row.end(a)
a<-table.row.start(a)
a<-table.element(a,'breakpoint index',header=TRUE)
a<-table.element(a,'greater',header=TRUE)
a<-table.element(a,'2-sided',header=TRUE)
a<-table.element(a,'less',header=TRUE)
a<-table.row.end(a)
for (mypoint in kp3:nmkm3) {
a<-table.row.start(a)
a<-table.element(a,mypoint,header=TRUE)
a<-table.element(a,gqarr[mypoint-kp3+1,1])
a<-table.element(a,gqarr[mypoint-kp3+1,2])
a<-table.element(a,gqarr[mypoint-kp3+1,3])
a<-table.row.end(a)
}
a<-table.end(a)
table.save(a,file='mytable5.tab')
a<-table.start()
a<-table.row.start(a)
a<-table.element(a,'Meta Analysis of Goldfeld-Quandt test for Heteroskedasticity',4,TRUE)
a<-table.row.end(a)
a<-table.row.start(a)
a<-table.element(a,'Description',header=TRUE)
a<-table.element(a,'# significant tests',header=TRUE)
a<-table.element(a,'% significant tests',header=TRUE)
a<-table.element(a,'OK/NOK',header=TRUE)
a<-table.row.end(a)
a<-table.row.start(a)
a<-table.element(a,'1% type I error level',header=TRUE)
a<-table.element(a,numsignificant1)
a<-table.element(a,numsignificant1/numgqtests)
if (numsignificant1/numgqtests < 0.01) dum <- 'OK' else dum <- 'NOK'
a<-table.element(a,dum)
a<-table.row.end(a)
a<-table.row.start(a)
a<-table.element(a,'5% type I error level',header=TRUE)
a<-table.element(a,numsignificant5)
a<-table.element(a,numsignificant5/numgqtests)
if (numsignificant5/numgqtests < 0.05) dum <- 'OK' else dum <- 'NOK'
a<-table.element(a,dum)
a<-table.row.end(a)
a<-table.row.start(a)
a<-table.element(a,'10% type I error level',header=TRUE)
a<-table.element(a,numsignificant10)
a<-table.element(a,numsignificant10/numgqtests)
if (numsignificant10/numgqtests < 0.1) dum <- 'OK' else dum <- 'NOK'
a<-table.element(a,dum)
a<-table.row.end(a)
a<-table.end(a)
table.save(a,file='mytable6.tab')
}