| Multiple Linear Regression - Estimated Regression Equation |
| Y[t] = + 0.828054484333973 + 0.118092413961489X[t] + 1.39245913482402Y1[t] -0.532231626987506Y2[t] -0.386918622865897Y3[t] + 0.441898655528487Y4[t] + 0.0116479357493733M1[t] -0.0903743560875964M2[t] + 0.0488973179489897M3[t] -0.0144921933048258M4[t] -0.0978713441555035M5[t] + 0.0190056749325876M6[t] -0.0414326074099239M7[t] + 0.0444449825289134M8[t] -0.0775862591018103M9[t] -0.0350555474036831M10[t] + 0.00144550210597445M11[t] -0.00620621971200828t + e[t] |
| Multiple Linear Regression - Ordinary Least Squares | |||||
| Variable | Parameter | S.D. | T-STAT H0: parameter = 0 | 2-tail p-value | 1-tail p-value |
| (Intercept) | 0.828054484333973 | 0.66162 | 1.2516 | 0.218382 | 0.109191 |
| X | 0.118092413961489 | 0.083523 | 1.4139 | 0.165536 | 0.082768 |
| Y1 | 1.39245913482402 | 0.133981 | 10.393 | 0 | 0 |
| Y2 | -0.532231626987506 | 0.24471 | -2.175 | 0.035925 | 0.017963 |
| Y3 | -0.386918622865897 | 0.249732 | -1.5493 | 0.129591 | 0.064795 |
| Y4 | 0.441898655528487 | 0.149301 | 2.9598 | 0.005278 | 0.002639 |
| M1 | 0.0116479357493733 | 0.091388 | 0.1275 | 0.899252 | 0.449626 |
| M2 | -0.0903743560875964 | 0.091278 | -0.9901 | 0.32839 | 0.164195 |
| M3 | 0.0488973179489897 | 0.091626 | 0.5337 | 0.596682 | 0.298341 |
| M4 | -0.0144921933048258 | 0.092508 | -0.1567 | 0.876344 | 0.438172 |
| M5 | -0.0978713441555035 | 0.091328 | -1.0717 | 0.290636 | 0.145318 |
| M6 | 0.0190056749325876 | 0.092397 | 0.2057 | 0.838127 | 0.419063 |
| M7 | -0.0414326074099239 | 0.091657 | -0.452 | 0.65381 | 0.326905 |
| M8 | 0.0444449825289134 | 0.090965 | 0.4886 | 0.627939 | 0.313969 |
| M9 | -0.0775862591018103 | 0.095506 | -0.8124 | 0.421641 | 0.210821 |
| M10 | -0.0350555474036831 | 0.095754 | -0.3661 | 0.716321 | 0.358161 |
| M11 | 0.00144550210597445 | 0.095608 | 0.0151 | 0.988016 | 0.494008 |
| t | -0.00620621971200828 | 0.00226 | -2.7463 | 0.009159 | 0.004579 |
| Multiple Linear Regression - Regression Statistics | |
| Multiple R | 0.985809336202448 |
| R-squared | 0.971820047343912 |
| Adjusted R-squared | 0.95921322641882 |
| F-TEST (value) | 77.0868447420907 |
| F-TEST (DF numerator) | 17 |
| F-TEST (DF denominator) | 38 |
| p-value | 0 |
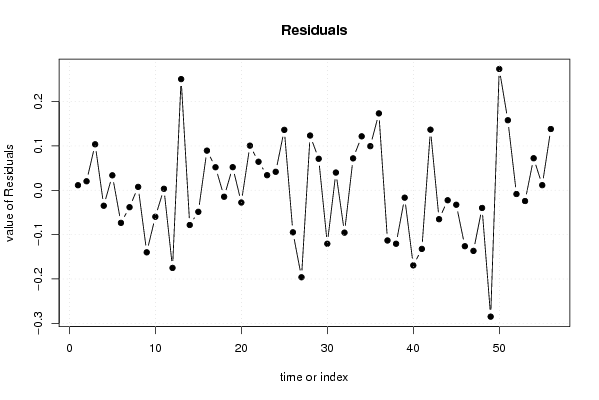
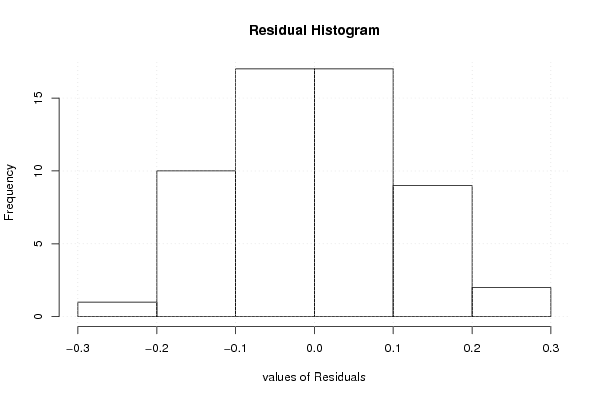
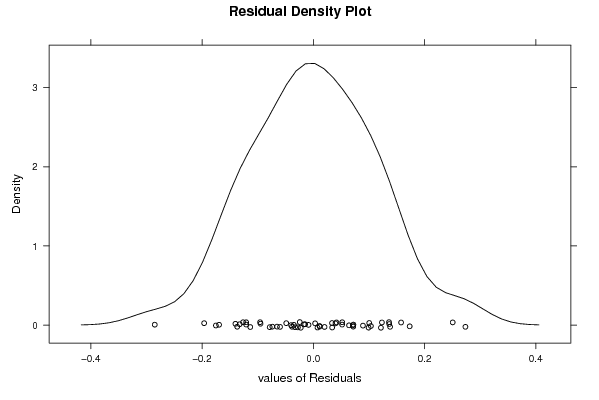
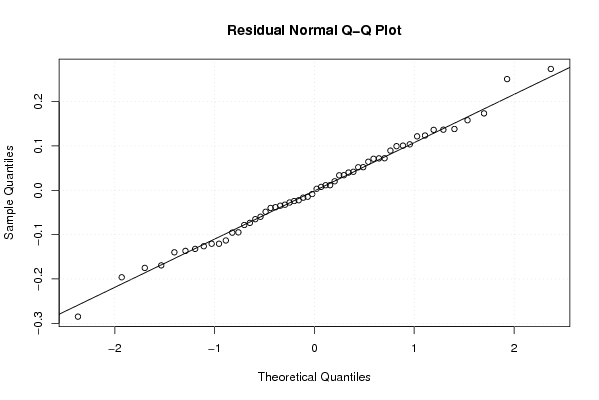
| Multiple Linear Regression - Residual Statistics | |
| Residual Standard Deviation | 0.134663370271501 |
| Sum Squared Residuals | 0.689100485129412 |
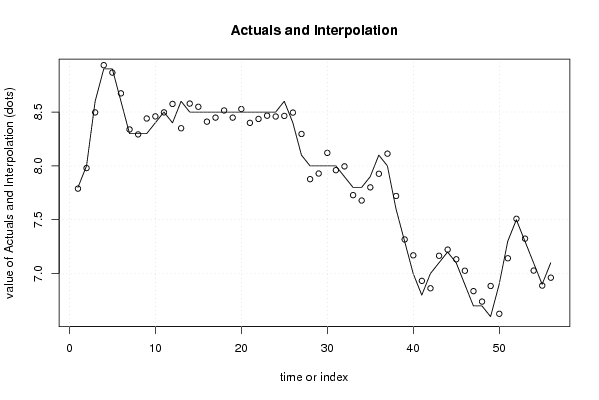
| Multiple Linear Regression - Actuals, Interpolation, and Residuals | |||
| Time or Index | Actuals | Interpolation Forecast | Residuals Prediction Error |
| 1 | 7.8 | 7.78867509118724 | 0.0113249088127546 |
| 2 | 8 | 7.97975625215236 | 0.0202437478476421 |
| 3 | 8.6 | 8.49639311376899 | 0.103606886231010 |
| 4 | 8.9 | 8.93487721053583 | -0.0348772105358308 |
| 5 | 8.9 | 8.86630687965467 | 0.0336931203453313 |
| 6 | 8.6 | 8.67353674832066 | -0.0735367483206594 |
| 7 | 8.3 | 8.33821811227626 | -0.0382181122762552 |
| 8 | 8.3 | 8.29239082681068 | 0.00760917318932146 |
| 9 | 8.3 | 8.43989844042397 | -0.139898440423967 |
| 10 | 8.4 | 8.4597289226113 | -0.0597289226113085 |
| 11 | 8.5 | 8.49670006923281 | 0.00329993076718614 |
| 12 | 8.4 | 8.57507109819848 | -0.175071098198482 |
| 13 | 8.6 | 8.3493518757681 | 0.250648124231894 |
| 14 | 8.5 | 8.57833635714894 | -0.07833635714894 |
| 15 | 8.5 | 8.54859130043305 | -0.0485913004330537 |
| 16 | 8.5 | 8.41064514203995 | 0.0893548579600474 |
| 17 | 8.5 | 8.44813136486955 | 0.0518686351304466 |
| 18 | 8.5 | 8.51461229869279 | -0.0146122986927875 |
| 19 | 8.5 | 8.44796779663827 | 0.0520322033617322 |
| 20 | 8.5 | 8.5276391668651 | -0.0276391668650969 |
| 21 | 8.5 | 8.39940170552237 | 0.100598294477635 |
| 22 | 8.5 | 8.43572619750848 | 0.0642738024915162 |
| 23 | 8.5 | 8.46602102730613 | 0.0339789726938670 |
| 24 | 8.5 | 8.45836930548815 | 0.0416306945118497 |
| 25 | 8.6 | 8.46381102152552 | 0.136188978474484 |
| 26 | 8.4 | 8.49482842345894 | -0.0948284234589384 |
| 27 | 8.1 | 8.29617888811996 | -0.196178888119964 |
| 28 | 8 | 7.87659987981784 | 0.123400120182156 |
| 29 | 8 | 7.92901167399504 | 0.0709883260049633 |
| 30 | 8 | 8.12060149182394 | -0.120601491823942 |
| 31 | 8 | 7.96007925539747 | 0.0399207446025346 |
| 32 | 7.9 | 7.99556076007145 | -0.0955607600714455 |
| 33 | 7.8 | 7.72807738524631 | 0.0719226147536874 |
| 34 | 7.8 | 7.67837912644878 | 0.121620873551221 |
| 35 | 7.9 | 7.80058898123177 | 0.0994110187682314 |
| 36 | 8.1 | 7.92668516962993 | 0.173314830370070 |
| 37 | 8 | 8.1132056843805 | -0.113205684380498 |
| 38 | 7.6 | 7.72059307166503 | -0.120593071665028 |
| 39 | 7.3 | 7.31670417573842 | -0.0167041757384182 |
| 40 | 7 | 7.16933494851268 | -0.169334948512678 |
| 41 | 6.8 | 6.93225890919255 | -0.132258909192549 |
| 42 | 7 | 6.86342349434845 | 0.136576505651547 |
| 43 | 7.1 | 7.16522313485746 | -0.065223134857462 |
| 44 | 7.2 | 7.22250822108382 | -0.0225082210838241 |
| 45 | 7.1 | 7.13262246880736 | -0.0326224688073557 |
| 46 | 6.9 | 7.02616575343143 | -0.126165753431428 |
| 47 | 6.7 | 6.83668992222928 | -0.136689922229285 |
| 48 | 6.7 | 6.73987442668344 | -0.0398744266834375 |
| 49 | 6.6 | 6.88495632713863 | -0.284956327138635 |
| 50 | 6.9 | 6.62648589557474 | 0.273514104425264 |
| 51 | 7.3 | 7.14213252193957 | 0.157867478060426 |
| 52 | 7.5 | 7.50854281909369 | -0.0085428190936946 |
| 53 | 7.3 | 7.3242911722882 | -0.0242911722881923 |
| 54 | 7.1 | 7.02782596681416 | 0.072174033185842 |
| 55 | 6.9 | 6.88851170083055 | 0.0114882991694502 |
| 56 | 7.1 | 6.96190102516896 | 0.138098974831045 |
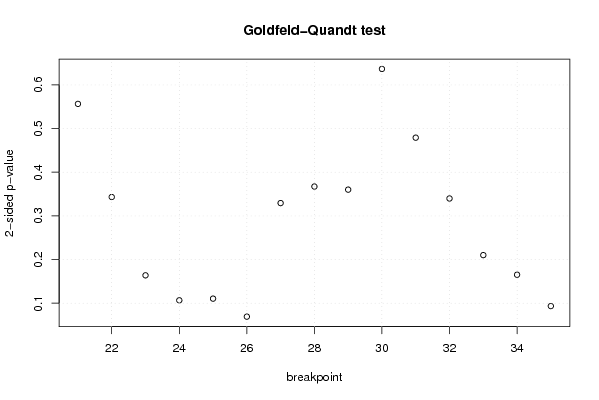
| Goldfeld-Quandt test for Heteroskedasticity | |||
| p-values | Alternative Hypothesis | ||
| breakpoint index | greater | 2-sided | less |
| 21 | 0.278221590987648 | 0.556443181975296 | 0.721778409012352 |
| 22 | 0.17158855835535 | 0.3431771167107 | 0.82841144164465 |
| 23 | 0.0819441977041649 | 0.163888395408330 | 0.918055802295835 |
| 24 | 0.0533285166655058 | 0.106657033331012 | 0.946671483334494 |
| 25 | 0.0552321289528983 | 0.110464257905797 | 0.944767871047102 |
| 26 | 0.0346061898081901 | 0.0692123796163802 | 0.96539381019181 |
| 27 | 0.164656486418927 | 0.329312972837854 | 0.835343513581073 |
| 28 | 0.183594429788114 | 0.367188859576229 | 0.816405570211886 |
| 29 | 0.180048508947094 | 0.360097017894188 | 0.819951491052906 |
| 30 | 0.318247792912090 | 0.636495585824179 | 0.68175220708791 |
| 31 | 0.239547552620547 | 0.479095105241094 | 0.760452447379453 |
| 32 | 0.169925244044864 | 0.339850488089729 | 0.830074755955136 |
| 33 | 0.105051802789158 | 0.210103605578316 | 0.894948197210842 |
| 34 | 0.0826147801972288 | 0.165229560394458 | 0.917385219802771 |
| 35 | 0.0467209952560467 | 0.0934419905120934 | 0.953279004743953 |
| Meta Analysis of Goldfeld-Quandt test for Heteroskedasticity | |||
| Description | # significant tests | % significant tests | OK/NOK |
| 1% type I error level | 0 | 0 | OK |
| 5% type I error level | 0 | 0 | OK |
| 10% type I error level | 2 | 0.133333333333333 | NOK |