| Multiple Linear Regression - Estimated Regression Equation |
| inflatie[t] = + 0.959584165715367 + 0.100154534940552inflatie_levensmiddelen[t] + 0.0190340617400944t + e[t] |
| Multiple Linear Regression - Ordinary Least Squares | |||||
| Variable | Parameter | S.D. | T-STAT H0: parameter = 0 | 2-tail p-value | 1-tail p-value |
| (Intercept) | 0.959584165715367 | 0.062711 | 15.3017 | 0 | 0 |
| inflatie_levensmiddelen | 0.100154534940552 | 0.013508 | 7.4142 | 0 | 0 |
| t | 0.0190340617400944 | 0.001952 | 9.75 | 0 | 0 |
| Multiple Linear Regression - Regression Statistics | |
| Multiple R | 0.915662322330004 |
| R-squared | 0.838437488534777 |
| Adjusted R-squared | 0.83266739883959 |
| F-TEST (value) | 145.307531221605 |
| F-TEST (DF numerator) | 2 |
| F-TEST (DF denominator) | 56 |
| p-value | 0 |
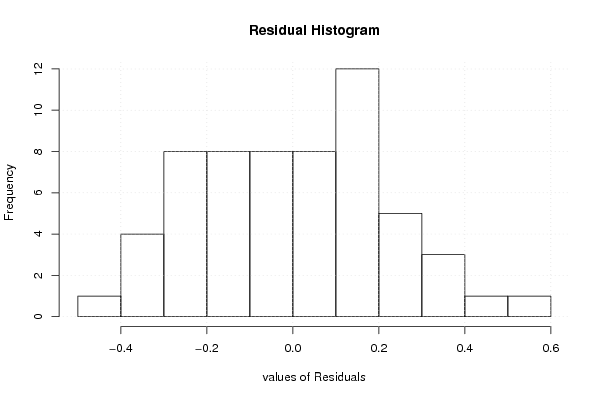
| Multiple Linear Regression - Residual Statistics | |
| Residual Standard Deviation | 0.222614569674175 |
| Sum Squared Residuals | 2.77520581134822 |
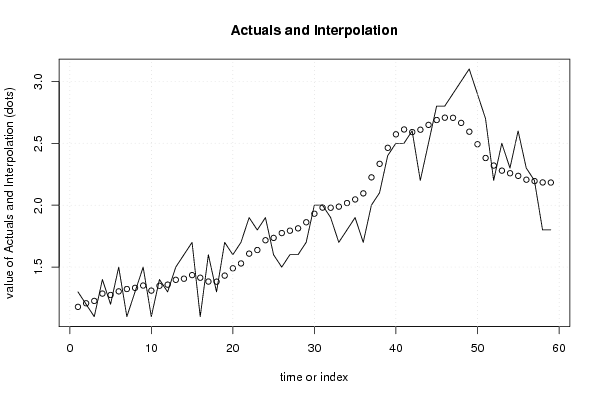
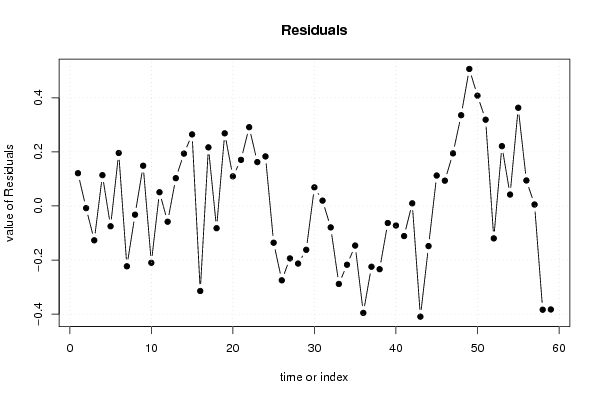
| Multiple Linear Regression - Actuals, Interpolation, and Residuals | |||
| Time or Index | Actuals | Interpolation Forecast | Residuals Prediction Error |
| 1 | 1.3 | 1.17892729733656 | 0.121072702663439 |
| 2 | 1.2 | 1.20797681257071 | -0.00797681257071426 |
| 3 | 1.1 | 1.22701087431081 | -0.127010874310808 |
| 4 | 1.4 | 1.28610675002712 | 0.113893249972877 |
| 5 | 1.2 | 1.27509445128505 | -0.0750944512850522 |
| 6 | 1.5 | 1.30414396651920 | 0.195856033480798 |
| 7 | 1.1 | 1.32317802825930 | -0.223178028259296 |
| 8 | 1.3 | 1.33219663650534 | -0.0321966365053355 |
| 9 | 1.5 | 1.35123069824543 | 0.14876930175457 |
| 10 | 1.1 | 1.31017203902119 | -0.210172039021193 |
| 11 | 1.4 | 1.34923700774940 | 0.0507629922506017 |
| 12 | 1.3 | 1.35825561599544 | -0.0582556159954374 |
| 13 | 1.5 | 1.39732058472364 | 0.102679415276358 |
| 14 | 1.6 | 1.40633919296968 | 0.193660807030319 |
| 15 | 1.7 | 1.43538870820383 | 0.264611291796169 |
| 16 | 1.1 | 1.41436095596770 | -0.314360955967705 |
| 17 | 1.6 | 1.38331775023752 | 0.216682249762477 |
| 18 | 1.3 | 1.38232090498951 | -0.0823209049895077 |
| 19 | 1.7 | 1.43140132721177 | 0.268598672788232 |
| 20 | 1.6 | 1.49049720292808 | 0.109502797071918 |
| 21 | 1.7 | 1.52956217165629 | 0.170437828343713 |
| 22 | 1.9 | 1.60868895436071 | 0.291311045639287 |
| 23 | 1.8 | 1.63773846959486 | 0.162261530405138 |
| 24 | 1.9 | 1.71686525229929 | 0.183134747700712 |
| 25 | 1.6 | 1.73589931403938 | -0.135899314039382 |
| 26 | 1.5 | 1.77496428276759 | -0.274964282767587 |
| 27 | 1.6 | 1.79399834450768 | -0.193998344507681 |
| 28 | 1.6 | 1.81303240624778 | -0.213032406247776 |
| 29 | 1.7 | 1.86211282847004 | -0.162112828470036 |
| 30 | 2 | 1.93122415768041 | 0.0687758423195941 |
| 31 | 2 | 1.98030457990267 | 0.0196954200973343 |
| 32 | 1.9 | 1.97930773465465 | -0.07930773465465 |
| 33 | 1.7 | 1.98832634290069 | -0.288326342900689 |
| 34 | 1.8 | 2.01737585813484 | -0.217375858134839 |
| 35 | 1.9 | 2.04642537336899 | -0.146425373368988 |
| 36 | 1.7 | 2.09550579559125 | -0.395505795591248 |
| 37 | 2 | 2.22470984576595 | -0.224709845765949 |
| 38 | 2.1 | 2.33388298895254 | -0.23388298895254 |
| 39 | 2.4 | 2.46308703912724 | -0.0630870391272415 |
| 40 | 2.5 | 2.57226018231383 | -0.0722601823138322 |
| 41 | 2.5 | 2.61132515104204 | -0.111325151042037 |
| 42 | 2.6 | 2.59029739880591 | 0.0097026011940892 |
| 43 | 2.2 | 2.60933146054601 | -0.409331460546005 |
| 44 | 2.5 | 2.64839642927421 | -0.14839642927421 |
| 45 | 2.8 | 2.68746139800241 | 0.112538601997585 |
| 46 | 2.8 | 2.70649545974251 | 0.0935045402574906 |
| 47 | 2.9 | 2.70549861449449 | 0.194501385505507 |
| 48 | 3 | 2.66443995527026 | 0.335560044729743 |
| 49 | 3.1 | 2.59333493556385 | 0.506665064436145 |
| 50 | 2.9 | 2.49218355537529 | 0.407816444624713 |
| 51 | 2.7 | 2.38101672169266 | 0.318983278307335 |
| 52 | 2.2 | 2.31992715548032 | -0.119927155480318 |
| 53 | 2.5 | 2.27886849625608 | 0.221131503743919 |
| 54 | 2.3 | 2.25784074401996 | 0.0421592559800446 |
| 55 | 2.6 | 2.23681299178383 | 0.363187008216171 |
| 56 | 2.3 | 2.20576978605365 | 0.0942302139463522 |
| 57 | 2.2 | 2.19475748731158 | 0.00524251268842362 |
| 58 | 1.8 | 2.18374518856951 | -0.383745188569506 |
| 59 | 1.8 | 2.18274834332149 | -0.38274834332149 |
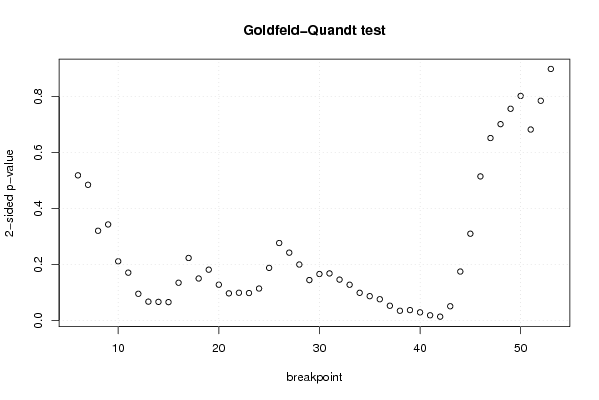
| Goldfeld-Quandt test for Heteroskedasticity | |||
| p-values | Alternative Hypothesis | ||
| breakpoint index | greater | 2-sided | less |
| 6 | 0.25929306417549 | 0.51858612835098 | 0.74070693582451 |
| 7 | 0.242322466874788 | 0.484644933749577 | 0.757677533125212 |
| 8 | 0.160258027060674 | 0.320516054121347 | 0.839741972939326 |
| 9 | 0.171541430802931 | 0.343082861605863 | 0.828458569197069 |
| 10 | 0.105780860271368 | 0.211561720542735 | 0.894219139728633 |
| 11 | 0.0854793044867962 | 0.170958608973592 | 0.914520695513204 |
| 12 | 0.0477414462325029 | 0.0954828924650058 | 0.952258553767497 |
| 13 | 0.0336929873574873 | 0.0673859747149746 | 0.966307012642513 |
| 14 | 0.0333157112530174 | 0.0666314225060348 | 0.966684288746983 |
| 15 | 0.0328705806565173 | 0.0657411613130346 | 0.967129419343483 |
| 16 | 0.0674767473812628 | 0.134953494762526 | 0.932523252618737 |
| 17 | 0.111685538938559 | 0.223371077877118 | 0.88831446106144 |
| 18 | 0.0750779515437256 | 0.150155903087451 | 0.924922048456274 |
| 19 | 0.090807553765976 | 0.181615107531952 | 0.909192446234024 |
| 20 | 0.0639879141552076 | 0.127975828310415 | 0.936012085844792 |
| 21 | 0.0485583105933667 | 0.0971166211867334 | 0.951441689406633 |
| 22 | 0.0495598477379888 | 0.0991196954759776 | 0.950440152262011 |
| 23 | 0.0490724072499492 | 0.0981448144998984 | 0.95092759275005 |
| 24 | 0.0571349647202054 | 0.114269929440411 | 0.942865035279794 |
| 25 | 0.0940045169983884 | 0.188009033996777 | 0.905995483001612 |
| 26 | 0.138417405786565 | 0.27683481157313 | 0.861582594213435 |
| 27 | 0.121191132309916 | 0.242382264619831 | 0.878808867690084 |
| 28 | 0.099999997397911 | 0.199999994795822 | 0.900000002602089 |
| 29 | 0.0722428044812449 | 0.144485608962490 | 0.927757195518755 |
| 30 | 0.0830096818070654 | 0.166019363614131 | 0.916990318192935 |
| 31 | 0.0841165643256958 | 0.168233128651392 | 0.915883435674304 |
| 32 | 0.0730364014695299 | 0.146072802939060 | 0.92696359853047 |
| 33 | 0.0639237541946296 | 0.127847508389259 | 0.936076245805370 |
| 34 | 0.0494944415731385 | 0.098988883146277 | 0.950505558426862 |
| 35 | 0.0435185144107959 | 0.0870370288215918 | 0.956481485589204 |
| 36 | 0.0380633942046760 | 0.0761267884093519 | 0.961936605795324 |
| 37 | 0.0263912830287878 | 0.0527825660575756 | 0.973608716971212 |
| 38 | 0.0174392904735185 | 0.034878580947037 | 0.982560709526481 |
| 39 | 0.0186579609833672 | 0.0373159219667344 | 0.981342039016633 |
| 40 | 0.0146686128188381 | 0.0293372256376761 | 0.985331387181162 |
| 41 | 0.00935960989957256 | 0.0187192197991451 | 0.990640390100427 |
| 42 | 0.00692999075154457 | 0.0138599815030891 | 0.993070009248455 |
| 43 | 0.0254771136451331 | 0.0509542272902663 | 0.974522886354867 |
| 44 | 0.087463354215926 | 0.174926708431852 | 0.912536645784074 |
| 45 | 0.155032989780642 | 0.310065979561284 | 0.844967010219358 |
| 46 | 0.257363384014198 | 0.514726768028397 | 0.742636615985802 |
| 47 | 0.325835012138087 | 0.651670024276175 | 0.674164987861913 |
| 48 | 0.350651936358433 | 0.701303872716865 | 0.649348063641567 |
| 49 | 0.378135879234983 | 0.756271758469966 | 0.621864120765017 |
| 50 | 0.401094660529423 | 0.802189321058846 | 0.598905339470577 |
| 51 | 0.65897257958141 | 0.682054840837181 | 0.341027420418591 |
| 52 | 0.607616958378256 | 0.784766083243489 | 0.392383041621744 |
| 53 | 0.449228782028347 | 0.898457564056693 | 0.550771217971653 |
| Meta Analysis of Goldfeld-Quandt test for Heteroskedasticity | |||
| Description | # significant tests | % significant tests | OK/NOK |
| 1% type I error level | 0 | 0 | OK |
| 5% type I error level | 5 | 0.104166666666667 | NOK |
| 10% type I error level | 17 | 0.354166666666667 | NOK |