| Multiple Linear Regression - Estimated Regression Equation |
| Y[t] = + 1219.03242808287 + 3.60792597062968X[t] + 141.869234895728M1[t] -90.4173137531013M2[t] + 879.025648762825M3[t] + 341.574344531617M4[t] + 343.009381076913M5[t] + 399.130758398712M6[t] + 303.20896533226M7[t] + 449.295098236438M8[t] -183.026694830014M9[t] + 159.537852880037M10[t] + 206.721793066452M11[t] -7.97247368068132t + e[t] |
| Multiple Linear Regression - Ordinary Least Squares | |||||
| Variable | Parameter | S.D. | T-STAT H0: parameter = 0 | 2-tail p-value | 1-tail p-value |
| (Intercept) | 1219.03242808287 | 1238.875109 | 0.984 | 0.330271 | 0.165136 |
| X | 3.60792597062968 | 3.807662 | 0.9475 | 0.348313 | 0.174157 |
| M1 | 141.869234895728 | 105.916484 | 1.3394 | 0.187007 | 0.093503 |
| M2 | -90.4173137531013 | 105.36043 | -0.8582 | 0.395247 | 0.197624 |
| M3 | 879.025648762825 | 105.377042 | 8.3417 | 0 | 0 |
| M4 | 341.574344531617 | 104.718085 | 3.2618 | 0.002089 | 0.001045 |
| M5 | 343.009381076913 | 104.46064 | 3.2836 | 0.001963 | 0.000981 |
| M6 | 399.130758398712 | 104.393318 | 3.8233 | 0.000394 | 0.000197 |
| M7 | 303.20896533226 | 104.265455 | 2.908 | 0.005582 | 0.002791 |
| M8 | 449.295098236438 | 104.365828 | 4.305 | 8.7e-05 | 4.3e-05 |
| M9 | -183.026694830014 | 104.250564 | -1.7556 | 0.085807 | 0.042903 |
| M10 | 159.537852880037 | 104.368433 | 1.5286 | 0.133211 | 0.066605 |
| M11 | 206.721793066452 | 103.985934 | 1.988 | 0.052785 | 0.026392 |
| t | -7.97247368068132 | 6.056208 | -1.3164 | 0.194557 | 0.097279 |
| Multiple Linear Regression - Regression Statistics | |
| Multiple R | 0.88502400689593 |
| R-squared | 0.783267492782127 |
| Adjusted R-squared | 0.722017001611859 |
| F-TEST (value) | 12.7879381506467 |
| F-TEST (DF numerator) | 13 |
| F-TEST (DF denominator) | 46 |
| p-value | 3.25499627251702e-11 |
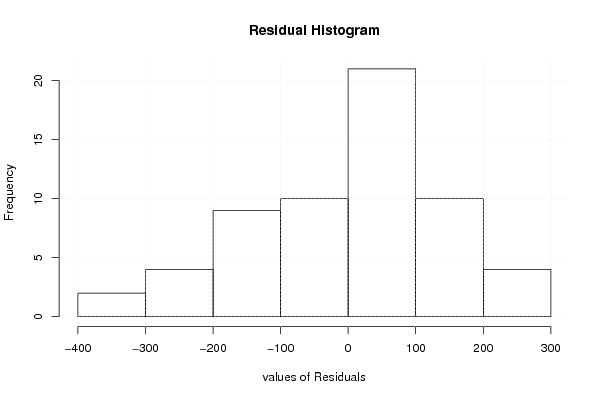
| Multiple Linear Regression - Residual Statistics | |
| Residual Standard Deviation | 164.397756950770 |
| Sum Squared Residuals | 1243224.63456045 |
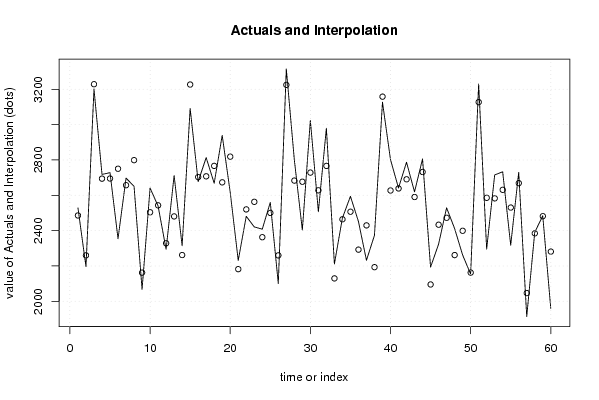
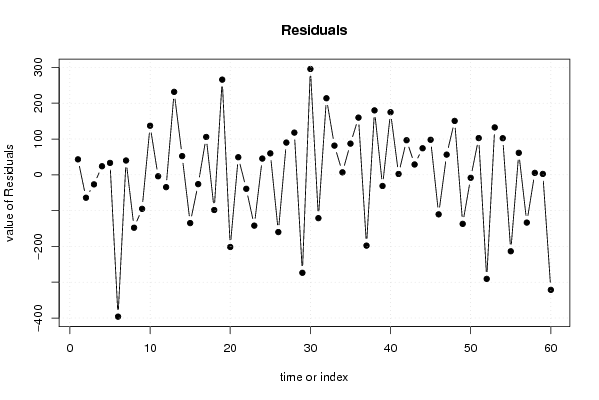
| Multiple Linear Regression - Actuals, Interpolation, and Residuals | |||
| Time or Index | Actuals | Interpolation Forecast | Residuals Prediction Error |
| 1 | 2529 | 2485.81794407564 | 43.182055924359 |
| 2 | 2196 | 2259.99062562865 | -63.9906256286457 |
| 3 | 3202 | 3228.67696640515 | -26.6769664051491 |
| 4 | 2718 | 2694.07696640515 | 23.92303359485 |
| 5 | 2728 | 2694.75538121102 | 33.2446187889761 |
| 6 | 2354 | 2750.1201367934 | -396.120136793402 |
| 7 | 2697 | 2657.04964795816 | 39.950352041843 |
| 8 | 2651 | 2798.77123315228 | -147.771233152283 |
| 9 | 2067 | 2162.08489237578 | -95.084892375779 |
| 10 | 2641 | 2503.89281834641 | 137.107181653591 |
| 11 | 2539 | 2543.10428485214 | -4.10428485214211 |
| 12 | 2294 | 2328.41001810501 | -34.4100181050085 |
| 13 | 2712 | 2480.34640917320 | 231.653590826796 |
| 14 | 2314 | 2261.73494266747 | 52.2650573325285 |
| 15 | 3092 | 3226.81335747335 | -134.813357473346 |
| 16 | 2677 | 2703.03713538523 | -26.0371353852344 |
| 17 | 2813 | 2707.32347616174 | 105.676523838262 |
| 18 | 2668 | 2766.29615771475 | -98.2961577147456 |
| 19 | 2939 | 2673.2256688795 | 265.774331120499 |
| 20 | 2617 | 2818.55518004426 | -201.555180044257 |
| 21 | 2231 | 2181.86883926775 | 49.1311607322468 |
| 22 | 2481 | 2520.06883926775 | -39.0688392677533 |
| 23 | 2421 | 2562.88823174412 | -141.888231744116 |
| 24 | 2408 | 2362.6256688795 | 45.3743311204986 |
| 25 | 2560 | 2500.13035606518 | 59.8696439348223 |
| 26 | 2100 | 2259.87133373567 | -159.871333735667 |
| 27 | 3315 | 3224.94974854154 | 90.0502514584587 |
| 28 | 2801 | 2683.13389660028 | 117.866103399718 |
| 29 | 2403 | 2676.59645946490 | -273.596459464896 |
| 30 | 3024 | 2728.35328907664 | 295.646710923355 |
| 31 | 2507 | 2628.06694830014 | -121.066948300141 |
| 32 | 2980 | 2766.18060752364 | 213.819392476363 |
| 33 | 2211 | 2129.49426674713 | 81.5057332528665 |
| 34 | 2471 | 2464.08634077650 | 6.9136592234963 |
| 35 | 2594 | 2506.90573325287 | 87.0942667471334 |
| 36 | 2452 | 2292.21146650573 | 159.788533494267 |
| 37 | 2232 | 2429.71615369141 | -197.716153691409 |
| 38 | 2373 | 2193.06505733253 | 179.934942667471 |
| 39 | 3127 | 3158.1434721384 | -31.1434721384029 |
| 40 | 2802 | 2627.15139810903 | 174.848601890968 |
| 41 | 2641 | 2638.65359082680 | 2.34640917320456 |
| 42 | 2787 | 2690.41042043854 | 96.5895795614564 |
| 43 | 2619 | 2590.12407966204 | 28.8759203379601 |
| 44 | 2806 | 2731.84566485617 | 74.1543351438341 |
| 45 | 2193 | 2095.15932407966 | 97.840675920338 |
| 46 | 2323 | 2433.35932407966 | -110.359324079662 |
| 47 | 2529 | 2472.57079058540 | 56.4292094146048 |
| 48 | 2412 | 2261.48444980889 | 150.515550191108 |
| 49 | 2262 | 2398.98913699457 | -136.989136994568 |
| 50 | 2154 | 2162.33804063569 | -8.338040635687 |
| 51 | 3230 | 3127.41645544156 | 102.583544558439 |
| 52 | 2295 | 2585.6006035003 | -290.600603500302 |
| 53 | 2715 | 2582.67109233555 | 132.328907664454 |
| 54 | 2733 | 2630.81999597666 | 102.180004023336 |
| 55 | 2317 | 2530.53365520016 | -213.533655200161 |
| 56 | 2730 | 2668.64731442366 | 61.352685576343 |
| 57 | 1913 | 2046.39267752967 | -133.392677529672 |
| 58 | 2390 | 2384.59267752967 | 5.407322470328 |
| 59 | 2484 | 2481.53095956548 | 2.46904043451999 |
| 60 | 1960 | 2281.26839670087 | -321.268396700865 |
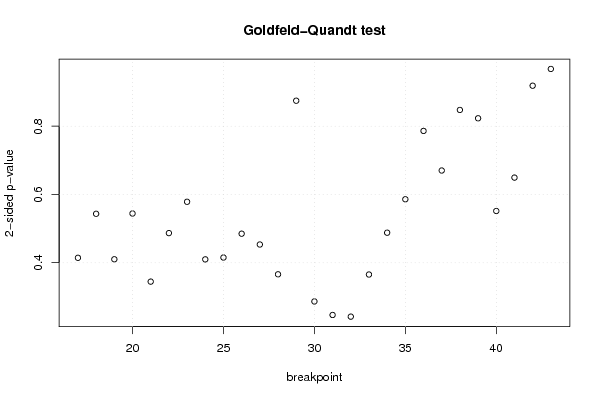
| Goldfeld-Quandt test for Heteroskedasticity | |||
| p-values | Alternative Hypothesis | ||
| breakpoint index | greater | 2-sided | less |
| 17 | 0.207156993390945 | 0.414313986781891 | 0.792843006609055 |
| 18 | 0.271657818398231 | 0.543315636796463 | 0.728342181601769 |
| 19 | 0.205038652327296 | 0.410077304654592 | 0.794961347672704 |
| 20 | 0.272101342788480 | 0.544202685576961 | 0.72789865721152 |
| 21 | 0.172253850321008 | 0.344507700642017 | 0.827746149678992 |
| 22 | 0.243378775721128 | 0.486757551442256 | 0.756621224278872 |
| 23 | 0.28926292481579 | 0.57852584963158 | 0.71073707518421 |
| 24 | 0.204907696583617 | 0.409815393167235 | 0.795092303416383 |
| 25 | 0.207554649955512 | 0.415109299911024 | 0.792445350044488 |
| 26 | 0.242505923579627 | 0.485011847159253 | 0.757494076420373 |
| 27 | 0.226666741254722 | 0.453333482509444 | 0.773333258745278 |
| 28 | 0.18298808271442 | 0.36597616542884 | 0.81701191728558 |
| 29 | 0.562667134631599 | 0.874665730736803 | 0.437332865368401 |
| 30 | 0.856752556201363 | 0.286494887597275 | 0.143247443798637 |
| 31 | 0.876601059424375 | 0.246797881151250 | 0.123398940575625 |
| 32 | 0.879061420344476 | 0.241877159311047 | 0.120938579655524 |
| 33 | 0.817320470876678 | 0.365359058246644 | 0.182679529123322 |
| 34 | 0.75606702570207 | 0.48786594859586 | 0.24393297429793 |
| 35 | 0.707056402945614 | 0.585887194108771 | 0.292943597054386 |
| 36 | 0.606921411557687 | 0.786157176884626 | 0.393078588442313 |
| 37 | 0.664926886426022 | 0.670146227147957 | 0.335073113573978 |
| 38 | 0.576196325761579 | 0.847607348476842 | 0.423803674238421 |
| 39 | 0.588404960270117 | 0.823190079459766 | 0.411595039729883 |
| 40 | 0.724214801814022 | 0.551570396371957 | 0.275785198185979 |
| 41 | 0.675317112776742 | 0.649365774446516 | 0.324682887223258 |
| 42 | 0.540677183115028 | 0.918645633769944 | 0.459322816884972 |
| 43 | 0.483889316478553 | 0.967778632957107 | 0.516110683521447 |
| Meta Analysis of Goldfeld-Quandt test for Heteroskedasticity | |||
| Description | # significant tests | % significant tests | OK/NOK |
| 1% type I error level | 0 | 0 | OK |
| 5% type I error level | 0 | 0 | OK |
| 10% type I error level | 0 | 0 | OK |