| Multiple Linear Regression - Estimated Regression Equation |
| Broodprijs[t] = + 0.865076923076913 + 1.03846153846156Bakmeelprijs[t] + 0.00118803418803283M1[t] + 0.0159401709401710M2[t] + 0.0126923076923077M3[t] + 0.0135982905982907M4[t] + 0.00627350427350428M5[t] + 0.00517948717948723M6[t] + 0.00600854700854706M7[t] + 0.00660683760683758M8[t] + 0.00958974358974363M9[t] + 0.0104957264957266M10[t] + 0.00317094017094018M11[t] + 0.00317094017094017t + e[t] |
| Multiple Linear Regression - Ordinary Least Squares | |||||
| Variable | Parameter | S.D. | T-STAT H0: parameter = 0 | 2-tail p-value | 1-tail p-value |
| (Intercept) | 0.865076923076913 | 0.345279 | 2.5054 | 0.015832 | 0.007916 |
| Bakmeelprijs | 1.03846153846156 | 0.67425 | 1.5402 | 0.130369 | 0.065185 |
| M1 | 0.00118803418803283 | 0.020227 | 0.0587 | 0.953418 | 0.476709 |
| M2 | 0.0159401709401710 | 0.020233 | 0.7878 | 0.43483 | 0.217415 |
| M3 | 0.0126923076923077 | 0.020274 | 0.626 | 0.53438 | 0.26719 |
| M4 | 0.0135982905982907 | 0.020141 | 0.6752 | 0.502952 | 0.251476 |
| M5 | 0.00627350427350428 | 0.020259 | 0.3097 | 0.758215 | 0.379107 |
| M6 | 0.00517948717948723 | 0.020105 | 0.2576 | 0.797852 | 0.398926 |
| M7 | 0.00600854700854706 | 0.020083 | 0.2992 | 0.766147 | 0.383074 |
| M8 | 0.00660683760683758 | 0.02037 | 0.3243 | 0.747152 | 0.373576 |
| M9 | 0.00958974358974363 | 0.020062 | 0.478 | 0.634902 | 0.317451 |
| M10 | 0.0104957264957266 | 0.020119 | 0.5217 | 0.60439 | 0.302195 |
| M11 | 0.00317094017094018 | 0.020055 | 0.1581 | 0.875063 | 0.437532 |
| t | 0.00317094017094017 | 0.000586 | 5.4138 | 2e-06 | 1e-06 |
| Multiple Linear Regression - Regression Statistics | |
| Multiple R | 0.927993068953007 |
| R-squared | 0.861171136024821 |
| Adjusted R-squared | 0.821936891857923 |
| F-TEST (value) | 21.9494768998605 |
| F-TEST (DF numerator) | 13 |
| F-TEST (DF denominator) | 46 |
| p-value | 1.88737914186277e-15 |
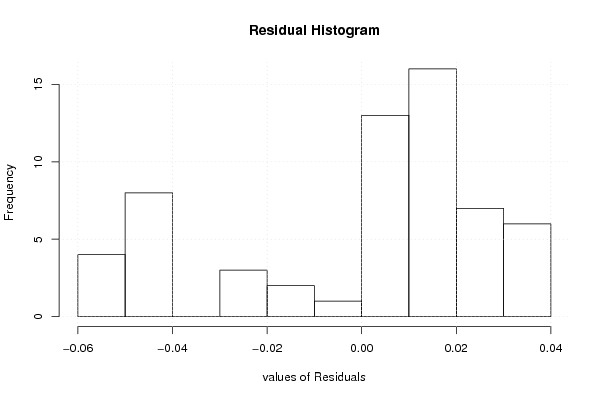
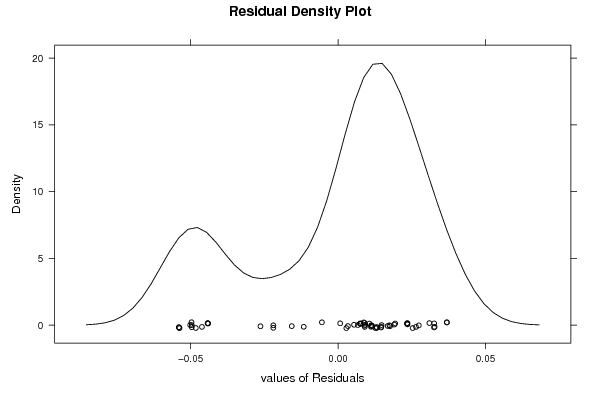
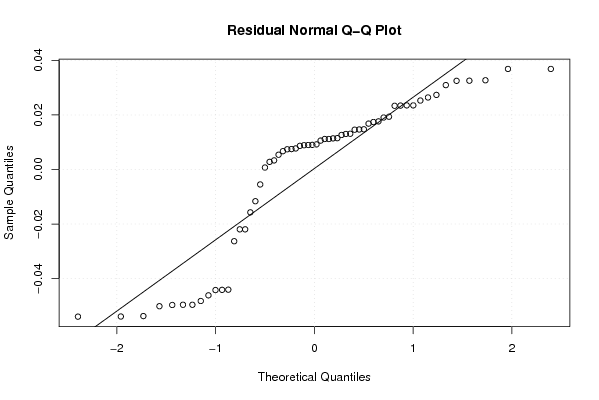
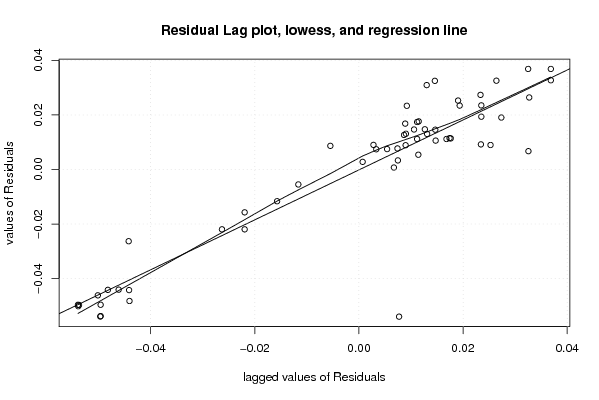
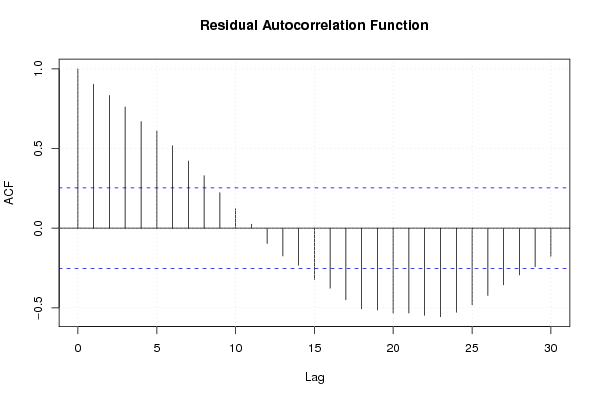
| Multiple Linear Regression - Residual Statistics | |
| Residual Standard Deviation | 0.031696899257175 |
| Sum Squared Residuals | 0.046215897435897 |
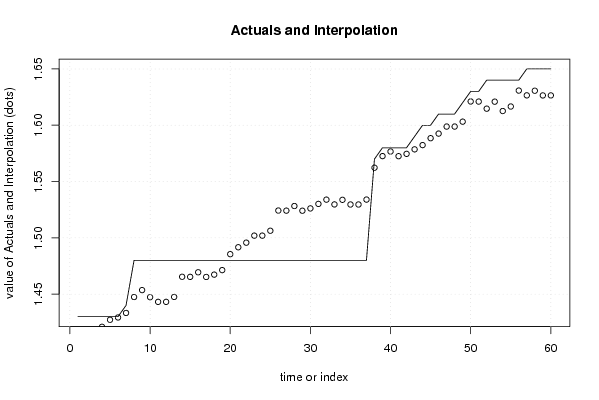
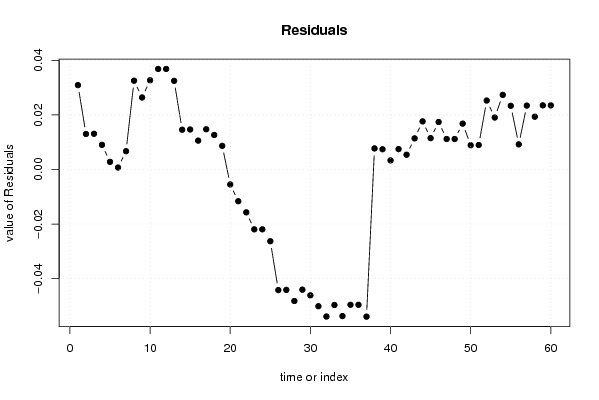
| Multiple Linear Regression - Actuals, Interpolation, and Residuals | |||
| Time or Index | Actuals | Interpolation Forecast | Residuals Prediction Error |
| 1 | 1.43 | 1.39905128205129 | 0.0309487179487123 |
| 2 | 1.43 | 1.41697435897436 | 0.0130256410256412 |
| 3 | 1.43 | 1.41689743589744 | 0.0131025641025644 |
| 4 | 1.43 | 1.42097435897436 | 0.00902564102564134 |
| 5 | 1.43 | 1.42720512820513 | 0.00279487179487202 |
| 6 | 1.43 | 1.42928205128205 | 0.000717948717948887 |
| 7 | 1.44 | 1.43328205128205 | 0.00671794871794893 |
| 8 | 1.48 | 1.44743589743590 | 0.0325641025641027 |
| 9 | 1.48 | 1.45358974358974 | 0.0264102564102565 |
| 10 | 1.48 | 1.44728205128205 | 0.0327179487179489 |
| 11 | 1.48 | 1.44312820512820 | 0.0368717948717951 |
| 12 | 1.48 | 1.44312820512820 | 0.0368717948717951 |
| 13 | 1.48 | 1.44748717948718 | 0.0325128205128222 |
| 14 | 1.48 | 1.46541025641026 | 0.0145897435897438 |
| 15 | 1.48 | 1.46533333333333 | 0.0146666666666669 |
| 16 | 1.48 | 1.46941025641026 | 0.0105897435897438 |
| 17 | 1.48 | 1.46525641025641 | 0.01474358974359 |
| 18 | 1.48 | 1.46733333333333 | 0.0126666666666669 |
| 19 | 1.48 | 1.47133333333333 | 0.0086666666666669 |
| 20 | 1.48 | 1.48548717948718 | -0.00548717948717933 |
| 21 | 1.48 | 1.49164102564103 | -0.0116410256410255 |
| 22 | 1.48 | 1.49571794871795 | -0.0157179487179486 |
| 23 | 1.48 | 1.50194871794872 | -0.0219487179487180 |
| 24 | 1.48 | 1.50194871794872 | -0.0219487179487180 |
| 25 | 1.48 | 1.50630769230769 | -0.0263076923076910 |
| 26 | 1.48 | 1.52423076923077 | -0.0442307692307693 |
| 27 | 1.48 | 1.52415384615385 | -0.0441538461538462 |
| 28 | 1.48 | 1.52823076923077 | -0.0482307692307693 |
| 29 | 1.48 | 1.52407692307692 | -0.0440769230769231 |
| 30 | 1.48 | 1.52615384615385 | -0.0461538461538462 |
| 31 | 1.48 | 1.53015384615385 | -0.0501538461538462 |
| 32 | 1.48 | 1.53392307692308 | -0.0539230769230769 |
| 33 | 1.48 | 1.52969230769231 | -0.0496923076923076 |
| 34 | 1.48 | 1.53376923076923 | -0.0537692307692307 |
| 35 | 1.48 | 1.52961538461538 | -0.0496153846153845 |
| 36 | 1.48 | 1.52961538461538 | -0.0496153846153845 |
| 37 | 1.48 | 1.53397435897436 | -0.0539743589743575 |
| 38 | 1.57 | 1.56228205128205 | 0.0077179487179488 |
| 39 | 1.58 | 1.57258974358974 | 0.0074102564102563 |
| 40 | 1.58 | 1.57666666666667 | 0.00333333333333320 |
| 41 | 1.58 | 1.57251282051282 | 0.0074871794871794 |
| 42 | 1.58 | 1.57458974358974 | 0.00541025641025631 |
| 43 | 1.59 | 1.57858974358974 | 0.0114102564102563 |
| 44 | 1.6 | 1.58235897435897 | 0.0176410256410256 |
| 45 | 1.6 | 1.58851282051282 | 0.0114871794871794 |
| 46 | 1.61 | 1.59258974358974 | 0.0174102564102563 |
| 47 | 1.61 | 1.59882051282051 | 0.011179487179487 |
| 48 | 1.61 | 1.59882051282051 | 0.011179487179487 |
| 49 | 1.62 | 1.60317948717949 | 0.016820512820514 |
| 50 | 1.63 | 1.62110256410256 | 0.00889743589743551 |
| 51 | 1.63 | 1.62102564102564 | 0.00897435897435856 |
| 52 | 1.64 | 1.61471794871795 | 0.025282051282051 |
| 53 | 1.64 | 1.62094871794872 | 0.0190512820512817 |
| 54 | 1.64 | 1.61264102564103 | 0.0273589743589741 |
| 55 | 1.64 | 1.61664102564103 | 0.0233589743589741 |
| 56 | 1.64 | 1.63079487179487 | 0.0092051282051279 |
| 57 | 1.65 | 1.62656410256410 | 0.0234358974358972 |
| 58 | 1.65 | 1.63064102564103 | 0.0193589743589741 |
| 59 | 1.65 | 1.62648717948718 | 0.0235128205128203 |
| 60 | 1.65 | 1.62648717948718 | 0.0235128205128203 |
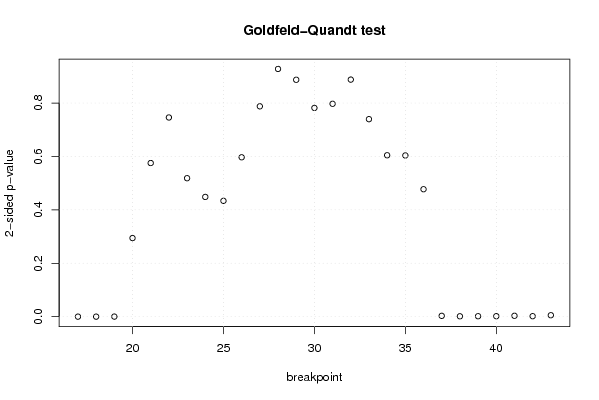
| Goldfeld-Quandt test for Heteroskedasticity | |||
| p-values | Alternative Hypothesis | ||
| breakpoint index | greater | 2-sided | less |
| 17 | 4.14511201567853e-43 | 8.29022403135707e-43 | 1 |
| 18 | 2.56484413468655e-53 | 5.12968826937309e-53 | 1 |
| 19 | 0.000110056797172912 | 0.000220113594345823 | 0.999889943202827 |
| 20 | 0.147155832153032 | 0.294311664306065 | 0.852844167846968 |
| 21 | 0.287686363842397 | 0.575372727684794 | 0.712313636157603 |
| 22 | 0.626980500200978 | 0.746038999598045 | 0.373019499799022 |
| 23 | 0.740719765604403 | 0.518560468791195 | 0.259280234395597 |
| 24 | 0.775755332204643 | 0.448489335590713 | 0.224244667795357 |
| 25 | 0.783082021935597 | 0.433835956128807 | 0.216917978064404 |
| 26 | 0.70155946451634 | 0.596881070967319 | 0.298440535483659 |
| 27 | 0.606055347430421 | 0.787889305139158 | 0.393944652569579 |
| 28 | 0.536086635275976 | 0.927826729448048 | 0.463913364724024 |
| 29 | 0.443624271580076 | 0.887248543160152 | 0.556375728419924 |
| 30 | 0.390931135803982 | 0.781862271607964 | 0.609068864196018 |
| 31 | 0.398643734175648 | 0.797287468351295 | 0.601356265824353 |
| 32 | 0.556034085479068 | 0.887931829041865 | 0.443965914520932 |
| 33 | 0.630128449468049 | 0.739743101063902 | 0.369871550531951 |
| 34 | 0.69774075369005 | 0.6045184926199 | 0.302259246309950 |
| 35 | 0.698099469167313 | 0.603801061665374 | 0.301900530832687 |
| 36 | 0.76135282523991 | 0.477294349520179 | 0.238647174760090 |
| 37 | 0.998480581227661 | 0.00303883754467755 | 0.00151941877233878 |
| 38 | 0.999337300528689 | 0.00132539894262231 | 0.000662699471311155 |
| 39 | 0.999196106023488 | 0.00160778795302498 | 0.000803893976512492 |
| 40 | 0.999135261763755 | 0.00172947647249082 | 0.00086473823624541 |
| 41 | 0.998394765457259 | 0.00321046908548266 | 0.00160523454274133 |
| 42 | 0.99913693920046 | 0.00172612159907782 | 0.000863060799538912 |
| 43 | 0.997334744313351 | 0.0053305113732976 | 0.0026652556866488 |
| Meta Analysis of Goldfeld-Quandt test for Heteroskedasticity | |||
| Description | # significant tests | % significant tests | OK/NOK |
| 1% type I error level | 10 | 0.370370370370370 | NOK |
| 5% type I error level | 10 | 0.370370370370370 | NOK |
| 10% type I error level | 10 | 0.370370370370370 | NOK |