| Multiple Linear Regression - Estimated Regression Equation |
| Y[t] = + 4.14999041251723 -0.0152438597880977X[t] + 1.34171092585125Y1[t] -0.632193949965465Y2[t] + 0.0835740790049867M1[t] + 0.0525149196902091M2[t] -0.176803720858912M3[t] -0.0232878832478820M4[t] -0.105116917657922M5[t] -0.129479933541223M6[t] + 0.0778523659487016M7[t] + 0.310812223645426M8[t] -0.447340912981457M9[t] -0.0193029508698561M10[t] + 0.00728265666300871M11[t] -0.00840207262544193t + e[t] |
| Multiple Linear Regression - Ordinary Least Squares | |||||
| Variable | Parameter | S.D. | T-STAT H0: parameter = 0 | 2-tail p-value | 1-tail p-value |
| (Intercept) | 4.14999041251723 | 0.990631 | 4.1892 | 0.00015 | 7.5e-05 |
| X | -0.0152438597880977 | 0.004999 | -3.0491 | 0.004058 | 0.002029 |
| Y1 | 1.34171092585125 | 0.116031 | 11.5634 | 0 | 0 |
| Y2 | -0.632193949965465 | 0.118245 | -5.3465 | 4e-06 | 2e-06 |
| M1 | 0.0835740790049867 | 0.126953 | 0.6583 | 0.514113 | 0.257056 |
| M2 | 0.0525149196902091 | 0.13346 | 0.3935 | 0.696049 | 0.348025 |
| M3 | -0.176803720858912 | 0.134934 | -1.3103 | 0.197569 | 0.098784 |
| M4 | -0.0232878832478820 | 0.123139 | -0.1891 | 0.850957 | 0.425478 |
| M5 | -0.105116917657922 | 0.11934 | -0.8808 | 0.38368 | 0.19184 |
| M6 | -0.129479933541223 | 0.117649 | -1.1006 | 0.277666 | 0.138833 |
| M7 | 0.0778523659487016 | 0.118305 | 0.6581 | 0.514266 | 0.257133 |
| M8 | 0.310812223645426 | 0.161086 | 1.9295 | 0.060786 | 0.030393 |
| M9 | -0.447340912981457 | 0.161306 | -2.7732 | 0.00839 | 0.004195 |
| M10 | -0.0193029508698561 | 0.13103 | -0.1473 | 0.883622 | 0.441811 |
| M11 | 0.00728265666300871 | 0.128388 | 0.0567 | 0.955048 | 0.477524 |
| t | -0.00840207262544193 | 0.002576 | -3.2615 | 0.002269 | 0.001135 |
| Multiple Linear Regression - Regression Statistics | |
| Multiple R | 0.974568997085734 |
| R-squared | 0.949784730080693 |
| Adjusted R-squared | 0.930954003860953 |
| F-TEST (value) | 50.4380297922358 |
| F-TEST (DF numerator) | 15 |
| F-TEST (DF denominator) | 40 |
| p-value | 0 |
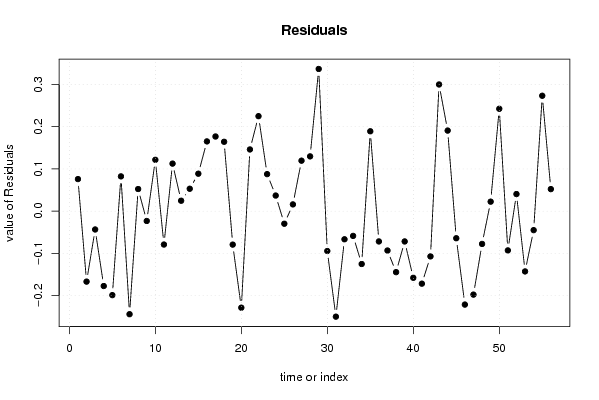
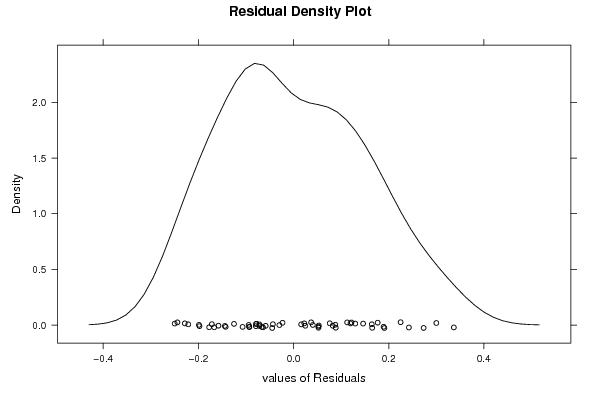
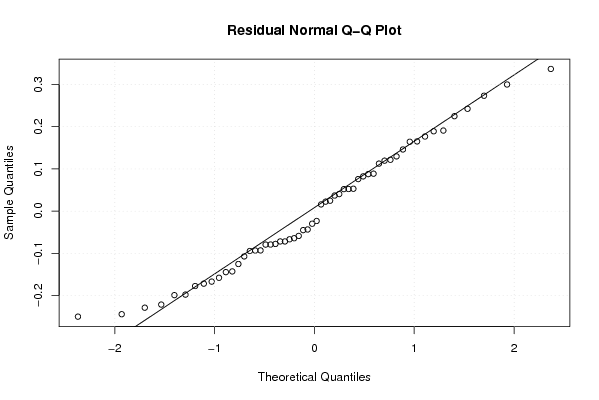
| Multiple Linear Regression - Residual Statistics | |
| Residual Standard Deviation | 0.174779636784900 |
| Sum Squared Residuals | 1.22191685738646 |
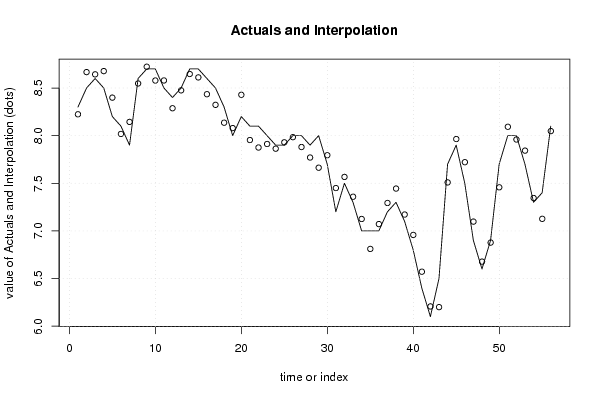
| Multiple Linear Regression - Actuals, Interpolation, and Residuals | |||
| Time or Index | Actuals | Interpolation Forecast | Residuals Prediction Error |
| 1 | 8.3 | 8.22406007107107 | 0.0759399289289281 |
| 2 | 8.5 | 8.6668790122537 | -0.166879012253704 |
| 3 | 8.6 | 8.6434274051257 | -0.0434274051257002 |
| 4 | 8.5 | 8.67737136635616 | -0.177371366356160 |
| 5 | 8.2 | 8.39889608761187 | -0.198896087611866 |
| 6 | 8.1 | 8.01769080047143 | 0.0823091995285654 |
| 7 | 7.9 | 8.14405969752041 | -0.244059697520411 |
| 8 | 8.6 | 8.54763995907805 | 0.0523600409219463 |
| 9 | 8.7 | 8.7232459236311 | -0.0232459236311051 |
| 10 | 8.7 | 8.57842029628652 | 0.121579703713478 |
| 11 | 8.5 | 8.5791160155617 | -0.0791160155616911 |
| 12 | 8.4 | 8.28746717120894 | 0.112532828791058 |
| 13 | 8.5 | 8.47533336732243 | 0.0246666326775733 |
| 14 | 8.7 | 8.64698209677317 | 0.0530179032268333 |
| 15 | 8.7 | 8.61133540181469 | 0.0886645981853136 |
| 16 | 8.6 | 8.43488897151953 | 0.165111028480468 |
| 17 | 8.5 | 8.32329133433085 | 0.176708665669152 |
| 18 | 8.3 | 8.13573331939899 | 0.164266680601011 |
| 19 | 8 | 8.07923601878905 | -0.0792360187890467 |
| 20 | 8.2 | 8.42863282852502 | -0.228632828525016 |
| 21 | 8.1 | 7.95391991774231 | 0.146080082257685 |
| 22 | 8.1 | 7.87514171195593 | 0.224858288044067 |
| 23 | 8 | 7.91233744847442 | 0.0876625515255819 |
| 24 | 7.9 | 7.86309110120229 | 0.0369088987977128 |
| 25 | 7.9 | 7.92981123512445 | -0.0298112351244543 |
| 26 | 8 | 7.98405711775698 | 0.0159428822430233 |
| 27 | 8 | 7.88050749716754 | 0.119492502832462 |
| 28 | 7.9 | 7.77032923382655 | 0.129670766173451 |
| 29 | 8 | 7.6633047545743 | 0.336695245425706 |
| 30 | 7.7 | 7.7943936621134 | -0.0943936621134074 |
| 31 | 7.2 | 7.44984753130667 | -0.249847531306671 |
| 32 | 7.5 | 7.56668260325036 | -0.0666826032503617 |
| 33 | 7.3 | 7.35867711896112 | -0.0586771189611185 |
| 34 | 7 | 7.12519123299974 | -0.125191232999737 |
| 35 | 7 | 6.81089799892892 | 0.189102001071084 |
| 36 | 7 | 7.07176145542226 | -0.071761455422262 |
| 37 | 7.2 | 7.29327451576754 | -0.0932745157675443 |
| 38 | 7.3 | 7.44441178407828 | -0.144411784078277 |
| 39 | 7.1 | 7.17174056608907 | -0.0717405660890719 |
| 40 | 6.8 | 6.95785380328929 | -0.157853803289287 |
| 41 | 6.4 | 6.571731190767 | -0.171731190766996 |
| 42 | 6.1 | 6.20718377669549 | -0.107183776695492 |
| 43 | 6.5 | 6.20007602457482 | 0.299923975425178 |
| 44 | 7.7 | 7.50920706999654 | 0.190792930003459 |
| 45 | 7.9 | 7.96415703966546 | -0.0641570396654613 |
| 46 | 7.5 | 7.72124675875781 | -0.221246758757809 |
| 47 | 6.9 | 7.09764853703497 | -0.197648537034974 |
| 48 | 6.6 | 6.67768027216651 | -0.0776802721665084 |
| 49 | 6.9 | 6.8775208107145 | 0.0224791892854972 |
| 50 | 7.7 | 7.45766998913787 | 0.242330010862125 |
| 51 | 8 | 8.092989129803 | -0.0929891298030035 |
| 52 | 8 | 7.95955662500847 | 0.0404433749915284 |
| 53 | 7.7 | 7.842776632716 | -0.142776632715995 |
| 54 | 7.3 | 7.34499844132068 | -0.0449984413206777 |
| 55 | 7.4 | 7.12678072780905 | 0.273219272190951 |
| 56 | 8.1 | 8.04783753915003 | 0.0521624608499723 |
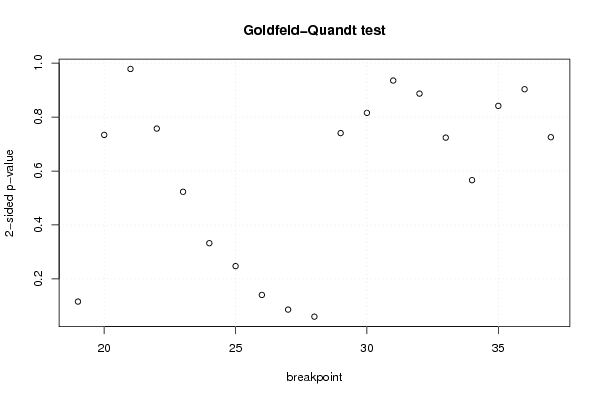
| Goldfeld-Quandt test for Heteroskedasticity | |||
| p-values | Alternative Hypothesis | ||
| breakpoint index | greater | 2-sided | less |
| 19 | 0.0579517813761658 | 0.115903562752332 | 0.942048218623834 |
| 20 | 0.633095328491959 | 0.733809343016082 | 0.366904671508041 |
| 21 | 0.489142159225657 | 0.978284318451313 | 0.510857840774343 |
| 22 | 0.378595869534654 | 0.757191739069307 | 0.621404130465346 |
| 23 | 0.26144365379909 | 0.52288730759818 | 0.73855634620091 |
| 24 | 0.166170751466174 | 0.332341502932348 | 0.833829248533826 |
| 25 | 0.123668340175387 | 0.247336680350774 | 0.876331659824613 |
| 26 | 0.0702743195039103 | 0.140548639007821 | 0.92972568049609 |
| 27 | 0.04308655788192 | 0.08617311576384 | 0.95691344211808 |
| 28 | 0.0300358848603494 | 0.0600717697206987 | 0.96996411513965 |
| 29 | 0.370231502233012 | 0.740463004466024 | 0.629768497766988 |
| 30 | 0.407682545058558 | 0.815365090117116 | 0.592317454941442 |
| 31 | 0.532341696441734 | 0.935316607116532 | 0.467658303558266 |
| 32 | 0.443387063382272 | 0.886774126764544 | 0.556612936617728 |
| 33 | 0.361829756297596 | 0.723659512595192 | 0.638170243702404 |
| 34 | 0.283028299628391 | 0.566056599256783 | 0.716971700371609 |
| 35 | 0.579298503490978 | 0.841402993018044 | 0.420701496509022 |
| 36 | 0.451588126053134 | 0.903176252106268 | 0.548411873946866 |
| 37 | 0.362616537448729 | 0.725233074897457 | 0.637383462551271 |
| Meta Analysis of Goldfeld-Quandt test for Heteroskedasticity | |||
| Description | # significant tests | % significant tests | OK/NOK |
| 1% type I error level | 0 | 0 | OK |
| 5% type I error level | 0 | 0 | OK |
| 10% type I error level | 2 | 0.105263157894737 | NOK |