Free Statistics

of Irreproducible Research!

Author's title

Author*The author of this computation has been verified*
R Software Modulerwasp_multipleregression.wasp
Title produced by softwareMultiple Regression
Date of computationFri, 20 Nov 2009 05:15:49 -0700
Cite this page as followsStatistical Computations at FreeStatistics.org, Office for Research Development and Education, URL https://freestatistics.org/blog/index.php?v=date/2009/Nov/20/t1258719434xnng4d964ufg4wc.htm/, Retrieved Fri, 19 Apr 2024 16:14:27 +0000
Statistical Computations at FreeStatistics.org, Office for Research Development and Education, URL https://freestatistics.org/blog/index.php?pk=58075, Retrieved Fri, 19 Apr 2024 16:14:27 +0000
QR Codes:

Original text written by user:
IsPrivate?No (this computation is public)
User-defined keywords
Estimated Impact185
Family? (F = Feedback message, R = changed R code, M = changed R Module, P = changed Parameters, D = changed Data)
-     [Multiple Regression] [Q1 The Seatbeltlaw] [2007-11-14 19:27:43] [8cd6641b921d30ebe00b648d1481bba0]
- RM D  [Multiple Regression] [Seatbelt] [2009-11-12 14:14:11] [b98453cac15ba1066b407e146608df68]
-    D    [Multiple Regression] [ws 7] [2009-11-19 18:07:30] [b5908418e3090fddbd22f5f0f774653d]
F    D        [Multiple Regression] [workshop 7] [2009-11-20 12:15:49] [ac4f1d4b47349b2602192853b2bc5b72] [Current]
-               [Multiple Regression] [Workshop 7] [2009-11-21 13:52:12] [b6394cb5c2dcec6d17418d3cdf42d699]
Feedback Forum
2009-12-02 19:15:59 [f1e24346ff4ab8a20729561498ad5c34] [reply
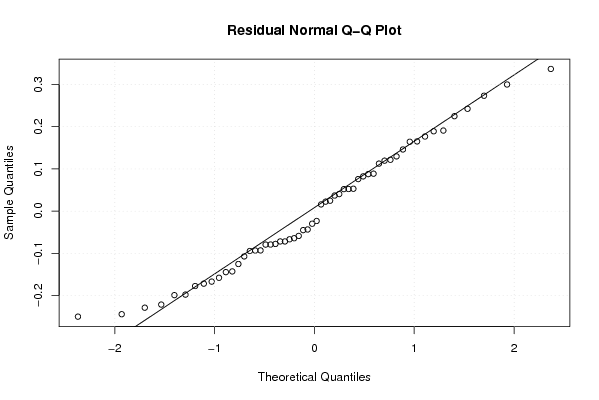
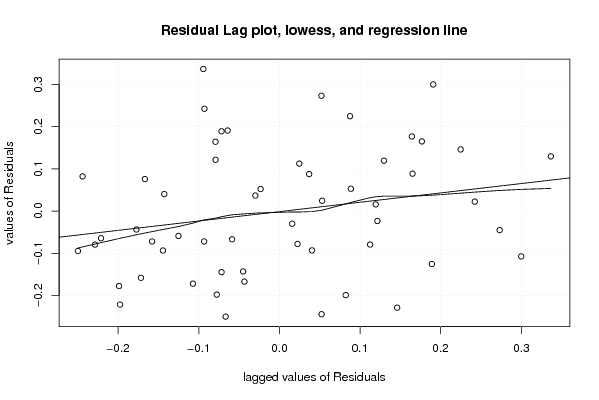
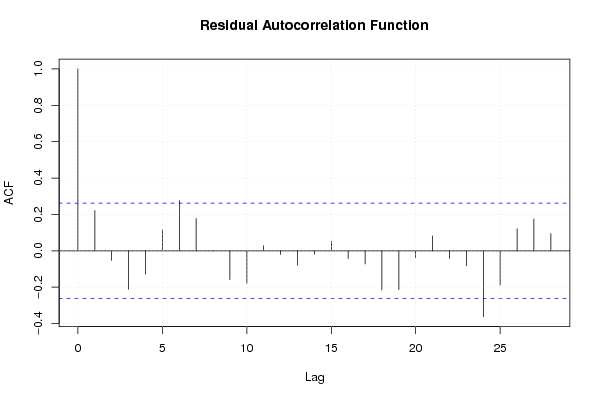
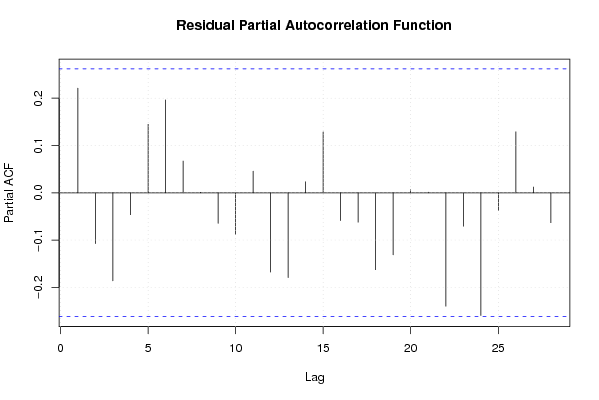
Hieronder schrijf je: 'We zien dat de 2 laatste linken zo goed als hetzelfde zijn. Alleen bij link 1 heb je minder correlatie dan bij link 2. Er is nog maar 1 met autocorrelatie. Dat kan zijn dat het aan het toeval te wijten is maar we hadden er 5% verwacht, het is dus beter dan verwacht.'

Bij de eerste link maak je 4 extra reeksen, Yt-1, Yt-2, Yt-3 en Yt-4. Hierdoor verdwijnt de autocorrelatie en is je model nagenoeg perfect. Dit zie je aan de lags bij de Autocorrelatie Functie.
Bij de tweede link maak je slechts 2 extra reeksen, Yt-1 en Yt-2. Hierdoor verdwijnt de autocorrelatie niet helemaal. Dit zie je dan ook aan de lags bij de ACF.

In de les hebben we dit gedaan om dat bij die reeks het voldoende was om de twee reeksen met vertraging toe te voegen. In jouw geval is het dus nodig om de 4 reeksen te gebruiken.

Post a new message
Dataseries X:
8.3	98.6	8.2	8.7
8.5	96.5	8.3	8.2
8.6	95.9	8.5	8.3
8.5	103.7	8.6	8.5
8.2	103.1	8.5	8.6
8.1	103.7	8.2	8.5
7.9	112.1	8.1	8.2
8.6	86.9	7.9	8.1
8.7	95	8.6	7.9
8.7	111.8	8.7	8.6
8.5	108.8	8.7	8.7
8.4	109.3	8.5	8.7
8.5	101.4	8.4	8.5
8.7	100.5	8.5	8.4
8.7	100.7	8.7	8.5
8.6	113.5	8.7	8.7
8.5	106.1	8.6	8.7
8.3	111.6	8.5	8.6
8	114.9	8.3	8.5
8.2	88.6	8	8.3
8.1	99.5	8.2	8
8.1	115.1	8.1	8.2
8	118	8.1	8.1
7.9	111.4	8	8.1
7.9	107.3	7.9	8
8	105.3	7.9	7.9
8	105.3	8	7.9
7.9	117.9	8	8
8	110.2	7.9	8
7.7	112.4	8	7.9
7.2	117.5	7.7	8
7.5	93	7.2	7.7
7.3	103.5	7.5	7.2
7	116.3	7.3	7.5
7	120	7	7.3
7	114.3	7	7
7.2	104.7	7	7
7.3	109.8	7.2	7
7.1	112.6	7.3	7.2
6.8	114.4	7.1	7.3
6.4	115.7	6.8	7.1
6.1	114.7	6.4	6.8
6.5	118.4	6.1	6.4
7.7	94.9	6.5	6.1
7.9	103.8	7.7	6.5
7.5	115.1	7.9	7.7
6.9	113.7	7.5	7.9
6.6	104	6.9	7.5
6.9	94.3	6.6	6.9
7.7	92.5	6.9	6.6
8	93.2	7.7	6.9
8	104.7	8	7.7
7.7	94	8	8
7.3	98.1	7.7	8
7.4	102.7	7.3	7.7
8.1	82.4	7.4	7.3


Summary of computational transaction
Raw Inputview raw input (R code)
Raw Outputview raw output of R engine
Computing time3 seconds
R Server'Gwilym Jenkins' @ 72.249.127.135

\begin{tabular}{lllllllll}
\hline
Summary of computational transaction \tabularnewline
Raw Input & view raw input (R code)  \tabularnewline
Raw Output & view raw output of R engine  \tabularnewline
Computing time & 3 seconds \tabularnewline
R Server & 'Gwilym Jenkins' @ 72.249.127.135 \tabularnewline
\hline
\end{tabular}
%Source: https://freestatistics.org/blog/index.php?pk=58075&T=0

[TABLE]
[ROW][C]Summary of computational transaction[/C][/ROW]
[ROW][C]Raw Input[/C][C]view raw input (R code) [/C][/ROW]
[ROW][C]Raw Output[/C][C]view raw output of R engine [/C][/ROW]
[ROW][C]Computing time[/C][C]3 seconds[/C][/ROW]
[ROW][C]R Server[/C][C]'Gwilym Jenkins' @ 72.249.127.135[/C][/ROW]
[/TABLE]
Source: https://freestatistics.org/blog/index.php?pk=58075&T=0

Globally Unique Identifier (entire table): ba.freestatistics.org/blog/index.php?pk=58075&T=0

As an alternative you can also use a QR Code:  

The GUIDs for individual cells are displayed in the table below:

Summary of computational transaction
Raw Inputview raw input (R code)
Raw Outputview raw output of R engine
Computing time3 seconds
R Server'Gwilym Jenkins' @ 72.249.127.135


Multiple Linear Regression - Estimated Regression Equation
Y[t] = + 4.14999041251723 -0.0152438597880977X[t] + 1.34171092585125Y1[t] -0.632193949965465Y2[t] + 0.0835740790049867M1[t] + 0.0525149196902091M2[t] -0.176803720858912M3[t] -0.0232878832478820M4[t] -0.105116917657922M5[t] -0.129479933541223M6[t] + 0.0778523659487016M7[t] + 0.310812223645426M8[t] -0.447340912981457M9[t] -0.0193029508698561M10[t] + 0.00728265666300871M11[t] -0.00840207262544193t + e[t]

\begin{tabular}{lllllllll}
\hline
Multiple Linear Regression - Estimated Regression Equation \tabularnewline
Y[t] =  +  4.14999041251723 -0.0152438597880977X[t] +  1.34171092585125Y1[t] -0.632193949965465Y2[t] +  0.0835740790049867M1[t] +  0.0525149196902091M2[t] -0.176803720858912M3[t] -0.0232878832478820M4[t] -0.105116917657922M5[t] -0.129479933541223M6[t] +  0.0778523659487016M7[t] +  0.310812223645426M8[t] -0.447340912981457M9[t] -0.0193029508698561M10[t] +  0.00728265666300871M11[t] -0.00840207262544193t  + e[t] \tabularnewline
\hline
\end{tabular}
%Source: https://freestatistics.org/blog/index.php?pk=58075&T=1

[TABLE]
[ROW][C]Multiple Linear Regression - Estimated Regression Equation[/C][/ROW]
[ROW][C]Y[t] =  +  4.14999041251723 -0.0152438597880977X[t] +  1.34171092585125Y1[t] -0.632193949965465Y2[t] +  0.0835740790049867M1[t] +  0.0525149196902091M2[t] -0.176803720858912M3[t] -0.0232878832478820M4[t] -0.105116917657922M5[t] -0.129479933541223M6[t] +  0.0778523659487016M7[t] +  0.310812223645426M8[t] -0.447340912981457M9[t] -0.0193029508698561M10[t] +  0.00728265666300871M11[t] -0.00840207262544193t  + e[t][/C][/ROW]
[/TABLE]
Source: https://freestatistics.org/blog/index.php?pk=58075&T=1

Globally Unique Identifier (entire table): ba.freestatistics.org/blog/index.php?pk=58075&T=1

As an alternative you can also use a QR Code:  

The GUIDs for individual cells are displayed in the table below:

Multiple Linear Regression - Estimated Regression Equation
Y[t] = + 4.14999041251723 -0.0152438597880977X[t] + 1.34171092585125Y1[t] -0.632193949965465Y2[t] + 0.0835740790049867M1[t] + 0.0525149196902091M2[t] -0.176803720858912M3[t] -0.0232878832478820M4[t] -0.105116917657922M5[t] -0.129479933541223M6[t] + 0.0778523659487016M7[t] + 0.310812223645426M8[t] -0.447340912981457M9[t] -0.0193029508698561M10[t] + 0.00728265666300871M11[t] -0.00840207262544193t + e[t]


Multiple Linear Regression - Ordinary Least Squares
VariableParameterS.D.T-STATH0: parameter = 02-tail p-value1-tail p-value
(Intercept)4.149990412517230.9906314.18920.000157.5e-05
X-0.01524385978809770.004999-3.04910.0040580.002029
Y11.341710925851250.11603111.563400
Y2-0.6321939499654650.118245-5.34654e-062e-06
M10.08357407900498670.1269530.65830.5141130.257056
M20.05251491969020910.133460.39350.6960490.348025
M3-0.1768037208589120.134934-1.31030.1975690.098784
M4-0.02328788324788200.123139-0.18910.8509570.425478
M5-0.1051169176579220.11934-0.88080.383680.19184
M6-0.1294799335412230.117649-1.10060.2776660.138833
M70.07785236594870160.1183050.65810.5142660.257133
M80.3108122236454260.1610861.92950.0607860.030393
M9-0.4473409129814570.161306-2.77320.008390.004195
M10-0.01930295086985610.13103-0.14730.8836220.441811
M110.007282656663008710.1283880.05670.9550480.477524
t-0.008402072625441930.002576-3.26150.0022690.001135

\begin{tabular}{lllllllll}
\hline
Multiple Linear Regression - Ordinary Least Squares \tabularnewline
Variable & Parameter & S.D. & T-STATH0: parameter = 0 & 2-tail p-value & 1-tail p-value \tabularnewline
(Intercept) & 4.14999041251723 & 0.990631 & 4.1892 & 0.00015 & 7.5e-05 \tabularnewline
X & -0.0152438597880977 & 0.004999 & -3.0491 & 0.004058 & 0.002029 \tabularnewline
Y1 & 1.34171092585125 & 0.116031 & 11.5634 & 0 & 0 \tabularnewline
Y2 & -0.632193949965465 & 0.118245 & -5.3465 & 4e-06 & 2e-06 \tabularnewline
M1 & 0.0835740790049867 & 0.126953 & 0.6583 & 0.514113 & 0.257056 \tabularnewline
M2 & 0.0525149196902091 & 0.13346 & 0.3935 & 0.696049 & 0.348025 \tabularnewline
M3 & -0.176803720858912 & 0.134934 & -1.3103 & 0.197569 & 0.098784 \tabularnewline
M4 & -0.0232878832478820 & 0.123139 & -0.1891 & 0.850957 & 0.425478 \tabularnewline
M5 & -0.105116917657922 & 0.11934 & -0.8808 & 0.38368 & 0.19184 \tabularnewline
M6 & -0.129479933541223 & 0.117649 & -1.1006 & 0.277666 & 0.138833 \tabularnewline
M7 & 0.0778523659487016 & 0.118305 & 0.6581 & 0.514266 & 0.257133 \tabularnewline
M8 & 0.310812223645426 & 0.161086 & 1.9295 & 0.060786 & 0.030393 \tabularnewline
M9 & -0.447340912981457 & 0.161306 & -2.7732 & 0.00839 & 0.004195 \tabularnewline
M10 & -0.0193029508698561 & 0.13103 & -0.1473 & 0.883622 & 0.441811 \tabularnewline
M11 & 0.00728265666300871 & 0.128388 & 0.0567 & 0.955048 & 0.477524 \tabularnewline
t & -0.00840207262544193 & 0.002576 & -3.2615 & 0.002269 & 0.001135 \tabularnewline
\hline
\end{tabular}
%Source: https://freestatistics.org/blog/index.php?pk=58075&T=2

[TABLE]
[ROW][C]Multiple Linear Regression - Ordinary Least Squares[/C][/ROW]
[ROW][C]Variable[/C][C]Parameter[/C][C]S.D.[/C][C]T-STATH0: parameter = 0[/C][C]2-tail p-value[/C][C]1-tail p-value[/C][/ROW]
[ROW][C](Intercept)[/C][C]4.14999041251723[/C][C]0.990631[/C][C]4.1892[/C][C]0.00015[/C][C]7.5e-05[/C][/ROW]
[ROW][C]X[/C][C]-0.0152438597880977[/C][C]0.004999[/C][C]-3.0491[/C][C]0.004058[/C][C]0.002029[/C][/ROW]
[ROW][C]Y1[/C][C]1.34171092585125[/C][C]0.116031[/C][C]11.5634[/C][C]0[/C][C]0[/C][/ROW]
[ROW][C]Y2[/C][C]-0.632193949965465[/C][C]0.118245[/C][C]-5.3465[/C][C]4e-06[/C][C]2e-06[/C][/ROW]
[ROW][C]M1[/C][C]0.0835740790049867[/C][C]0.126953[/C][C]0.6583[/C][C]0.514113[/C][C]0.257056[/C][/ROW]
[ROW][C]M2[/C][C]0.0525149196902091[/C][C]0.13346[/C][C]0.3935[/C][C]0.696049[/C][C]0.348025[/C][/ROW]
[ROW][C]M3[/C][C]-0.176803720858912[/C][C]0.134934[/C][C]-1.3103[/C][C]0.197569[/C][C]0.098784[/C][/ROW]
[ROW][C]M4[/C][C]-0.0232878832478820[/C][C]0.123139[/C][C]-0.1891[/C][C]0.850957[/C][C]0.425478[/C][/ROW]
[ROW][C]M5[/C][C]-0.105116917657922[/C][C]0.11934[/C][C]-0.8808[/C][C]0.38368[/C][C]0.19184[/C][/ROW]
[ROW][C]M6[/C][C]-0.129479933541223[/C][C]0.117649[/C][C]-1.1006[/C][C]0.277666[/C][C]0.138833[/C][/ROW]
[ROW][C]M7[/C][C]0.0778523659487016[/C][C]0.118305[/C][C]0.6581[/C][C]0.514266[/C][C]0.257133[/C][/ROW]
[ROW][C]M8[/C][C]0.310812223645426[/C][C]0.161086[/C][C]1.9295[/C][C]0.060786[/C][C]0.030393[/C][/ROW]
[ROW][C]M9[/C][C]-0.447340912981457[/C][C]0.161306[/C][C]-2.7732[/C][C]0.00839[/C][C]0.004195[/C][/ROW]
[ROW][C]M10[/C][C]-0.0193029508698561[/C][C]0.13103[/C][C]-0.1473[/C][C]0.883622[/C][C]0.441811[/C][/ROW]
[ROW][C]M11[/C][C]0.00728265666300871[/C][C]0.128388[/C][C]0.0567[/C][C]0.955048[/C][C]0.477524[/C][/ROW]
[ROW][C]t[/C][C]-0.00840207262544193[/C][C]0.002576[/C][C]-3.2615[/C][C]0.002269[/C][C]0.001135[/C][/ROW]
[/TABLE]
Source: https://freestatistics.org/blog/index.php?pk=58075&T=2

Globally Unique Identifier (entire table): ba.freestatistics.org/blog/index.php?pk=58075&T=2

As an alternative you can also use a QR Code:  

The GUIDs for individual cells are displayed in the table below:

Multiple Linear Regression - Ordinary Least Squares
VariableParameterS.D.T-STATH0: parameter = 02-tail p-value1-tail p-value
(Intercept)4.149990412517230.9906314.18920.000157.5e-05
X-0.01524385978809770.004999-3.04910.0040580.002029
Y11.341710925851250.11603111.563400
Y2-0.6321939499654650.118245-5.34654e-062e-06
M10.08357407900498670.1269530.65830.5141130.257056
M20.05251491969020910.133460.39350.6960490.348025
M3-0.1768037208589120.134934-1.31030.1975690.098784
M4-0.02328788324788200.123139-0.18910.8509570.425478
M5-0.1051169176579220.11934-0.88080.383680.19184
M6-0.1294799335412230.117649-1.10060.2776660.138833
M70.07785236594870160.1183050.65810.5142660.257133
M80.3108122236454260.1610861.92950.0607860.030393
M9-0.4473409129814570.161306-2.77320.008390.004195
M10-0.01930295086985610.13103-0.14730.8836220.441811
M110.007282656663008710.1283880.05670.9550480.477524
t-0.008402072625441930.002576-3.26150.0022690.001135


Multiple Linear Regression - Regression Statistics
Multiple R0.974568997085734
R-squared0.949784730080693
Adjusted R-squared0.930954003860953
F-TEST (value)50.4380297922358
F-TEST (DF numerator)15
F-TEST (DF denominator)40
p-value0
Multiple Linear Regression - Residual Statistics
Residual Standard Deviation0.174779636784900
Sum Squared Residuals1.22191685738646

\begin{tabular}{lllllllll}
\hline
Multiple Linear Regression - Regression Statistics \tabularnewline
Multiple R & 0.974568997085734 \tabularnewline
R-squared & 0.949784730080693 \tabularnewline
Adjusted R-squared & 0.930954003860953 \tabularnewline
F-TEST (value) & 50.4380297922358 \tabularnewline
F-TEST (DF numerator) & 15 \tabularnewline
F-TEST (DF denominator) & 40 \tabularnewline
p-value & 0 \tabularnewline
Multiple Linear Regression - Residual Statistics \tabularnewline
Residual Standard Deviation & 0.174779636784900 \tabularnewline
Sum Squared Residuals & 1.22191685738646 \tabularnewline
\hline
\end{tabular}
%Source: https://freestatistics.org/blog/index.php?pk=58075&T=3

[TABLE]
[ROW][C]Multiple Linear Regression - Regression Statistics[/C][/ROW]
[ROW][C]Multiple R[/C][C]0.974568997085734[/C][/ROW]
[ROW][C]R-squared[/C][C]0.949784730080693[/C][/ROW]
[ROW][C]Adjusted R-squared[/C][C]0.930954003860953[/C][/ROW]
[ROW][C]F-TEST (value)[/C][C]50.4380297922358[/C][/ROW]
[ROW][C]F-TEST (DF numerator)[/C][C]15[/C][/ROW]
[ROW][C]F-TEST (DF denominator)[/C][C]40[/C][/ROW]
[ROW][C]p-value[/C][C]0[/C][/ROW]
[ROW][C]Multiple Linear Regression - Residual Statistics[/C][/ROW]
[ROW][C]Residual Standard Deviation[/C][C]0.174779636784900[/C][/ROW]
[ROW][C]Sum Squared Residuals[/C][C]1.22191685738646[/C][/ROW]
[/TABLE]
Source: https://freestatistics.org/blog/index.php?pk=58075&T=3

Globally Unique Identifier (entire table): ba.freestatistics.org/blog/index.php?pk=58075&T=3

As an alternative you can also use a QR Code:  

The GUIDs for individual cells are displayed in the table below:

Multiple Linear Regression - Regression Statistics
Multiple R0.974568997085734
R-squared0.949784730080693
Adjusted R-squared0.930954003860953
F-TEST (value)50.4380297922358
F-TEST (DF numerator)15
F-TEST (DF denominator)40
p-value0
Multiple Linear Regression - Residual Statistics
Residual Standard Deviation0.174779636784900
Sum Squared Residuals1.22191685738646


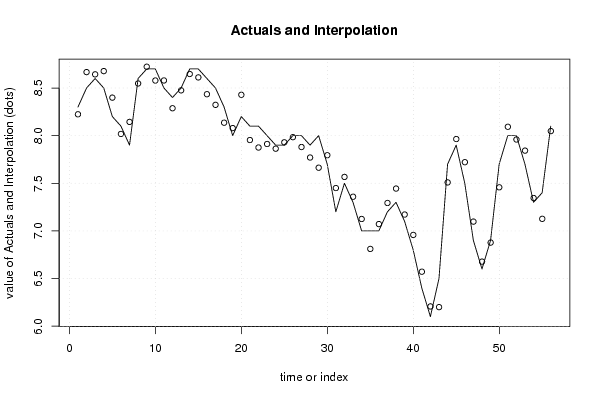
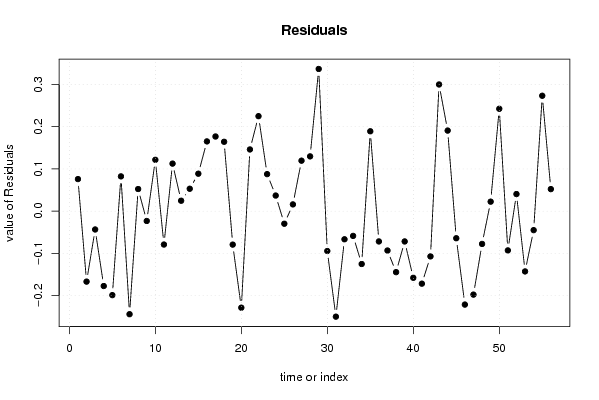
Multiple Linear Regression - Actuals, Interpolation, and Residuals
Time or IndexActualsInterpolationForecastResidualsPrediction Error
18.38.224060071071070.0759399289289281
28.58.6668790122537-0.166879012253704
38.68.6434274051257-0.0434274051257002
48.58.67737136635616-0.177371366356160
58.28.39889608761187-0.198896087611866
68.18.017690800471430.0823091995285654
77.98.14405969752041-0.244059697520411
88.68.547639959078050.0523600409219463
98.78.7232459236311-0.0232459236311051
108.78.578420296286520.121579703713478
118.58.5791160155617-0.0791160155616911
128.48.287467171208940.112532828791058
138.58.475333367322430.0246666326775733
148.78.646982096773170.0530179032268333
158.78.611335401814690.0886645981853136
168.68.434888971519530.165111028480468
178.58.323291334330850.176708665669152
188.38.135733319398990.164266680601011
1988.07923601878905-0.0792360187890467
208.28.42863282852502-0.228632828525016
218.17.953919917742310.146080082257685
228.17.875141711955930.224858288044067
2387.912337448474420.0876625515255819
247.97.863091101202290.0369088987977128
257.97.92981123512445-0.0298112351244543
2687.984057117756980.0159428822430233
2787.880507497167540.119492502832462
287.97.770329233826550.129670766173451
2987.66330475457430.336695245425706
307.77.7943936621134-0.0943936621134074
317.27.44984753130667-0.249847531306671
327.57.56668260325036-0.0666826032503617
337.37.35867711896112-0.0586771189611185
3477.12519123299974-0.125191232999737
3576.810897998928920.189102001071084
3677.07176145542226-0.071761455422262
377.27.29327451576754-0.0932745157675443
387.37.44441178407828-0.144411784078277
397.17.17174056608907-0.0717405660890719
406.86.95785380328929-0.157853803289287
416.46.571731190767-0.171731190766996
426.16.20718377669549-0.107183776695492
436.56.200076024574820.299923975425178
447.77.509207069996540.190792930003459
457.97.96415703966546-0.0641570396654613
467.57.72124675875781-0.221246758757809
476.97.09764853703497-0.197648537034974
486.66.67768027216651-0.0776802721665084
496.96.87752081071450.0224791892854972
507.77.457669989137870.242330010862125
5188.092989129803-0.0929891298030035
5287.959556625008470.0404433749915284
537.77.842776632716-0.142776632715995
547.37.34499844132068-0.0449984413206777
557.47.126780727809050.273219272190951
568.18.047837539150030.0521624608499723

\begin{tabular}{lllllllll}
\hline
Multiple Linear Regression - Actuals, Interpolation, and Residuals \tabularnewline
Time or Index & Actuals & InterpolationForecast & ResidualsPrediction Error \tabularnewline
1 & 8.3 & 8.22406007107107 & 0.0759399289289281 \tabularnewline
2 & 8.5 & 8.6668790122537 & -0.166879012253704 \tabularnewline
3 & 8.6 & 8.6434274051257 & -0.0434274051257002 \tabularnewline
4 & 8.5 & 8.67737136635616 & -0.177371366356160 \tabularnewline
5 & 8.2 & 8.39889608761187 & -0.198896087611866 \tabularnewline
6 & 8.1 & 8.01769080047143 & 0.0823091995285654 \tabularnewline
7 & 7.9 & 8.14405969752041 & -0.244059697520411 \tabularnewline
8 & 8.6 & 8.54763995907805 & 0.0523600409219463 \tabularnewline
9 & 8.7 & 8.7232459236311 & -0.0232459236311051 \tabularnewline
10 & 8.7 & 8.57842029628652 & 0.121579703713478 \tabularnewline
11 & 8.5 & 8.5791160155617 & -0.0791160155616911 \tabularnewline
12 & 8.4 & 8.28746717120894 & 0.112532828791058 \tabularnewline
13 & 8.5 & 8.47533336732243 & 0.0246666326775733 \tabularnewline
14 & 8.7 & 8.64698209677317 & 0.0530179032268333 \tabularnewline
15 & 8.7 & 8.61133540181469 & 0.0886645981853136 \tabularnewline
16 & 8.6 & 8.43488897151953 & 0.165111028480468 \tabularnewline
17 & 8.5 & 8.32329133433085 & 0.176708665669152 \tabularnewline
18 & 8.3 & 8.13573331939899 & 0.164266680601011 \tabularnewline
19 & 8 & 8.07923601878905 & -0.0792360187890467 \tabularnewline
20 & 8.2 & 8.42863282852502 & -0.228632828525016 \tabularnewline
21 & 8.1 & 7.95391991774231 & 0.146080082257685 \tabularnewline
22 & 8.1 & 7.87514171195593 & 0.224858288044067 \tabularnewline
23 & 8 & 7.91233744847442 & 0.0876625515255819 \tabularnewline
24 & 7.9 & 7.86309110120229 & 0.0369088987977128 \tabularnewline
25 & 7.9 & 7.92981123512445 & -0.0298112351244543 \tabularnewline
26 & 8 & 7.98405711775698 & 0.0159428822430233 \tabularnewline
27 & 8 & 7.88050749716754 & 0.119492502832462 \tabularnewline
28 & 7.9 & 7.77032923382655 & 0.129670766173451 \tabularnewline
29 & 8 & 7.6633047545743 & 0.336695245425706 \tabularnewline
30 & 7.7 & 7.7943936621134 & -0.0943936621134074 \tabularnewline
31 & 7.2 & 7.44984753130667 & -0.249847531306671 \tabularnewline
32 & 7.5 & 7.56668260325036 & -0.0666826032503617 \tabularnewline
33 & 7.3 & 7.35867711896112 & -0.0586771189611185 \tabularnewline
34 & 7 & 7.12519123299974 & -0.125191232999737 \tabularnewline
35 & 7 & 6.81089799892892 & 0.189102001071084 \tabularnewline
36 & 7 & 7.07176145542226 & -0.071761455422262 \tabularnewline
37 & 7.2 & 7.29327451576754 & -0.0932745157675443 \tabularnewline
38 & 7.3 & 7.44441178407828 & -0.144411784078277 \tabularnewline
39 & 7.1 & 7.17174056608907 & -0.0717405660890719 \tabularnewline
40 & 6.8 & 6.95785380328929 & -0.157853803289287 \tabularnewline
41 & 6.4 & 6.571731190767 & -0.171731190766996 \tabularnewline
42 & 6.1 & 6.20718377669549 & -0.107183776695492 \tabularnewline
43 & 6.5 & 6.20007602457482 & 0.299923975425178 \tabularnewline
44 & 7.7 & 7.50920706999654 & 0.190792930003459 \tabularnewline
45 & 7.9 & 7.96415703966546 & -0.0641570396654613 \tabularnewline
46 & 7.5 & 7.72124675875781 & -0.221246758757809 \tabularnewline
47 & 6.9 & 7.09764853703497 & -0.197648537034974 \tabularnewline
48 & 6.6 & 6.67768027216651 & -0.0776802721665084 \tabularnewline
49 & 6.9 & 6.8775208107145 & 0.0224791892854972 \tabularnewline
50 & 7.7 & 7.45766998913787 & 0.242330010862125 \tabularnewline
51 & 8 & 8.092989129803 & -0.0929891298030035 \tabularnewline
52 & 8 & 7.95955662500847 & 0.0404433749915284 \tabularnewline
53 & 7.7 & 7.842776632716 & -0.142776632715995 \tabularnewline
54 & 7.3 & 7.34499844132068 & -0.0449984413206777 \tabularnewline
55 & 7.4 & 7.12678072780905 & 0.273219272190951 \tabularnewline
56 & 8.1 & 8.04783753915003 & 0.0521624608499723 \tabularnewline
\hline
\end{tabular}
%Source: https://freestatistics.org/blog/index.php?pk=58075&T=4

[TABLE]
[ROW][C]Multiple Linear Regression - Actuals, Interpolation, and Residuals[/C][/ROW]
[ROW][C]Time or Index[/C][C]Actuals[/C][C]InterpolationForecast[/C][C]ResidualsPrediction Error[/C][/ROW]
[ROW][C]1[/C][C]8.3[/C][C]8.22406007107107[/C][C]0.0759399289289281[/C][/ROW]
[ROW][C]2[/C][C]8.5[/C][C]8.6668790122537[/C][C]-0.166879012253704[/C][/ROW]
[ROW][C]3[/C][C]8.6[/C][C]8.6434274051257[/C][C]-0.0434274051257002[/C][/ROW]
[ROW][C]4[/C][C]8.5[/C][C]8.67737136635616[/C][C]-0.177371366356160[/C][/ROW]
[ROW][C]5[/C][C]8.2[/C][C]8.39889608761187[/C][C]-0.198896087611866[/C][/ROW]
[ROW][C]6[/C][C]8.1[/C][C]8.01769080047143[/C][C]0.0823091995285654[/C][/ROW]
[ROW][C]7[/C][C]7.9[/C][C]8.14405969752041[/C][C]-0.244059697520411[/C][/ROW]
[ROW][C]8[/C][C]8.6[/C][C]8.54763995907805[/C][C]0.0523600409219463[/C][/ROW]
[ROW][C]9[/C][C]8.7[/C][C]8.7232459236311[/C][C]-0.0232459236311051[/C][/ROW]
[ROW][C]10[/C][C]8.7[/C][C]8.57842029628652[/C][C]0.121579703713478[/C][/ROW]
[ROW][C]11[/C][C]8.5[/C][C]8.5791160155617[/C][C]-0.0791160155616911[/C][/ROW]
[ROW][C]12[/C][C]8.4[/C][C]8.28746717120894[/C][C]0.112532828791058[/C][/ROW]
[ROW][C]13[/C][C]8.5[/C][C]8.47533336732243[/C][C]0.0246666326775733[/C][/ROW]
[ROW][C]14[/C][C]8.7[/C][C]8.64698209677317[/C][C]0.0530179032268333[/C][/ROW]
[ROW][C]15[/C][C]8.7[/C][C]8.61133540181469[/C][C]0.0886645981853136[/C][/ROW]
[ROW][C]16[/C][C]8.6[/C][C]8.43488897151953[/C][C]0.165111028480468[/C][/ROW]
[ROW][C]17[/C][C]8.5[/C][C]8.32329133433085[/C][C]0.176708665669152[/C][/ROW]
[ROW][C]18[/C][C]8.3[/C][C]8.13573331939899[/C][C]0.164266680601011[/C][/ROW]
[ROW][C]19[/C][C]8[/C][C]8.07923601878905[/C][C]-0.0792360187890467[/C][/ROW]
[ROW][C]20[/C][C]8.2[/C][C]8.42863282852502[/C][C]-0.228632828525016[/C][/ROW]
[ROW][C]21[/C][C]8.1[/C][C]7.95391991774231[/C][C]0.146080082257685[/C][/ROW]
[ROW][C]22[/C][C]8.1[/C][C]7.87514171195593[/C][C]0.224858288044067[/C][/ROW]
[ROW][C]23[/C][C]8[/C][C]7.91233744847442[/C][C]0.0876625515255819[/C][/ROW]
[ROW][C]24[/C][C]7.9[/C][C]7.86309110120229[/C][C]0.0369088987977128[/C][/ROW]
[ROW][C]25[/C][C]7.9[/C][C]7.92981123512445[/C][C]-0.0298112351244543[/C][/ROW]
[ROW][C]26[/C][C]8[/C][C]7.98405711775698[/C][C]0.0159428822430233[/C][/ROW]
[ROW][C]27[/C][C]8[/C][C]7.88050749716754[/C][C]0.119492502832462[/C][/ROW]
[ROW][C]28[/C][C]7.9[/C][C]7.77032923382655[/C][C]0.129670766173451[/C][/ROW]
[ROW][C]29[/C][C]8[/C][C]7.6633047545743[/C][C]0.336695245425706[/C][/ROW]
[ROW][C]30[/C][C]7.7[/C][C]7.7943936621134[/C][C]-0.0943936621134074[/C][/ROW]
[ROW][C]31[/C][C]7.2[/C][C]7.44984753130667[/C][C]-0.249847531306671[/C][/ROW]
[ROW][C]32[/C][C]7.5[/C][C]7.56668260325036[/C][C]-0.0666826032503617[/C][/ROW]
[ROW][C]33[/C][C]7.3[/C][C]7.35867711896112[/C][C]-0.0586771189611185[/C][/ROW]
[ROW][C]34[/C][C]7[/C][C]7.12519123299974[/C][C]-0.125191232999737[/C][/ROW]
[ROW][C]35[/C][C]7[/C][C]6.81089799892892[/C][C]0.189102001071084[/C][/ROW]
[ROW][C]36[/C][C]7[/C][C]7.07176145542226[/C][C]-0.071761455422262[/C][/ROW]
[ROW][C]37[/C][C]7.2[/C][C]7.29327451576754[/C][C]-0.0932745157675443[/C][/ROW]
[ROW][C]38[/C][C]7.3[/C][C]7.44441178407828[/C][C]-0.144411784078277[/C][/ROW]
[ROW][C]39[/C][C]7.1[/C][C]7.17174056608907[/C][C]-0.0717405660890719[/C][/ROW]
[ROW][C]40[/C][C]6.8[/C][C]6.95785380328929[/C][C]-0.157853803289287[/C][/ROW]
[ROW][C]41[/C][C]6.4[/C][C]6.571731190767[/C][C]-0.171731190766996[/C][/ROW]
[ROW][C]42[/C][C]6.1[/C][C]6.20718377669549[/C][C]-0.107183776695492[/C][/ROW]
[ROW][C]43[/C][C]6.5[/C][C]6.20007602457482[/C][C]0.299923975425178[/C][/ROW]
[ROW][C]44[/C][C]7.7[/C][C]7.50920706999654[/C][C]0.190792930003459[/C][/ROW]
[ROW][C]45[/C][C]7.9[/C][C]7.96415703966546[/C][C]-0.0641570396654613[/C][/ROW]
[ROW][C]46[/C][C]7.5[/C][C]7.72124675875781[/C][C]-0.221246758757809[/C][/ROW]
[ROW][C]47[/C][C]6.9[/C][C]7.09764853703497[/C][C]-0.197648537034974[/C][/ROW]
[ROW][C]48[/C][C]6.6[/C][C]6.67768027216651[/C][C]-0.0776802721665084[/C][/ROW]
[ROW][C]49[/C][C]6.9[/C][C]6.8775208107145[/C][C]0.0224791892854972[/C][/ROW]
[ROW][C]50[/C][C]7.7[/C][C]7.45766998913787[/C][C]0.242330010862125[/C][/ROW]
[ROW][C]51[/C][C]8[/C][C]8.092989129803[/C][C]-0.0929891298030035[/C][/ROW]
[ROW][C]52[/C][C]8[/C][C]7.95955662500847[/C][C]0.0404433749915284[/C][/ROW]
[ROW][C]53[/C][C]7.7[/C][C]7.842776632716[/C][C]-0.142776632715995[/C][/ROW]
[ROW][C]54[/C][C]7.3[/C][C]7.34499844132068[/C][C]-0.0449984413206777[/C][/ROW]
[ROW][C]55[/C][C]7.4[/C][C]7.12678072780905[/C][C]0.273219272190951[/C][/ROW]
[ROW][C]56[/C][C]8.1[/C][C]8.04783753915003[/C][C]0.0521624608499723[/C][/ROW]
[/TABLE]
Source: https://freestatistics.org/blog/index.php?pk=58075&T=4

Globally Unique Identifier (entire table): ba.freestatistics.org/blog/index.php?pk=58075&T=4

As an alternative you can also use a QR Code:  

The GUIDs for individual cells are displayed in the table below:

Multiple Linear Regression - Actuals, Interpolation, and Residuals
Time or IndexActualsInterpolationForecastResidualsPrediction Error
18.38.224060071071070.0759399289289281
28.58.6668790122537-0.166879012253704
38.68.6434274051257-0.0434274051257002
48.58.67737136635616-0.177371366356160
58.28.39889608761187-0.198896087611866
68.18.017690800471430.0823091995285654
77.98.14405969752041-0.244059697520411
88.68.547639959078050.0523600409219463
98.78.7232459236311-0.0232459236311051
108.78.578420296286520.121579703713478
118.58.5791160155617-0.0791160155616911
128.48.287467171208940.112532828791058
138.58.475333367322430.0246666326775733
148.78.646982096773170.0530179032268333
158.78.611335401814690.0886645981853136
168.68.434888971519530.165111028480468
178.58.323291334330850.176708665669152
188.38.135733319398990.164266680601011
1988.07923601878905-0.0792360187890467
208.28.42863282852502-0.228632828525016
218.17.953919917742310.146080082257685
228.17.875141711955930.224858288044067
2387.912337448474420.0876625515255819
247.97.863091101202290.0369088987977128
257.97.92981123512445-0.0298112351244543
2687.984057117756980.0159428822430233
2787.880507497167540.119492502832462
287.97.770329233826550.129670766173451
2987.66330475457430.336695245425706
307.77.7943936621134-0.0943936621134074
317.27.44984753130667-0.249847531306671
327.57.56668260325036-0.0666826032503617
337.37.35867711896112-0.0586771189611185
3477.12519123299974-0.125191232999737
3576.810897998928920.189102001071084
3677.07176145542226-0.071761455422262
377.27.29327451576754-0.0932745157675443
387.37.44441178407828-0.144411784078277
397.17.17174056608907-0.0717405660890719
406.86.95785380328929-0.157853803289287
416.46.571731190767-0.171731190766996
426.16.20718377669549-0.107183776695492
436.56.200076024574820.299923975425178
447.77.509207069996540.190792930003459
457.97.96415703966546-0.0641570396654613
467.57.72124675875781-0.221246758757809
476.97.09764853703497-0.197648537034974
486.66.67768027216651-0.0776802721665084
496.96.87752081071450.0224791892854972
507.77.457669989137870.242330010862125
5188.092989129803-0.0929891298030035
5287.959556625008470.0404433749915284
537.77.842776632716-0.142776632715995
547.37.34499844132068-0.0449984413206777
557.47.126780727809050.273219272190951
568.18.047837539150030.0521624608499723


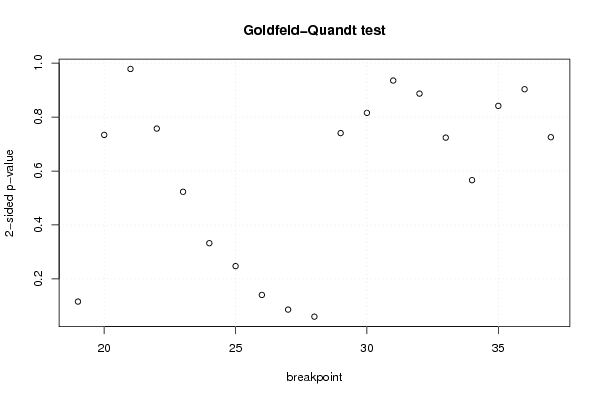
Goldfeld-Quandt test for Heteroskedasticity
p-valuesAlternative Hypothesis
breakpoint indexgreater2-sidedless
190.05795178137616580.1159035627523320.942048218623834
200.6330953284919590.7338093430160820.366904671508041
210.4891421592256570.9782843184513130.510857840774343
220.3785958695346540.7571917390693070.621404130465346
230.261443653799090.522887307598180.73855634620091
240.1661707514661740.3323415029323480.833829248533826
250.1236683401753870.2473366803507740.876331659824613
260.07027431950391030.1405486390078210.92972568049609
270.043086557881920.086173115763840.95691344211808
280.03003588486034940.06007176972069870.96996411513965
290.3702315022330120.7404630044660240.629768497766988
300.4076825450585580.8153650901171160.592317454941442
310.5323416964417340.9353166071165320.467658303558266
320.4433870633822720.8867741267645440.556612936617728
330.3618297562975960.7236595125951920.638170243702404
340.2830282996283910.5660565992567830.716971700371609
350.5792985034909780.8414029930180440.420701496509022
360.4515881260531340.9031762521062680.548411873946866
370.3626165374487290.7252330748974570.637383462551271

\begin{tabular}{lllllllll}
\hline
Goldfeld-Quandt test for Heteroskedasticity \tabularnewline
p-values & Alternative Hypothesis \tabularnewline
breakpoint index & greater & 2-sided & less \tabularnewline
19 & 0.0579517813761658 & 0.115903562752332 & 0.942048218623834 \tabularnewline
20 & 0.633095328491959 & 0.733809343016082 & 0.366904671508041 \tabularnewline
21 & 0.489142159225657 & 0.978284318451313 & 0.510857840774343 \tabularnewline
22 & 0.378595869534654 & 0.757191739069307 & 0.621404130465346 \tabularnewline
23 & 0.26144365379909 & 0.52288730759818 & 0.73855634620091 \tabularnewline
24 & 0.166170751466174 & 0.332341502932348 & 0.833829248533826 \tabularnewline
25 & 0.123668340175387 & 0.247336680350774 & 0.876331659824613 \tabularnewline
26 & 0.0702743195039103 & 0.140548639007821 & 0.92972568049609 \tabularnewline
27 & 0.04308655788192 & 0.08617311576384 & 0.95691344211808 \tabularnewline
28 & 0.0300358848603494 & 0.0600717697206987 & 0.96996411513965 \tabularnewline
29 & 0.370231502233012 & 0.740463004466024 & 0.629768497766988 \tabularnewline
30 & 0.407682545058558 & 0.815365090117116 & 0.592317454941442 \tabularnewline
31 & 0.532341696441734 & 0.935316607116532 & 0.467658303558266 \tabularnewline
32 & 0.443387063382272 & 0.886774126764544 & 0.556612936617728 \tabularnewline
33 & 0.361829756297596 & 0.723659512595192 & 0.638170243702404 \tabularnewline
34 & 0.283028299628391 & 0.566056599256783 & 0.716971700371609 \tabularnewline
35 & 0.579298503490978 & 0.841402993018044 & 0.420701496509022 \tabularnewline
36 & 0.451588126053134 & 0.903176252106268 & 0.548411873946866 \tabularnewline
37 & 0.362616537448729 & 0.725233074897457 & 0.637383462551271 \tabularnewline
\hline
\end{tabular}
%Source: https://freestatistics.org/blog/index.php?pk=58075&T=5

[TABLE]
[ROW][C]Goldfeld-Quandt test for Heteroskedasticity[/C][/ROW]
[ROW][C]p-values[/C][C]Alternative Hypothesis[/C][/ROW]
[ROW][C]breakpoint index[/C][C]greater[/C][C]2-sided[/C][C]less[/C][/ROW]
[ROW][C]19[/C][C]0.0579517813761658[/C][C]0.115903562752332[/C][C]0.942048218623834[/C][/ROW]
[ROW][C]20[/C][C]0.633095328491959[/C][C]0.733809343016082[/C][C]0.366904671508041[/C][/ROW]
[ROW][C]21[/C][C]0.489142159225657[/C][C]0.978284318451313[/C][C]0.510857840774343[/C][/ROW]
[ROW][C]22[/C][C]0.378595869534654[/C][C]0.757191739069307[/C][C]0.621404130465346[/C][/ROW]
[ROW][C]23[/C][C]0.26144365379909[/C][C]0.52288730759818[/C][C]0.73855634620091[/C][/ROW]
[ROW][C]24[/C][C]0.166170751466174[/C][C]0.332341502932348[/C][C]0.833829248533826[/C][/ROW]
[ROW][C]25[/C][C]0.123668340175387[/C][C]0.247336680350774[/C][C]0.876331659824613[/C][/ROW]
[ROW][C]26[/C][C]0.0702743195039103[/C][C]0.140548639007821[/C][C]0.92972568049609[/C][/ROW]
[ROW][C]27[/C][C]0.04308655788192[/C][C]0.08617311576384[/C][C]0.95691344211808[/C][/ROW]
[ROW][C]28[/C][C]0.0300358848603494[/C][C]0.0600717697206987[/C][C]0.96996411513965[/C][/ROW]
[ROW][C]29[/C][C]0.370231502233012[/C][C]0.740463004466024[/C][C]0.629768497766988[/C][/ROW]
[ROW][C]30[/C][C]0.407682545058558[/C][C]0.815365090117116[/C][C]0.592317454941442[/C][/ROW]
[ROW][C]31[/C][C]0.532341696441734[/C][C]0.935316607116532[/C][C]0.467658303558266[/C][/ROW]
[ROW][C]32[/C][C]0.443387063382272[/C][C]0.886774126764544[/C][C]0.556612936617728[/C][/ROW]
[ROW][C]33[/C][C]0.361829756297596[/C][C]0.723659512595192[/C][C]0.638170243702404[/C][/ROW]
[ROW][C]34[/C][C]0.283028299628391[/C][C]0.566056599256783[/C][C]0.716971700371609[/C][/ROW]
[ROW][C]35[/C][C]0.579298503490978[/C][C]0.841402993018044[/C][C]0.420701496509022[/C][/ROW]
[ROW][C]36[/C][C]0.451588126053134[/C][C]0.903176252106268[/C][C]0.548411873946866[/C][/ROW]
[ROW][C]37[/C][C]0.362616537448729[/C][C]0.725233074897457[/C][C]0.637383462551271[/C][/ROW]
[/TABLE]
Source: https://freestatistics.org/blog/index.php?pk=58075&T=5

Globally Unique Identifier (entire table): ba.freestatistics.org/blog/index.php?pk=58075&T=5

As an alternative you can also use a QR Code:  

The GUIDs for individual cells are displayed in the table below:

Goldfeld-Quandt test for Heteroskedasticity
p-valuesAlternative Hypothesis
breakpoint indexgreater2-sidedless
190.05795178137616580.1159035627523320.942048218623834
200.6330953284919590.7338093430160820.366904671508041
210.4891421592256570.9782843184513130.510857840774343
220.3785958695346540.7571917390693070.621404130465346
230.261443653799090.522887307598180.73855634620091
240.1661707514661740.3323415029323480.833829248533826
250.1236683401753870.2473366803507740.876331659824613
260.07027431950391030.1405486390078210.92972568049609
270.043086557881920.086173115763840.95691344211808
280.03003588486034940.06007176972069870.96996411513965
290.3702315022330120.7404630044660240.629768497766988
300.4076825450585580.8153650901171160.592317454941442
310.5323416964417340.9353166071165320.467658303558266
320.4433870633822720.8867741267645440.556612936617728
330.3618297562975960.7236595125951920.638170243702404
340.2830282996283910.5660565992567830.716971700371609
350.5792985034909780.8414029930180440.420701496509022
360.4515881260531340.9031762521062680.548411873946866
370.3626165374487290.7252330748974570.637383462551271


Meta Analysis of Goldfeld-Quandt test for Heteroskedasticity
Description# significant tests% significant testsOK/NOK
1% type I error level00OK
5% type I error level00OK
10% type I error level20.105263157894737NOK

\begin{tabular}{lllllllll}
\hline
Meta Analysis of Goldfeld-Quandt test for Heteroskedasticity \tabularnewline
Description & # significant tests & % significant tests & OK/NOK \tabularnewline
1% type I error level & 0 & 0 & OK \tabularnewline
5% type I error level & 0 & 0 & OK \tabularnewline
10% type I error level & 2 & 0.105263157894737 & NOK \tabularnewline
\hline
\end{tabular}
%Source: https://freestatistics.org/blog/index.php?pk=58075&T=6

[TABLE]
[ROW][C]Meta Analysis of Goldfeld-Quandt test for Heteroskedasticity[/C][/ROW]
[ROW][C]Description[/C][C]# significant tests[/C][C]% significant tests[/C][C]OK/NOK[/C][/ROW]
[ROW][C]1% type I error level[/C][C]0[/C][C]0[/C][C]OK[/C][/ROW]
[ROW][C]5% type I error level[/C][C]0[/C][C]0[/C][C]OK[/C][/ROW]
[ROW][C]10% type I error level[/C][C]2[/C][C]0.105263157894737[/C][C]NOK[/C][/ROW]
[/TABLE]
Source: https://freestatistics.org/blog/index.php?pk=58075&T=6

Globally Unique Identifier (entire table): ba.freestatistics.org/blog/index.php?pk=58075&T=6

As an alternative you can also use a QR Code:  

The GUIDs for individual cells are displayed in the table below:

Meta Analysis of Goldfeld-Quandt test for Heteroskedasticity
Description# significant tests% significant testsOK/NOK
1% type I error level00OK
5% type I error level00OK
10% type I error level20.105263157894737NOK


Parameters (Session):
par1 = 1 ; par2 = Include Monthly Dummies ; par3 = Linear Trend ;
Parameters (R input):
par1 = 1 ; par2 = Include Monthly Dummies ; par3 = Linear Trend ;
R code (references can be found in the software module):
library(lattice)
library(lmtest)
n25 <- 25 #minimum number of obs. for Goldfeld-Quandt test
par1 <- as.numeric(par1)
x <- t(y)
k <- length(x[1,])
n <- length(x[,1])
x1 <- cbind(x[,par1], x[,1:k!=par1])
mycolnames <- c(colnames(x)[par1], colnames(x)[1:k!=par1])
colnames(x1) <- mycolnames #colnames(x)[par1]
x <- x1
if (par3 == 'First Differences'){
x2 <- array(0, dim=c(n-1,k), dimnames=list(1:(n-1), paste('(1-B)',colnames(x),sep='')))
for (i in 1:n-1) {
for (j in 1:k) {
x2[i,j] <- x[i+1,j] - x[i,j]
}
}
x <- x2
}
if (par2 == 'Include Monthly Dummies'){
x2 <- array(0, dim=c(n,11), dimnames=list(1:n, paste('M', seq(1:11), sep ='')))
for (i in 1:11){
x2[seq(i,n,12),i] <- 1
}
x <- cbind(x, x2)
}
if (par2 == 'Include Quarterly Dummies'){
x2 <- array(0, dim=c(n,3), dimnames=list(1:n, paste('Q', seq(1:3), sep ='')))
for (i in 1:3){
x2[seq(i,n,4),i] <- 1
}
x <- cbind(x, x2)
}
k <- length(x[1,])
if (par3 == 'Linear Trend'){
x <- cbind(x, c(1:n))
colnames(x)[k+1] <- 't'
}
x
k <- length(x[1,])
df <- as.data.frame(x)
(mylm <- lm(df))
(mysum <- summary(mylm))
if (n > n25) {
kp3 <- k + 3
nmkm3 <- n - k - 3
gqarr <- array(NA, dim=c(nmkm3-kp3+1,3))
numgqtests <- 0
numsignificant1 <- 0
numsignificant5 <- 0
numsignificant10 <- 0
for (mypoint in kp3:nmkm3) {
j <- 0
numgqtests <- numgqtests + 1
for (myalt in c('greater', 'two.sided', 'less')) {
j <- j + 1
gqarr[mypoint-kp3+1,j] <- gqtest(mylm, point=mypoint, alternative=myalt)$p.value
}
if (gqarr[mypoint-kp3+1,2] < 0.01) numsignificant1 <- numsignificant1 + 1
if (gqarr[mypoint-kp3+1,2] < 0.05) numsignificant5 <- numsignificant5 + 1
if (gqarr[mypoint-kp3+1,2] < 0.10) numsignificant10 <- numsignificant10 + 1
}
gqarr
}
bitmap(file='test0.png')
plot(x[,1], type='l', main='Actuals and Interpolation', ylab='value of Actuals and Interpolation (dots)', xlab='time or index')
points(x[,1]-mysum$resid)
grid()
dev.off()
bitmap(file='test1.png')
plot(mysum$resid, type='b', pch=19, main='Residuals', ylab='value of Residuals', xlab='time or index')
grid()
dev.off()
bitmap(file='test2.png')
hist(mysum$resid, main='Residual Histogram', xlab='values of Residuals')
grid()
dev.off()
bitmap(file='test3.png')
densityplot(~mysum$resid,col='black',main='Residual Density Plot', xlab='values of Residuals')
dev.off()
bitmap(file='test4.png')
qqnorm(mysum$resid, main='Residual Normal Q-Q Plot')
qqline(mysum$resid)
grid()
dev.off()
(myerror <- as.ts(mysum$resid))
bitmap(file='test5.png')
dum <- cbind(lag(myerror,k=1),myerror)
dum
dum1 <- dum[2:length(myerror),]
dum1
z <- as.data.frame(dum1)
z
plot(z,main=paste('Residual Lag plot, lowess, and regression line'), ylab='values of Residuals', xlab='lagged values of Residuals')
lines(lowess(z))
abline(lm(z))
grid()
dev.off()
bitmap(file='test6.png')
acf(mysum$resid, lag.max=length(mysum$resid)/2, main='Residual Autocorrelation Function')
grid()
dev.off()
bitmap(file='test7.png')
pacf(mysum$resid, lag.max=length(mysum$resid)/2, main='Residual Partial Autocorrelation Function')
grid()
dev.off()
bitmap(file='test8.png')
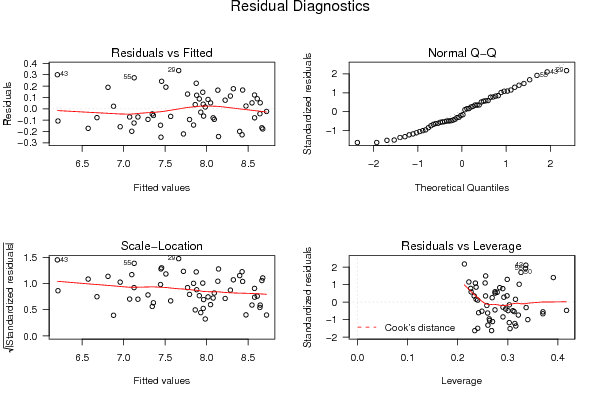
opar <- par(mfrow = c(2,2), oma = c(0, 0, 1.1, 0))
plot(mylm, las = 1, sub='Residual Diagnostics')
par(opar)
dev.off()
if (n > n25) {
bitmap(file='test9.png')
plot(kp3:nmkm3,gqarr[,2], main='Goldfeld-Quandt test',ylab='2-sided p-value',xlab='breakpoint')
grid()
dev.off()
}
load(file='createtable')
a<-table.start()
a<-table.row.start(a)
a<-table.element(a, 'Multiple Linear Regression - Estimated Regression Equation', 1, TRUE)
a<-table.row.end(a)
myeq <- colnames(x)[1]
myeq <- paste(myeq, '[t] = ', sep='')
for (i in 1:k){
if (mysum$coefficients[i,1] > 0) myeq <- paste(myeq, '+', '')
myeq <- paste(myeq, mysum$coefficients[i,1], sep=' ')
if (rownames(mysum$coefficients)[i] != '(Intercept)') {
myeq <- paste(myeq, rownames(mysum$coefficients)[i], sep='')
if (rownames(mysum$coefficients)[i] != 't') myeq <- paste(myeq, '[t]', sep='')
}
}
myeq <- paste(myeq, ' + e[t]')
a<-table.row.start(a)
a<-table.element(a, myeq)
a<-table.row.end(a)
a<-table.end(a)
table.save(a,file='mytable1.tab')
a<-table.start()
a<-table.row.start(a)
a<-table.element(a,hyperlink('ols1.htm','Multiple Linear Regression - Ordinary Least Squares',''), 6, TRUE)
a<-table.row.end(a)
a<-table.row.start(a)
a<-table.element(a,'Variable',header=TRUE)
a<-table.element(a,'Parameter',header=TRUE)
a<-table.element(a,'S.D.',header=TRUE)
a<-table.element(a,'T-STAT
H0: parameter = 0',header=TRUE)
a<-table.element(a,'2-tail p-value',header=TRUE)
a<-table.element(a,'1-tail p-value',header=TRUE)
a<-table.row.end(a)
for (i in 1:k){
a<-table.row.start(a)
a<-table.element(a,rownames(mysum$coefficients)[i],header=TRUE)
a<-table.element(a,mysum$coefficients[i,1])
a<-table.element(a, round(mysum$coefficients[i,2],6))
a<-table.element(a, round(mysum$coefficients[i,3],4))
a<-table.element(a, round(mysum$coefficients[i,4],6))
a<-table.element(a, round(mysum$coefficients[i,4]/2,6))
a<-table.row.end(a)
}
a<-table.end(a)
table.save(a,file='mytable2.tab')
a<-table.start()
a<-table.row.start(a)
a<-table.element(a, 'Multiple Linear Regression - Regression Statistics', 2, TRUE)
a<-table.row.end(a)
a<-table.row.start(a)
a<-table.element(a, 'Multiple R',1,TRUE)
a<-table.element(a, sqrt(mysum$r.squared))
a<-table.row.end(a)
a<-table.row.start(a)
a<-table.element(a, 'R-squared',1,TRUE)
a<-table.element(a, mysum$r.squared)
a<-table.row.end(a)
a<-table.row.start(a)
a<-table.element(a, 'Adjusted R-squared',1,TRUE)
a<-table.element(a, mysum$adj.r.squared)
a<-table.row.end(a)
a<-table.row.start(a)
a<-table.element(a, 'F-TEST (value)',1,TRUE)
a<-table.element(a, mysum$fstatistic[1])
a<-table.row.end(a)
a<-table.row.start(a)
a<-table.element(a, 'F-TEST (DF numerator)',1,TRUE)
a<-table.element(a, mysum$fstatistic[2])
a<-table.row.end(a)
a<-table.row.start(a)
a<-table.element(a, 'F-TEST (DF denominator)',1,TRUE)
a<-table.element(a, mysum$fstatistic[3])
a<-table.row.end(a)
a<-table.row.start(a)
a<-table.element(a, 'p-value',1,TRUE)
a<-table.element(a, 1-pf(mysum$fstatistic[1],mysum$fstatistic[2],mysum$fstatistic[3]))
a<-table.row.end(a)
a<-table.row.start(a)
a<-table.element(a, 'Multiple Linear Regression - Residual Statistics', 2, TRUE)
a<-table.row.end(a)
a<-table.row.start(a)
a<-table.element(a, 'Residual Standard Deviation',1,TRUE)
a<-table.element(a, mysum$sigma)
a<-table.row.end(a)
a<-table.row.start(a)
a<-table.element(a, 'Sum Squared Residuals',1,TRUE)
a<-table.element(a, sum(myerror*myerror))
a<-table.row.end(a)
a<-table.end(a)
table.save(a,file='mytable3.tab')
a<-table.start()
a<-table.row.start(a)
a<-table.element(a, 'Multiple Linear Regression - Actuals, Interpolation, and Residuals', 4, TRUE)
a<-table.row.end(a)
a<-table.row.start(a)
a<-table.element(a, 'Time or Index', 1, TRUE)
a<-table.element(a, 'Actuals', 1, TRUE)
a<-table.element(a, 'Interpolation
Forecast', 1, TRUE)
a<-table.element(a, 'Residuals
Prediction Error', 1, TRUE)
a<-table.row.end(a)
for (i in 1:n) {
a<-table.row.start(a)
a<-table.element(a,i, 1, TRUE)
a<-table.element(a,x[i])
a<-table.element(a,x[i]-mysum$resid[i])
a<-table.element(a,mysum$resid[i])
a<-table.row.end(a)
}
a<-table.end(a)
table.save(a,file='mytable4.tab')
if (n > n25) {
a<-table.start()
a<-table.row.start(a)
a<-table.element(a,'Goldfeld-Quandt test for Heteroskedasticity',4,TRUE)
a<-table.row.end(a)
a<-table.row.start(a)
a<-table.element(a,'p-values',header=TRUE)
a<-table.element(a,'Alternative Hypothesis',3,header=TRUE)
a<-table.row.end(a)
a<-table.row.start(a)
a<-table.element(a,'breakpoint index',header=TRUE)
a<-table.element(a,'greater',header=TRUE)
a<-table.element(a,'2-sided',header=TRUE)
a<-table.element(a,'less',header=TRUE)
a<-table.row.end(a)
for (mypoint in kp3:nmkm3) {
a<-table.row.start(a)
a<-table.element(a,mypoint,header=TRUE)
a<-table.element(a,gqarr[mypoint-kp3+1,1])
a<-table.element(a,gqarr[mypoint-kp3+1,2])
a<-table.element(a,gqarr[mypoint-kp3+1,3])
a<-table.row.end(a)
}
a<-table.end(a)
table.save(a,file='mytable5.tab')
a<-table.start()
a<-table.row.start(a)
a<-table.element(a,'Meta Analysis of Goldfeld-Quandt test for Heteroskedasticity',4,TRUE)
a<-table.row.end(a)
a<-table.row.start(a)
a<-table.element(a,'Description',header=TRUE)
a<-table.element(a,'# significant tests',header=TRUE)
a<-table.element(a,'% significant tests',header=TRUE)
a<-table.element(a,'OK/NOK',header=TRUE)
a<-table.row.end(a)
a<-table.row.start(a)
a<-table.element(a,'1% type I error level',header=TRUE)
a<-table.element(a,numsignificant1)
a<-table.element(a,numsignificant1/numgqtests)
if (numsignificant1/numgqtests < 0.01) dum <- 'OK' else dum <- 'NOK'
a<-table.element(a,dum)
a<-table.row.end(a)
a<-table.row.start(a)
a<-table.element(a,'5% type I error level',header=TRUE)
a<-table.element(a,numsignificant5)
a<-table.element(a,numsignificant5/numgqtests)
if (numsignificant5/numgqtests < 0.05) dum <- 'OK' else dum <- 'NOK'
a<-table.element(a,dum)
a<-table.row.end(a)
a<-table.row.start(a)
a<-table.element(a,'10% type I error level',header=TRUE)
a<-table.element(a,numsignificant10)
a<-table.element(a,numsignificant10/numgqtests)
if (numsignificant10/numgqtests < 0.1) dum <- 'OK' else dum <- 'NOK'
a<-table.element(a,dum)
a<-table.row.end(a)
a<-table.end(a)
table.save(a,file='mytable6.tab')
}