| Multiple Linear Regression - Estimated Regression Equation |
| inflatie[t] = + 1.26580173511677 + 0.165894330966839inflatie_levensmiddelen[t] -0.0127896258874350M1[t] -0.0494717392680991M2[t] -0.00615385264876214M3[t] -0.149471739268099M4[t] + 0.0203892403059319M5[t] + 0.073660786783279M6[t] + 0.0470250135446055M7[t] + 0.0536607867832790M8[t] + 0.113660786783279M9[t] + 0.0202965600219525M10[t] + 0.100296560021952M11[t] + e[t] |
| Multiple Linear Regression - Ordinary Least Squares | |||||
| Variable | Parameter | S.D. | T-STAT H0: parameter = 0 | 2-tail p-value | 1-tail p-value |
| (Intercept) | 1.26580173511677 | 0.21735 | 5.8238 | 1e-06 | 0 |
| inflatie_levensmiddelen | 0.165894330966839 | 0.021002 | 7.899 | 0 | 0 |
| M1 | -0.0127896258874350 | 0.26568 | -0.0481 | 0.961814 | 0.480907 |
| M2 | -0.0494717392680991 | 0.265693 | -0.1862 | 0.853107 | 0.426554 |
| M3 | -0.00615385264876214 | 0.265706 | -0.0232 | 0.981623 | 0.490811 |
| M4 | -0.149471739268099 | 0.265693 | -0.5626 | 0.576457 | 0.288229 |
| M5 | 0.0203892403059319 | 0.265838 | 0.0767 | 0.939196 | 0.469598 |
| M6 | 0.073660786783279 | 0.265919 | 0.277 | 0.783018 | 0.391509 |
| M7 | 0.0470250135446055 | 0.265877 | 0.1769 | 0.860389 | 0.430195 |
| M8 | 0.0536607867832790 | 0.265919 | 0.2018 | 0.840968 | 0.420484 |
| M9 | 0.113660786783279 | 0.265919 | 0.4274 | 0.671064 | 0.335532 |
| M10 | 0.0202965600219525 | 0.265964 | 0.0763 | 0.939501 | 0.46975 |
| M11 | 0.100296560021952 | 0.265964 | 0.3771 | 0.707829 | 0.353915 |
| Multiple Linear Regression - Regression Statistics | |
| Multiple R | 0.76178189947505 |
| R-squared | 0.580311662367816 |
| Adjusted R-squared | 0.470827748202899 |
| F-TEST (value) | 5.30042853138848 |
| F-TEST (DF numerator) | 12 |
| F-TEST (DF denominator) | 46 |
| p-value | 1.6074668327537e-05 |
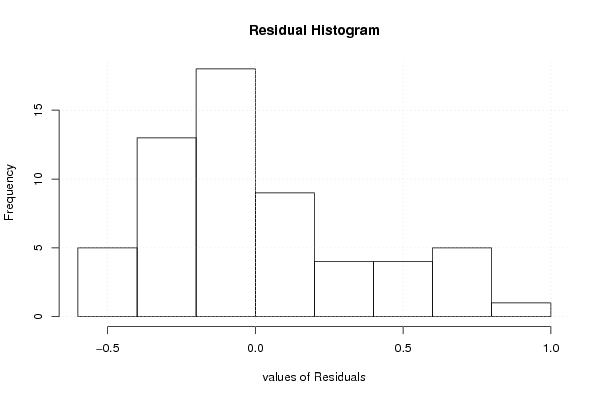
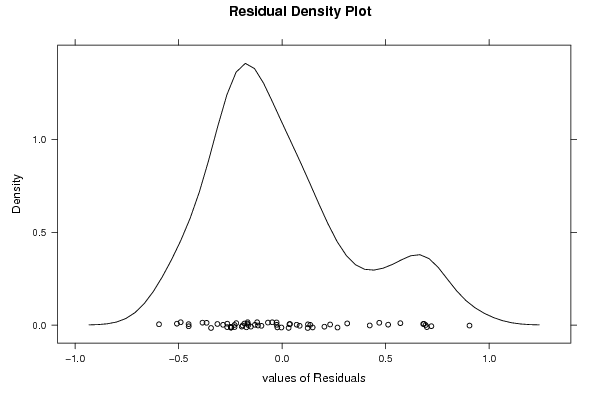
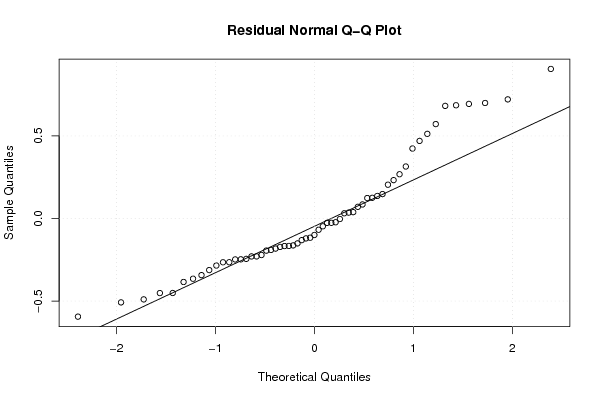
| Multiple Linear Regression - Residual Statistics | |
| Residual Standard Deviation | 0.395878426184873 |
| Sum Squared Residuals | 7.20910750265615 |
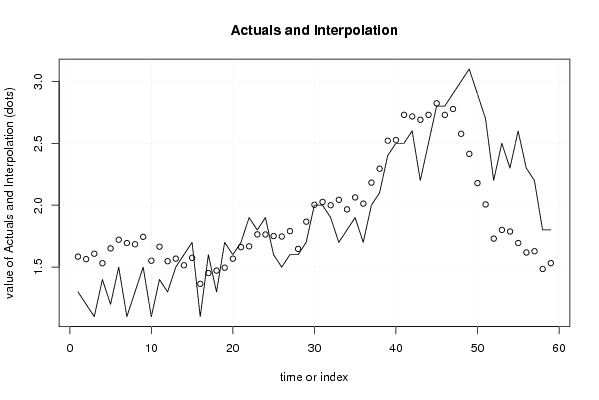
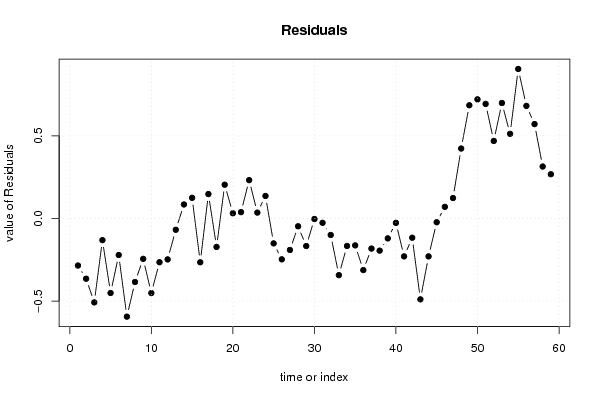
| Multiple Linear Regression - Actuals, Interpolation, and Residuals | |||
| Time or Index | Actuals | Interpolation Forecast | Residuals Prediction Error |
| 1 | 1.3 | 1.58480077116300 | -0.284800771163005 |
| 2 | 1.2 | 1.56470809087903 | -0.364708090879029 |
| 3 | 1.1 | 1.60802597749836 | -0.508025977498364 |
| 4 | 1.4 | 1.53106582326576 | -0.131065823265763 |
| 5 | 1.2 | 1.65115850354974 | -0.451158503549743 |
| 6 | 1.5 | 1.72101948312377 | -0.221019483123773 |
| 7 | 1.1 | 1.6943837098851 | -0.5943837098851 |
| 8 | 1.3 | 1.68443005002709 | -0.384430050027089 |
| 9 | 1.5 | 1.74443005002709 | -0.244430050027089 |
| 10 | 1.1 | 1.55152922468566 | -0.451529224685660 |
| 11 | 1.4 | 1.66470809087903 | -0.264708090879027 |
| 12 | 1.3 | 1.54782209776039 | -0.247822097760391 |
| 13 | 1.5 | 1.56821133806632 | -0.0682113380663236 |
| 14 | 1.6 | 1.51493979158898 | 0.0850602084110244 |
| 15 | 1.7 | 1.57484711130500 | 0.125152888695004 |
| 16 | 1.1 | 1.36517149229892 | -0.265171492298924 |
| 17 | 1.6 | 1.45208530638954 | 0.147914693610464 |
| 18 | 1.3 | 1.47217798667352 | -0.172177986673515 |
| 19 | 1.7 | 1.49531051272489 | 0.204689487275107 |
| 20 | 1.6 | 1.56830401835030 | 0.0316959816496978 |
| 21 | 1.7 | 1.66148288454367 | 0.0385171154563299 |
| 22 | 1.9 | 1.66765525636245 | 0.232344743637553 |
| 23 | 1.8 | 1.76424468945913 | 0.0357553105408696 |
| 24 | 1.9 | 1.76348472801728 | 0.136515271982719 |
| 25 | 1.6 | 1.75069510212985 | -0.150695102129846 |
| 26 | 1.5 | 1.74719185494255 | -0.247191854942550 |
| 27 | 1.6 | 1.79050974156189 | -0.190509741561886 |
| 28 | 1.6 | 1.64719185494255 | -0.0471918549425498 |
| 29 | 1.7 | 1.86682113380663 | -0.166821133806632 |
| 30 | 2 | 2.0030398457674 | -0.00303984576739860 |
| 31 | 2 | 2.02617237181878 | -0.0261723718187767 |
| 32 | 1.9 | 1.99962927886408 | -0.0996292788640825 |
| 33 | 1.7 | 2.0430398457674 | -0.343039845767399 |
| 34 | 1.8 | 1.96626505210276 | -0.166265052102756 |
| 35 | 1.9 | 2.06285448519944 | -0.16285448519944 |
| 36 | 1.7 | 2.01232622446754 | -0.312326224467539 |
| 37 | 2 | 2.18202036264363 | -0.182020362643626 |
| 38 | 2.1 | 2.29464314713312 | -0.194643147133117 |
| 39 | 2.4 | 2.52044479781598 | -0.120444797815976 |
| 40 | 2.5 | 2.52643180906679 | -0.0264318090667941 |
| 41 | 2.5 | 2.72947165483419 | -0.229471654834193 |
| 42 | 2.6 | 2.71638546892480 | -0.116385468924804 |
| 43 | 2.2 | 2.68974969568613 | -0.489749695686131 |
| 44 | 2.5 | 2.72956433511817 | -0.229564335118172 |
| 45 | 2.8 | 2.82274320131154 | -0.02274320131154 |
| 46 | 2.8 | 2.72937897455021 | 0.0706210254497865 |
| 47 | 2.9 | 2.77620010835685 | 0.123799891643154 |
| 48 | 3 | 2.57636694975479 | 0.42363305024521 |
| 49 | 3.1 | 2.4142724259972 | 0.6857275740028 |
| 50 | 2.9 | 2.17851711545633 | 0.72148288454367 |
| 51 | 2.7 | 2.00617237181878 | 0.693827628181223 |
| 52 | 2.2 | 1.73013902042597 | 0.469860979574031 |
| 53 | 2.5 | 1.80046340141990 | 0.699536598580103 |
| 54 | 2.3 | 1.78737721551051 | 0.512622784489492 |
| 55 | 2.6 | 1.6943837098851 | 0.9056162901149 |
| 56 | 2.3 | 1.61807231764035 | 0.681927682359646 |
| 57 | 2.2 | 1.62830401835030 | 0.571695981649698 |
| 58 | 1.8 | 1.48517149229892 | 0.314828507701076 |
| 59 | 1.8 | 1.53199262610556 | 0.268007373894444 |
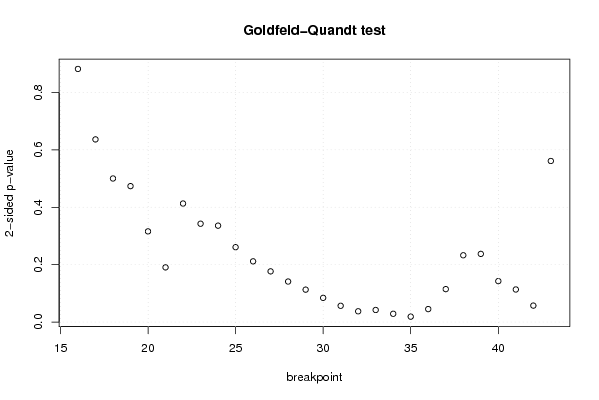
| Goldfeld-Quandt test for Heteroskedasticity | |||
| p-values | Alternative Hypothesis | ||
| breakpoint index | greater | 2-sided | less |
| 16 | 0.440928768546686 | 0.881857537093371 | 0.559071231453314 |
| 17 | 0.318219880421505 | 0.636439760843009 | 0.681780119578495 |
| 18 | 0.25012387443636 | 0.50024774887272 | 0.74987612556364 |
| 19 | 0.236813924404655 | 0.47362784880931 | 0.763186075595345 |
| 20 | 0.157940324320193 | 0.315880648640385 | 0.842059675679807 |
| 21 | 0.0953023013185387 | 0.190604602637077 | 0.904697698681461 |
| 22 | 0.206486668889432 | 0.412973337778864 | 0.793513331110568 |
| 23 | 0.171323013836142 | 0.342646027672284 | 0.828676986163858 |
| 24 | 0.167924507425948 | 0.335849014851897 | 0.832075492574052 |
| 25 | 0.130445543862962 | 0.260891087725924 | 0.869554456137038 |
| 26 | 0.105777965521626 | 0.211555931043252 | 0.894222034478374 |
| 27 | 0.0883131803212159 | 0.176626360642432 | 0.911686819678784 |
| 28 | 0.0705901300797084 | 0.141180260159417 | 0.929409869920292 |
| 29 | 0.0564828563773212 | 0.112965712754642 | 0.943517143622679 |
| 30 | 0.0421569950515462 | 0.0843139901030924 | 0.957843004948454 |
| 31 | 0.0283329921709857 | 0.0566659843419715 | 0.971667007829014 |
| 32 | 0.0187653215609916 | 0.0375306431219833 | 0.981234678439008 |
| 33 | 0.0210149615479833 | 0.0420299230959666 | 0.978985038452017 |
| 34 | 0.0144054760887002 | 0.0288109521774003 | 0.9855945239113 |
| 35 | 0.00941824995907587 | 0.0188364999181517 | 0.990581750040924 |
| 36 | 0.0225949267378478 | 0.0451898534756955 | 0.977405073262152 |
| 37 | 0.0573789028743482 | 0.114757805748696 | 0.942621097125652 |
| 38 | 0.116336835418457 | 0.232673670836913 | 0.883663164581543 |
| 39 | 0.118766031277349 | 0.237532062554698 | 0.88123396872265 |
| 40 | 0.0712938348058931 | 0.142587669611786 | 0.928706165194107 |
| 41 | 0.0567607807066243 | 0.113521561413249 | 0.943239219293376 |
| 42 | 0.0286700793237157 | 0.0573401586474313 | 0.971329920676284 |
| 43 | 0.280612585874457 | 0.561225171748914 | 0.719387414125543 |
| Meta Analysis of Goldfeld-Quandt test for Heteroskedasticity | |||
| Description | # significant tests | % significant tests | OK/NOK |
| 1% type I error level | 0 | 0 | OK |
| 5% type I error level | 5 | 0.178571428571429 | NOK |
| 10% type I error level | 8 | 0.285714285714286 | NOK |