| Multiple Linear Regression - Estimated Regression Equation |
| Y[t] = + 128.755416666667 + 12.9404166666667X[t] -5.35740277777782M1[t] -0.641638888888884M2[t] + 3.70612499999999M3[t] + 5.85188888888888M4[t] + 2.17165277777778M5[t] -1.76258333333333M6[t] -7.69481944444444M7[t] -3.91905555555555M8[t] -1.19529166666666M9[t] + 6.51447222222222M10[t] + 2.57223611111111M11[t] -0.0397638888888885t + e[t] |
| Multiple Linear Regression - Ordinary Least Squares | |||||
| Variable | Parameter | S.D. | T-STAT H0: parameter = 0 | 2-tail p-value | 1-tail p-value |
| (Intercept) | 128.755416666667 | 3.691113 | 34.8825 | 0 | 0 |
| X | 12.9404166666667 | 3.034076 | 4.265 | 9.8e-05 | 4.9e-05 |
| M1 | -5.35740277777782 | 4.277103 | -1.2526 | 0.21669 | 0.108345 |
| M2 | -0.641638888888884 | 4.264529 | -0.1505 | 0.88106 | 0.44053 |
| M3 | 3.70612499999999 | 4.253121 | 0.8714 | 0.388067 | 0.194033 |
| M4 | 5.85188888888888 | 4.242888 | 1.3792 | 0.174495 | 0.087248 |
| M5 | 2.17165277777778 | 4.233838 | 0.5129 | 0.610456 | 0.305228 |
| M6 | -1.76258333333333 | 4.225979 | -0.4171 | 0.678558 | 0.339279 |
| M7 | -7.69481944444444 | 4.219318 | -1.8237 | 0.074696 | 0.037348 |
| M8 | -3.91905555555555 | 4.21386 | -0.93 | 0.357206 | 0.178603 |
| M9 | -1.19529166666666 | 4.20961 | -0.2839 | 0.777728 | 0.388864 |
| M10 | 6.51447222222222 | 4.206571 | 1.5486 | 0.128321 | 0.064161 |
| M11 | 2.57223611111111 | 4.204747 | 0.6117 | 0.543718 | 0.271859 |
| t | -0.0397638888888885 | 0.071514 | -0.556 | 0.580885 | 0.290442 |
| Multiple Linear Regression - Regression Statistics | |
| Multiple R | 0.734406514839355 |
| R-squared | 0.539352929038487 |
| Adjusted R-squared | 0.40917006115806 |
| F-TEST (value) | 4.14304076888121 |
| F-TEST (DF numerator) | 13 |
| F-TEST (DF denominator) | 46 |
| p-value | 0.000163786037073121 |
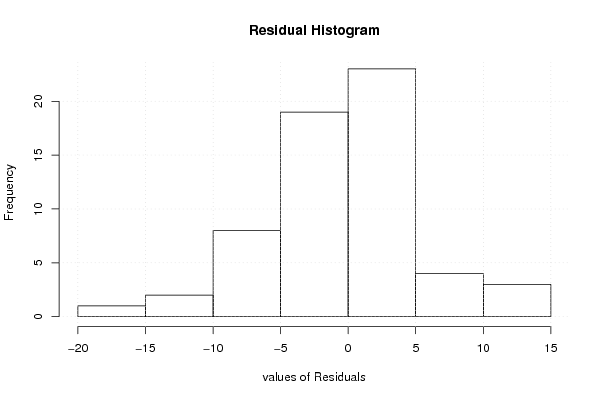
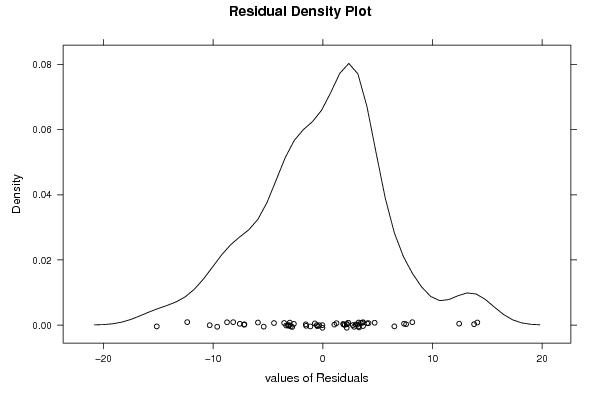
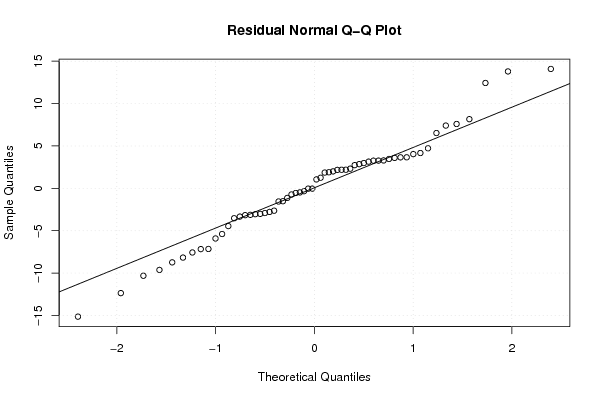
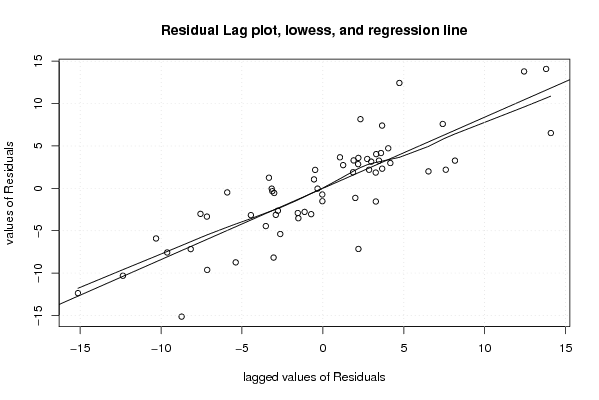
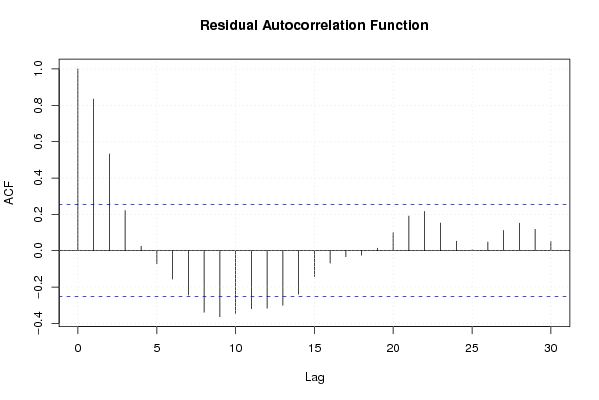
| Multiple Linear Regression - Residual Statistics | |
| Residual Standard Deviation | 6.64732770487073 |
| Sum Squared Residuals | 2032.60041833333 |
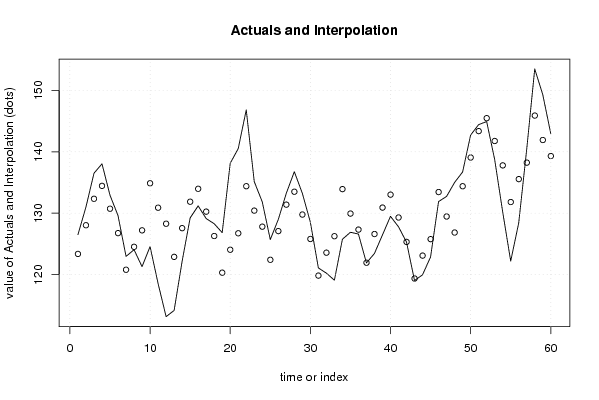
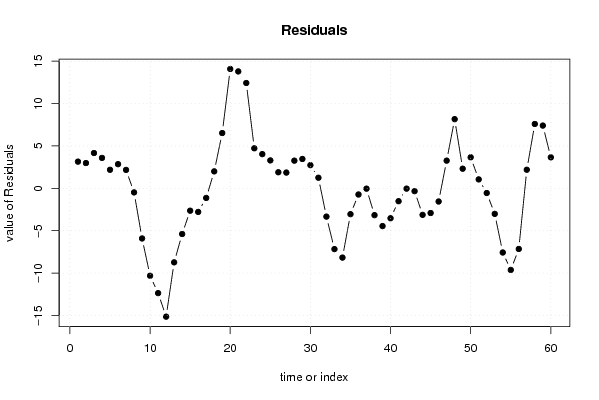
| Multiple Linear Regression - Actuals, Interpolation, and Residuals | |||
| Time or Index | Actuals | Interpolation Forecast | Residuals Prediction Error |
| 1 | 126.51 | 123.358250000000 | 3.1517499999998 |
| 2 | 131.02 | 128.03425 | 2.98575 |
| 3 | 136.51 | 132.34225 | 4.16775000000001 |
| 4 | 138.04 | 134.44825 | 3.59174999999999 |
| 5 | 132.92 | 130.72825 | 2.19175000000001 |
| 6 | 129.61 | 126.75425 | 2.85575000000003 |
| 7 | 122.96 | 120.78225 | 2.17775000000002 |
| 8 | 124.04 | 124.51825 | -0.478249999999984 |
| 9 | 121.29 | 127.20225 | -5.91224999999999 |
| 10 | 124.56 | 134.87225 | -10.3122500000000 |
| 11 | 118.53 | 130.89025 | -12.3602500000000 |
| 12 | 113.14 | 128.27825 | -15.13825 |
| 13 | 114.15 | 122.881083333333 | -8.73108333333327 |
| 14 | 122.17 | 127.557083333333 | -5.38708333333332 |
| 15 | 129.23 | 131.865083333333 | -2.63508333333333 |
| 16 | 131.19 | 133.971083333333 | -2.78108333333333 |
| 17 | 129.12 | 130.251083333333 | -1.13108333333333 |
| 18 | 128.28 | 126.277083333333 | 2.00291666666667 |
| 19 | 126.83 | 120.305083333333 | 6.52491666666667 |
| 20 | 138.13 | 124.041083333333 | 14.0889166666667 |
| 21 | 140.52 | 126.725083333333 | 13.7949166666667 |
| 22 | 146.83 | 134.395083333333 | 12.4349166666667 |
| 23 | 135.14 | 130.413083333333 | 4.72691666666666 |
| 24 | 131.84 | 127.801083333333 | 4.03891666666667 |
| 25 | 125.7 | 122.403916666667 | 3.29608333333338 |
| 26 | 128.98 | 127.079916666667 | 1.90008333333333 |
| 27 | 133.25 | 131.387916666667 | 1.86208333333334 |
| 28 | 136.76 | 133.493916666667 | 3.26608333333333 |
| 29 | 133.24 | 129.773916666667 | 3.46608333333334 |
| 30 | 128.54 | 125.799916666667 | 2.74008333333332 |
| 31 | 121.08 | 119.827916666667 | 1.25208333333333 |
| 32 | 120.23 | 123.563916666667 | -3.33391666666666 |
| 33 | 119.08 | 126.247916666667 | -7.16791666666667 |
| 34 | 125.75 | 133.917916666667 | -8.16791666666666 |
| 35 | 126.89 | 129.935916666667 | -3.04591666666666 |
| 36 | 126.6 | 127.323916666667 | -0.723916666666674 |
| 37 | 121.89 | 121.92675 | -0.0367499999999588 |
| 38 | 123.44 | 126.60275 | -3.16275 |
| 39 | 126.46 | 130.91075 | -4.45075000000001 |
| 40 | 129.49 | 133.01675 | -3.52674999999999 |
| 41 | 127.78 | 129.29675 | -1.51675000000001 |
| 42 | 125.29 | 125.32275 | -0.0327500000000041 |
| 43 | 119.02 | 119.35075 | -0.330750000000012 |
| 44 | 119.96 | 123.08675 | -3.12675000000001 |
| 45 | 122.86 | 125.77075 | -2.91075000000001 |
| 46 | 131.89 | 133.44075 | -1.55075000000002 |
| 47 | 132.73 | 129.45875 | 3.27124999999998 |
| 48 | 135.01 | 126.84675 | 8.16324999999999 |
| 49 | 136.71 | 134.39 | 2.32000000000005 |
| 50 | 142.73 | 139.066 | 3.66399999999999 |
| 51 | 144.43 | 143.374 | 1.05600000000000 |
| 52 | 144.93 | 145.48 | -0.549999999999996 |
| 53 | 138.75 | 141.76 | -3.01000000000001 |
| 54 | 130.22 | 137.786 | -7.56600000000001 |
| 55 | 122.19 | 131.814 | -9.62400000000001 |
| 56 | 128.4 | 135.55 | -7.15 |
| 57 | 140.43 | 138.234 | 2.196 |
| 58 | 153.5 | 145.904 | 7.596 |
| 59 | 149.33 | 141.922 | 7.408 |
| 60 | 142.97 | 139.31 | 3.65999999999999 |
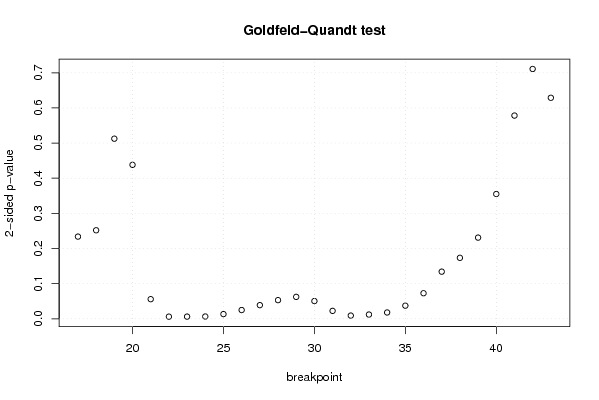
| Goldfeld-Quandt test for Heteroskedasticity | |||
| p-values | Alternative Hypothesis | ||
| breakpoint index | greater | 2-sided | less |
| 17 | 0.116948266371262 | 0.233896532742524 | 0.883051733628738 |
| 18 | 0.125961692498477 | 0.251923384996954 | 0.874038307501523 |
| 19 | 0.256280376398446 | 0.512560752796891 | 0.743719623601554 |
| 20 | 0.78092591987831 | 0.438148160243379 | 0.219074080121689 |
| 21 | 0.972091337643814 | 0.0558173247123718 | 0.0279086623561859 |
| 22 | 0.996966342313464 | 0.00606731537307173 | 0.00303365768653586 |
| 23 | 0.996902287756044 | 0.00619542448791248 | 0.00309771224395624 |
| 24 | 0.9967561021174 | 0.00648779576519867 | 0.00324389788259934 |
| 25 | 0.993332425268704 | 0.0133351494625916 | 0.00666757473129582 |
| 26 | 0.987584541974307 | 0.024830916051385 | 0.0124154580256925 |
| 27 | 0.9805965092332 | 0.0388069815336011 | 0.0194034907668006 |
| 28 | 0.973458804843195 | 0.0530823903136104 | 0.0265411951568052 |
| 29 | 0.968804126751367 | 0.0623917464972652 | 0.0311958732486326 |
| 30 | 0.974786252718018 | 0.0504274945639638 | 0.0252137472819819 |
| 31 | 0.988738562956903 | 0.0225228740861935 | 0.0112614370430967 |
| 32 | 0.995459934898556 | 0.0090801302028882 | 0.0045400651014441 |
| 33 | 0.993981182185392 | 0.0120376356292158 | 0.00601881781460791 |
| 34 | 0.991016089062122 | 0.0179678218757567 | 0.00898391093787835 |
| 35 | 0.981335363768336 | 0.037329272463328 | 0.018664636231664 |
| 36 | 0.963617040720655 | 0.0727659185586891 | 0.0363829592793445 |
| 37 | 0.93293827600066 | 0.134123447998680 | 0.0670617239993402 |
| 38 | 0.91324912848744 | 0.173501743025119 | 0.0867508715125594 |
| 39 | 0.884499205513813 | 0.231001588972374 | 0.115500794486187 |
| 40 | 0.82247787696611 | 0.355044246067781 | 0.177522123033891 |
| 41 | 0.710815088744368 | 0.578369822511263 | 0.289184911255632 |
| 42 | 0.644483397320951 | 0.711033205358098 | 0.355516602679049 |
| 43 | 0.685509707813074 | 0.628980584373852 | 0.314490292186926 |
| Meta Analysis of Goldfeld-Quandt test for Heteroskedasticity | |||
| Description | # significant tests | % significant tests | OK/NOK |
| 1% type I error level | 4 | 0.148148148148148 | NOK |
| 5% type I error level | 11 | 0.407407407407407 | NOK |
| 10% type I error level | 16 | 0.592592592592593 | NOK |