| Multiple Linear Regression - Estimated Regression Equation |
| Y[t] = + 116.597165706393 + 21.2164030996859X[t] -16.3844866073163M1[t] -11.5185960744808M2[t] -11.6965980755825M3[t] -7.19841447468412M4[t] -23.5563893078486M5[t] -7.31310291507592M6[t] -12.7531787022404M7[t] -12.8490423714049M8[t] + 0.915369317430634M9[t] -13.0923114136710M10[t] -6.41047327089834M11[t] -0.250898186835515t + e[t] |
| Multiple Linear Regression - Ordinary Least Squares | |||||
| Variable | Parameter | S.D. | T-STAT H0: parameter = 0 | 2-tail p-value | 1-tail p-value |
| (Intercept) | 116.597165706393 | 8.692869 | 13.413 | 0 | 0 |
| X | 21.2164030996859 | 4.775629 | 4.4426 | 5.5e-05 | 2.8e-05 |
| M1 | -16.3844866073163 | 8.017077 | -2.0437 | 0.046734 | 0.023367 |
| M2 | -11.5185960744808 | 7.996703 | -1.4404 | 0.156521 | 0.078261 |
| M3 | -11.6965980755825 | 7.767435 | -1.5059 | 0.138942 | 0.069471 |
| M4 | -7.19841447468412 | 7.660879 | -0.9396 | 0.352314 | 0.176157 |
| M5 | -23.5563893078486 | 7.65157 | -3.0786 | 0.003501 | 0.00175 |
| M6 | -7.31310291507592 | 7.727571 | -0.9464 | 0.348907 | 0.174454 |
| M7 | -12.7531787022404 | 7.716701 | -1.6527 | 0.105208 | 0.052604 |
| M8 | -12.8490423714049 | 7.707049 | -1.6672 | 0.102274 | 0.051137 |
| M9 | 0.915369317430634 | 7.698619 | 0.1189 | 0.905872 | 0.452936 |
| M10 | -13.0923114136710 | 7.623575 | -1.7173 | 0.092643 | 0.046321 |
| M11 | -6.41047327089834 | 7.685441 | -0.8341 | 0.408532 | 0.204266 |
| t | -0.250898186835515 | 0.097482 | -2.5738 | 0.013346 | 0.006673 |
| Multiple Linear Regression - Regression Statistics | |
| Multiple R | 0.745176801073555 |
| R-squared | 0.555288464858216 |
| Adjusted R-squared | 0.429609117970321 |
| F-TEST (value) | 4.4182952776921 |
| F-TEST (DF numerator) | 13 |
| F-TEST (DF denominator) | 46 |
| p-value | 8.43903345039143e-05 |
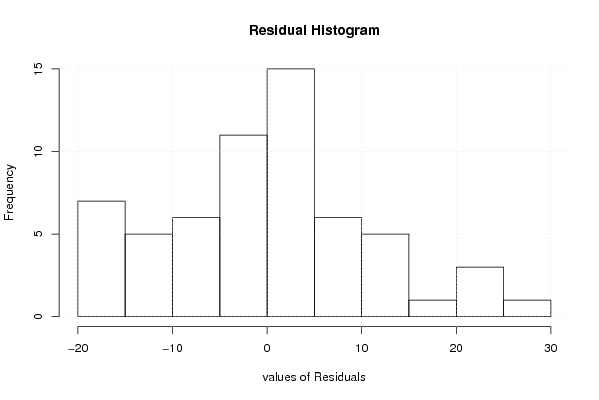
| Multiple Linear Regression - Residual Statistics | |
| Residual Standard Deviation | 12.0499880817301 |
| Sum Squared Residuals | 6679.3017874125 |
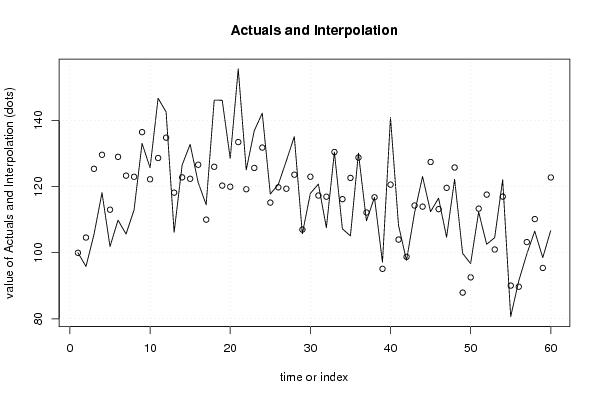
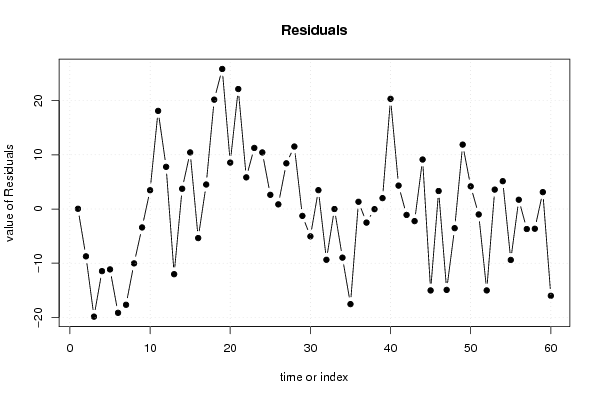
| Multiple Linear Regression - Actuals, Interpolation, and Residuals | |||
| Time or Index | Actuals | Interpolation Forecast | Residuals Prediction Error |
| 1 | 100 | 99.961780912241 | 0.038219087758995 |
| 2 | 95.84395716 | 104.576773258241 | -8.7328160982408 |
| 3 | 105.5073942 | 125.364276169990 | -19.8568819699895 |
| 4 | 118.1540031 | 129.611561584052 | -11.4575584840524 |
| 5 | 101.8612953 | 113.002688564052 | -11.1413932640523 |
| 6 | 109.8419174 | 128.995076769990 | -19.1531593699895 |
| 7 | 105.6348802 | 123.304102795990 | -17.6692225959895 |
| 8 | 112.927078 | 122.957340939990 | -10.0302629399895 |
| 9 | 133.0698623 | 136.470854441990 | -3.40099214198950 |
| 10 | 125.6756757 | 122.212275524052 | 3.46340017594767 |
| 11 | 146.736359 | 128.643215479990 | 18.0931435200105 |
| 12 | 142.5803162 | 134.802790564052 | 7.77752563594764 |
| 13 | 106.1448241 | 118.167405769900 | -12.0225816699005 |
| 14 | 126.5170831 | 122.782398115901 | 3.73468498409947 |
| 15 | 132.7893932 | 122.353497927963 | 10.4358952720367 |
| 16 | 121.2391637 | 126.600783342026 | -5.36161964202617 |
| 17 | 114.5079041 | 109.991910322026 | 4.51599377797383 |
| 18 | 146.1499235 | 125.984298527963 | 20.1656249720367 |
| 19 | 146.1244263 | 120.293324553963 | 25.8311017460367 |
| 20 | 128.5058644 | 119.946562697963 | 8.55930170203665 |
| 21 | 155.5838858 | 133.460076199963 | 22.1238096000366 |
| 22 | 125.0382458 | 119.201497282026 | 5.83674851797382 |
| 23 | 136.8944416 | 125.632437237963 | 11.2620043620366 |
| 24 | 142.2233554 | 131.792012322026 | 10.4313430779738 |
| 25 | 117.7715451 | 115.156627527874 | 2.61491757212569 |
| 26 | 120.627231 | 119.771619873874 | 0.855611126125644 |
| 27 | 127.7664457 | 119.342719685937 | 8.42372601406283 |
| 28 | 135.1096379 | 123.5900051 | 11.5196328 |
| 29 | 105.7113717 | 106.98113208 | -1.26976038000000 |
| 30 | 117.9245283 | 122.973520285937 | -5.04899198593717 |
| 31 | 120.754717 | 117.282546311937 | 3.47217068806282 |
| 32 | 107.572667 | 116.935784455937 | -9.36311745593718 |
| 33 | 130.4436512 | 130.449297957937 | -0.00564675793717828 |
| 34 | 107.2157063 | 116.19071904 | -8.97501274000001 |
| 35 | 105.0739419 | 122.621658995937 | -17.5477170959372 |
| 36 | 130.1121877 | 128.78123408 | 1.33095361999999 |
| 37 | 109.6379398 | 112.145849285848 | -2.50790948584814 |
| 38 | 116.7261601 | 116.760841631848 | -0.0346815318481742 |
| 39 | 97.11881693 | 95.1155383442251 | 2.00327858577489 |
| 40 | 140.8975013 | 120.579226857974 | 20.3182744420262 |
| 41 | 108.2865885 | 103.970353837974 | 4.31623466202616 |
| 42 | 97.65425803 | 98.7463389442251 | -1.09208091422512 |
| 43 | 112.0346762 | 114.271768069911 | -2.23709186991100 |
| 44 | 123.0494646 | 113.925006213911 | 9.12445838608899 |
| 45 | 112.4171341 | 127.438519715911 | -15.021385615911 |
| 46 | 116.4966854 | 113.179940797974 | 3.31674460202618 |
| 47 | 104.6914839 | 119.610880753911 | -14.919396853911 |
| 48 | 122.2335543 | 125.770455837974 | -3.53690153797383 |
| 49 | 99.79602244 | 87.918667944136 | 11.8773544958639 |
| 50 | 96.71086181 | 92.5336602901361 | 4.17720151986388 |
| 51 | 112.3151453 | 113.321163201885 | -1.00601790188483 |
| 52 | 102.5497195 | 117.568448615948 | -15.0187291159477 |
| 53 | 104.5385008 | 100.959575595948 | 3.57892520405234 |
| 54 | 122.0805711 | 116.951963801885 | 5.12860729811517 |
| 55 | 80.64762876 | 90.044586728199 | -9.39695796819894 |
| 56 | 91.40744518 | 89.697824872199 | 1.70962030780106 |
| 57 | 99.51555329 | 103.211338374199 | -3.69578508419894 |
| 58 | 106.527282 | 110.169162555948 | -3.64188055594766 |
| 59 | 98.49566548 | 95.383699412199 | 3.11196606780106 |
| 60 | 106.7567568 | 122.759677595948 | -16.0029207959476 |
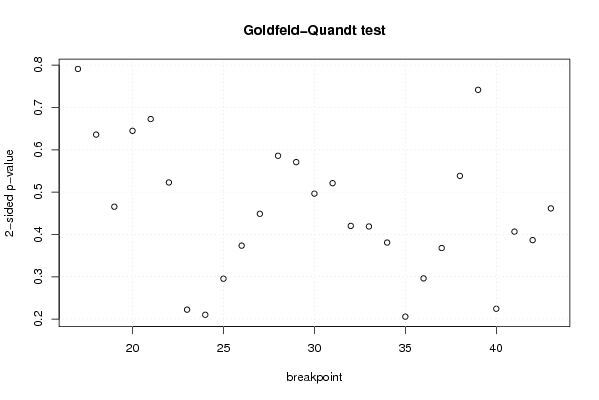
| Goldfeld-Quandt test for Heteroskedasticity | |||
| p-values | Alternative Hypothesis | ||
| breakpoint index | greater | 2-sided | less |
| 17 | 0.604552859462969 | 0.790894281074062 | 0.395447140537031 |
| 18 | 0.682095506616478 | 0.635808986767044 | 0.317904493383522 |
| 19 | 0.767262159361426 | 0.465475681277148 | 0.232737840638574 |
| 20 | 0.67762493180306 | 0.644750136393879 | 0.322375068196940 |
| 21 | 0.663723893525296 | 0.672552212949408 | 0.336276106474704 |
| 22 | 0.738617353631946 | 0.522765292736108 | 0.261382646368054 |
| 23 | 0.888823848279442 | 0.222352303441117 | 0.111176151720558 |
| 24 | 0.894857716236257 | 0.210284567527486 | 0.105142283763743 |
| 25 | 0.852270079434066 | 0.295459841131868 | 0.147729920565934 |
| 26 | 0.813244966565468 | 0.373510066869065 | 0.186755033434533 |
| 27 | 0.775606839528113 | 0.448786320943775 | 0.224393160471887 |
| 28 | 0.707073997843951 | 0.585852004312099 | 0.292926002156049 |
| 29 | 0.714600413342365 | 0.57079917331527 | 0.285399586657635 |
| 30 | 0.751815989439243 | 0.496368021121515 | 0.248184010560757 |
| 31 | 0.739462004762985 | 0.521075990474029 | 0.260537995237015 |
| 32 | 0.789918083266202 | 0.420163833467595 | 0.210081916733798 |
| 33 | 0.79060736499741 | 0.418785270005178 | 0.209392635002589 |
| 34 | 0.809586244861173 | 0.380827510277654 | 0.190413755138827 |
| 35 | 0.897084760127789 | 0.205830479744423 | 0.102915239872211 |
| 36 | 0.851878321099208 | 0.296243357801583 | 0.148121678900792 |
| 37 | 0.816065596072008 | 0.367868807855983 | 0.183934403927992 |
| 38 | 0.730846078721746 | 0.538307842556509 | 0.269153921278254 |
| 39 | 0.629217036628341 | 0.741565926743318 | 0.370782963371659 |
| 40 | 0.887788009738538 | 0.224423980522925 | 0.112211990261462 |
| 41 | 0.796686413522134 | 0.406627172955731 | 0.203313586477866 |
| 42 | 0.806702804769619 | 0.386594390460763 | 0.193297195230382 |
| 43 | 0.769224658496167 | 0.461550683007665 | 0.230775341503833 |
| Meta Analysis of Goldfeld-Quandt test for Heteroskedasticity | |||
| Description | # significant tests | % significant tests | OK/NOK |
| 1% type I error level | 0 | 0 | OK |
| 5% type I error level | 0 | 0 | OK |
| 10% type I error level | 0 | 0 | OK |