| Multiple Linear Regression - Estimated Regression Equation |
| Y[t] = + 1.11682006097517 -0.102335980692679X[t] + 1.09224433596786Y1[t] -0.180220978992785Y2[t] + 0.214398874249468Y3[t] -0.272382037219519Y4[t] -0.144229979838938M1[t] + 0.072857990135528M2[t] -0.189718701153859M3[t] + 0.0739143876135337M4[t] + 0.167717263342514M5[t] -0.0476955774918094M6[t] -0.00929293578842435M7[t] -0.168909399373597M8[t] -0.0269912290538317M9[t] -0.00817541421200658M10[t] -0.17472517625845M11[t] + 0.000282830471790956t + e[t] |
| Multiple Linear Regression - Ordinary Least Squares | |||||
| Variable | Parameter | S.D. | T-STAT H0: parameter = 0 | 2-tail p-value | 1-tail p-value |
| (Intercept) | 1.11682006097517 | 1.078162 | 1.0359 | 0.305684 | 0.152842 |
| X | -0.102335980692679 | 0.136555 | -0.7494 | 0.457425 | 0.228713 |
| Y1 | 1.09224433596786 | 0.140797 | 7.7576 | 0 | 0 |
| Y2 | -0.180220978992785 | 0.218295 | -0.8256 | 0.413301 | 0.20665 |
| Y3 | 0.214398874249468 | 0.223337 | 0.96 | 0.342085 | 0.171043 |
| Y4 | -0.272382037219519 | 0.155436 | -1.7524 | 0.086373 | 0.043187 |
| M1 | -0.144229979838938 | 0.312788 | -0.4611 | 0.646892 | 0.323446 |
| M2 | 0.072857990135528 | 0.31116 | 0.2341 | 0.815908 | 0.407954 |
| M3 | -0.189718701153859 | 0.312082 | -0.6079 | 0.546235 | 0.273118 |
| M4 | 0.0739143876135337 | 0.305004 | 0.2423 | 0.809595 | 0.404797 |
| M5 | 0.167717263342514 | 0.320694 | 0.523 | 0.603497 | 0.301748 |
| M6 | -0.0476955774918094 | 0.326547 | -0.1461 | 0.884512 | 0.442256 |
| M7 | -0.00929293578842435 | 0.320428 | -0.029 | 0.976989 | 0.488494 |
| M8 | -0.168909399373597 | 0.321012 | -0.5262 | 0.601292 | 0.300646 |
| M9 | -0.0269912290538317 | 0.317548 | -0.085 | 0.932631 | 0.466316 |
| M10 | -0.00817541421200658 | 0.318987 | -0.0256 | 0.979664 | 0.489832 |
| M11 | -0.17472517625845 | 0.319805 | -0.5463 | 0.587466 | 0.293733 |
| t | 0.000282830471790956 | 0.00537 | 0.0527 | 0.958223 | 0.479112 |
| Multiple Linear Regression - Regression Statistics | |
| Multiple R | 0.932553912003 |
| R-squared | 0.869656798792099 |
| Adjusted R-squared | 0.821486485302223 |
| F-TEST (value) | 18.0537915530665 |
| F-TEST (DF numerator) | 17 |
| F-TEST (DF denominator) | 46 |
| p-value | 6.66133814775094e-15 |
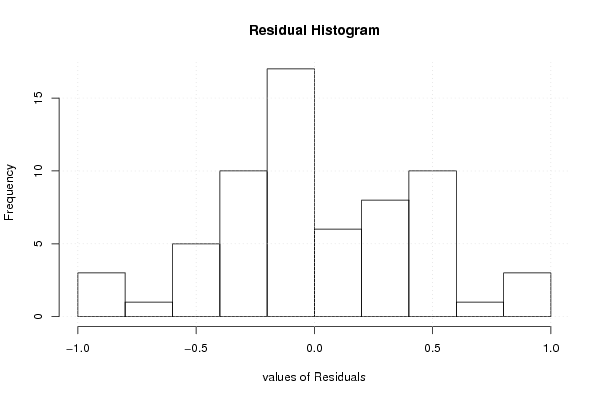
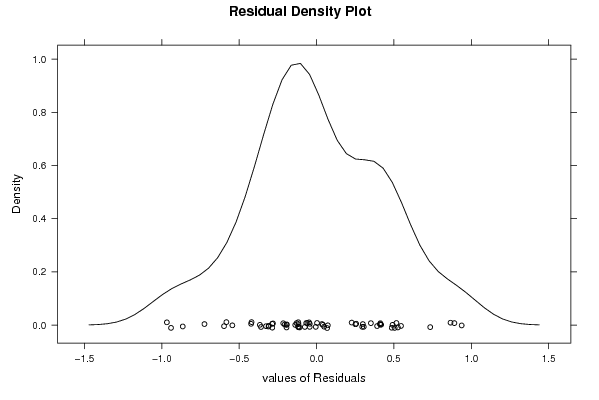
| Multiple Linear Regression - Residual Statistics | |
| Residual Standard Deviation | 0.500545103159913 |
| Sum Squared Residuals | 11.5250884136789 |
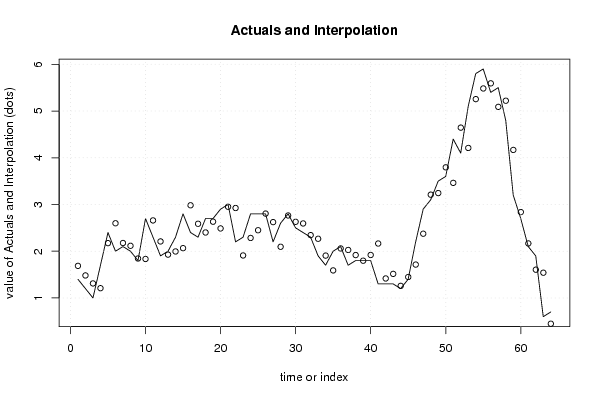
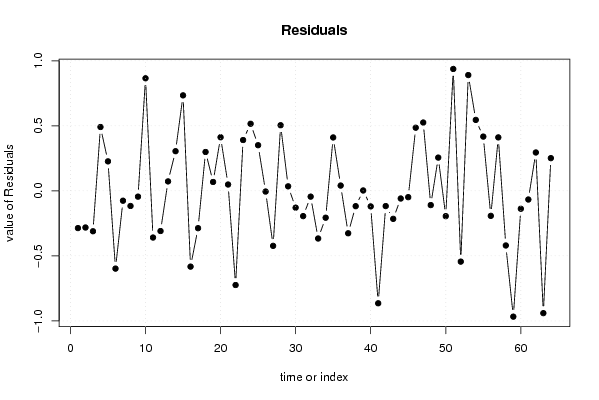
| Multiple Linear Regression - Actuals, Interpolation, and Residuals | |||
| Time or Index | Actuals | Interpolation Forecast | Residuals Prediction Error |
| 1 | 1.4 | 1.68625605907266 | -0.286256059072665 |
| 2 | 1.2 | 1.48186270216616 | -0.281862702166161 |
| 3 | 1 | 1.3109098776177 | -0.310909877617701 |
| 4 | 1.7 | 1.20906922361824 | 0.49093077638176 |
| 5 | 2.4 | 2.17330579131884 | 0.226694208681163 |
| 6 | 2 | 2.5979551653636 | -0.5979551653636 |
| 7 | 2.1 | 2.17580785658253 | -0.075807856582534 |
| 8 | 2 | 2.11626444230694 | -0.116264442306945 |
| 9 | 1.8 | 1.84455833777972 | -0.0445583377797183 |
| 10 | 2.7 | 1.83455730838887 | 0.865442691611132 |
| 11 | 2.3 | 2.65914357997548 | -0.359143579975483 |
| 12 | 1.9 | 2.20917980202786 | -0.309179802027864 |
| 13 | 2 | 1.92739150800058 | 0.0726084919994249 |
| 14 | 2.3 | 1.99517175044338 | 0.304828249556622 |
| 15 | 2.8 | 2.06572235770488 | 0.734277642295118 |
| 16 | 2.4 | 2.98278764775072 | -0.582787647750718 |
| 17 | 2.3 | 2.58694658862084 | -0.286946588620842 |
| 18 | 2.7 | 2.40109975449459 | 0.298900245505413 |
| 19 | 2.7 | 2.63182009836957 | 0.0681799016304323 |
| 20 | 2.9 | 2.48791100112193 | 0.412088998878067 |
| 21 | 3 | 2.95132502445953 | 0.0486749755404684 |
| 22 | 2.2 | 2.9244174946143 | -0.724417494614301 |
| 23 | 2.3 | 1.90921277121598 | 0.390787228784024 |
| 24 | 2.8 | 2.28411827857974 | 0.515881721420262 |
| 25 | 2.8 | 2.44904670003718 | 0.350953299962819 |
| 26 | 2.8 | 2.80541893011834 | -0.0054189301183389 |
| 27 | 2.2 | 2.62308630270352 | -0.423086302703524 |
| 28 | 2.6 | 2.09546460175223 | 0.504535398247767 |
| 29 | 2.8 | 2.76528142394362 | 0.0347185760563767 |
| 30 | 2.5 | 2.62927415304348 | -0.129274153043476 |
| 31 | 2.4 | 2.59436529293831 | -0.194365292938307 |
| 32 | 2.3 | 2.34450127409586 | -0.044501274095865 |
| 33 | 1.9 | 2.2664702714019 | -0.366470271401901 |
| 34 | 1.7 | 1.90650080783002 | -0.206500807830025 |
| 35 | 2 | 1.58943811888665 | 0.410561881113349 |
| 36 | 2.1 | 2.05940867815870 | 0.0405913218412957 |
| 37 | 1.7 | 2.02645911065915 | -0.326459110659154 |
| 38 | 1.8 | 1.917939746607 | -0.117939746607 |
| 39 | 1.8 | 1.79715118338093 | 0.00284881661906928 |
| 40 | 1.8 | 1.91981365322983 | -0.119813653229829 |
| 41 | 1.3 | 2.16475925788189 | -0.86475925788189 |
| 42 | 1.3 | 1.41720326809055 | -0.117203268090548 |
| 43 | 1.3 | 1.51529843555431 | -0.215298435554313 |
| 44 | 1.2 | 1.25899896338547 | -0.0589989633854662 |
| 45 | 1.4 | 1.44863374532853 | -0.0486337453285312 |
| 46 | 2.2 | 1.71443695380426 | 0.485563046195735 |
| 47 | 2.9 | 2.37471500584967 | 0.525284994150334 |
| 48 | 3.1 | 3.20953444892722 | -0.109534448927222 |
| 49 | 3.5 | 3.24422337920656 | 0.255776620793435 |
| 50 | 3.6 | 3.79462130044042 | -0.194621300440420 |
| 51 | 4.4 | 3.4626102226958 | 0.937389777304202 |
| 52 | 4.1 | 4.64428344927368 | -0.544283449273679 |
| 53 | 5.1 | 4.20970693823481 | 0.890293061765193 |
| 54 | 5.8 | 5.25446765900779 | 0.545532340992211 |
| 55 | 5.9 | 5.48270831655528 | 0.417291683444722 |
| 56 | 5.4 | 5.59232431908979 | -0.19232431908979 |
| 57 | 5.5 | 5.08901262103032 | 0.410987378969682 |
| 58 | 4.8 | 5.22008743536254 | -0.42008743536254 |
| 59 | 3.2 | 4.16749052407222 | -0.967490524072224 |
| 60 | 2.7 | 2.83775879230647 | -0.137758792306473 |
| 61 | 2.1 | 2.16662324302386 | -0.0666232430238606 |
| 62 | 1.9 | 1.6049855702247 | 0.295014429775299 |
| 63 | 0.6 | 1.54052005589716 | -0.940520055897164 |
| 64 | 0.7 | 0.448581424375302 | 0.251418575624698 |
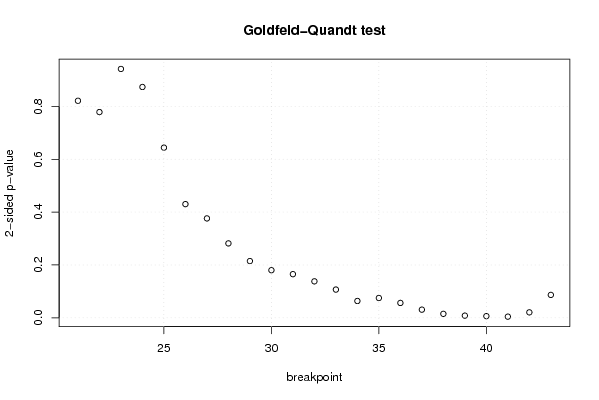
| Goldfeld-Quandt test for Heteroskedasticity | |||
| p-values | Alternative Hypothesis | ||
| breakpoint index | greater | 2-sided | less |
| 21 | 0.410667670906671 | 0.821335341813341 | 0.58933232909333 |
| 22 | 0.610673704696258 | 0.778652590607483 | 0.389326295303742 |
| 23 | 0.529099174464118 | 0.941801651071765 | 0.470900825535882 |
| 24 | 0.436768861996008 | 0.873537723992017 | 0.563231138003992 |
| 25 | 0.321971614704178 | 0.643943229408355 | 0.678028385295822 |
| 26 | 0.215106034191501 | 0.430212068383002 | 0.784893965808499 |
| 27 | 0.188093088897153 | 0.376186177794306 | 0.811906911102847 |
| 28 | 0.140835863316996 | 0.281671726633992 | 0.859164136683004 |
| 29 | 0.107396247290345 | 0.214792494580690 | 0.892603752709655 |
| 30 | 0.0900938788783673 | 0.180187757756735 | 0.909906121121633 |
| 31 | 0.0825825509635048 | 0.165165101927010 | 0.917417449036495 |
| 32 | 0.0690200116366719 | 0.138040023273344 | 0.930979988363328 |
| 33 | 0.053440412065848 | 0.106880824131696 | 0.946559587934152 |
| 34 | 0.0318513672972287 | 0.0637027345944574 | 0.968148632702771 |
| 35 | 0.0374816973233203 | 0.0749633946466406 | 0.96251830267668 |
| 36 | 0.0281776424261646 | 0.0563552848523293 | 0.971822357573835 |
| 37 | 0.0154209939904499 | 0.0308419879808997 | 0.98457900600955 |
| 38 | 0.00752328929618727 | 0.0150465785923745 | 0.992476710703813 |
| 39 | 0.0041309440165405 | 0.008261888033081 | 0.99586905598346 |
| 40 | 0.00316576578305560 | 0.00633153156611119 | 0.996834234216944 |
| 41 | 0.00218988817321958 | 0.00437977634643917 | 0.99781011182678 |
| 42 | 0.0103289777901020 | 0.0206579555802039 | 0.989671022209898 |
| 43 | 0.0433062535639294 | 0.0866125071278589 | 0.95669374643607 |
| Meta Analysis of Goldfeld-Quandt test for Heteroskedasticity | |||
| Description | # significant tests | % significant tests | OK/NOK |
| 1% type I error level | 3 | 0.130434782608696 | NOK |
| 5% type I error level | 6 | 0.260869565217391 | NOK |
| 10% type I error level | 10 | 0.434782608695652 | NOK |