| Multiple Linear Regression - Estimated Regression Equation |
| Y[t] = + 0.190434608909453 + 0.0267422785774102X[t] + 1.41632685691026Y1[t] -0.543206943585124Y2[t] + 0.00256413973686938M1[t] -0.00102366937728268M2[t] -0.00371296611758367M3[t] -0.00393033843172351M4[t] + 0.00283302253654549M5[t] -0.00625541430959138M6[t] -0.00126574100982694M7[t] -0.00247493219970349M8[t] -0.00449074038810014M9[t] -0.00542218980057909M10[t] + 0.000158447376802211M11[t] + 0.000576813092250926t + e[t] |
| Multiple Linear Regression - Ordinary Least Squares | |||||
| Variable | Parameter | S.D. | T-STAT H0: parameter = 0 | 2-tail p-value | 1-tail p-value |
| (Intercept) | 0.190434608909453 | 0.184536 | 1.032 | 0.308138 | 0.154069 |
| X | 0.0267422785774102 | 0.055413 | 0.4826 | 0.631945 | 0.315973 |
| Y1 | 1.41632685691026 | 0.136422 | 10.3819 | 0 | 0 |
| Y2 | -0.543206943585124 | 0.190211 | -2.8558 | 0.006708 | 0.003354 |
| M1 | 0.00256413973686938 | 0.00509 | 0.5037 | 0.617156 | 0.308578 |
| M2 | -0.00102366937728268 | 0.005139 | -0.1992 | 0.843108 | 0.421554 |
| M3 | -0.00371296611758367 | 0.005151 | -0.7209 | 0.475088 | 0.237544 |
| M4 | -0.00393033843172351 | 0.00513 | -0.7661 | 0.448005 | 0.224002 |
| M5 | 0.00283302253654549 | 0.005144 | 0.5507 | 0.584807 | 0.292403 |
| M6 | -0.00625541430959138 | 0.0051 | -1.2266 | 0.226978 | 0.113489 |
| M7 | -0.00126574100982694 | 0.005141 | -0.2462 | 0.806734 | 0.403367 |
| M8 | -0.00247493219970349 | 0.005092 | -0.4861 | 0.629496 | 0.314748 |
| M9 | -0.00449074038810014 | 0.005112 | -0.8785 | 0.384798 | 0.192399 |
| M10 | -0.00542218980057909 | 0.005442 | -0.9963 | 0.324953 | 0.162477 |
| M11 | 0.000158447376802211 | 0.005402 | 0.0293 | 0.976744 | 0.488372 |
| t | 0.000576813092250926 | 0.000482 | 1.1978 | 0.237866 | 0.118933 |
| Multiple Linear Regression - Regression Statistics | |
| Multiple R | 0.99797045554514 |
| R-squared | 0.995945030140976 |
| Adjusted R-squared | 0.994461504582796 |
| F-TEST (value) | 671.336617458153 |
| F-TEST (DF numerator) | 15 |
| F-TEST (DF denominator) | 41 |
| p-value | 0 |
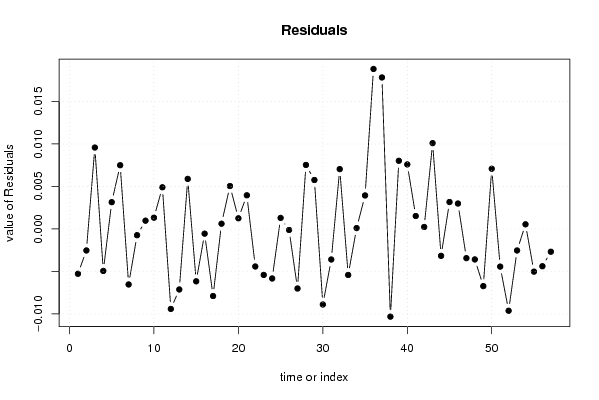
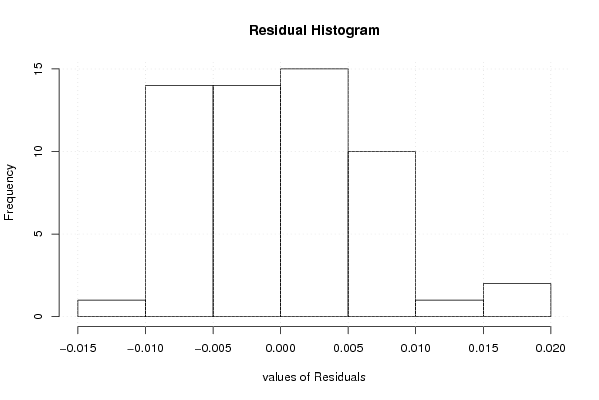
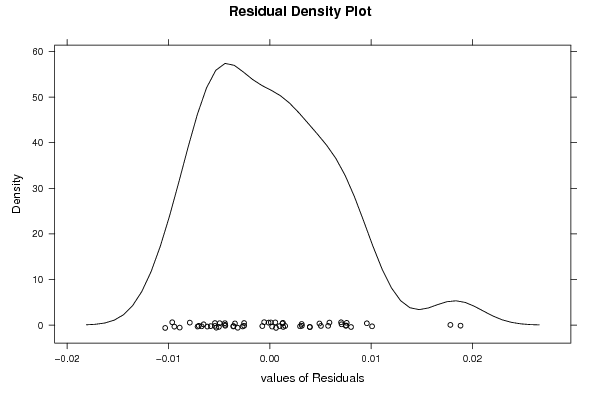
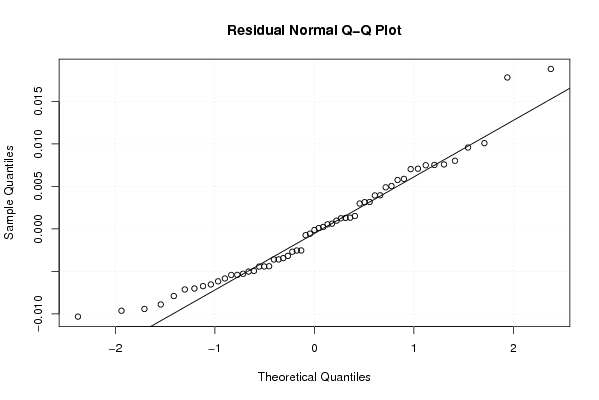
| Multiple Linear Regression - Residual Statistics | |
| Residual Standard Deviation | 0.0075530743384303 |
| Sum Squared Residuals | 0.00233900621043602 |
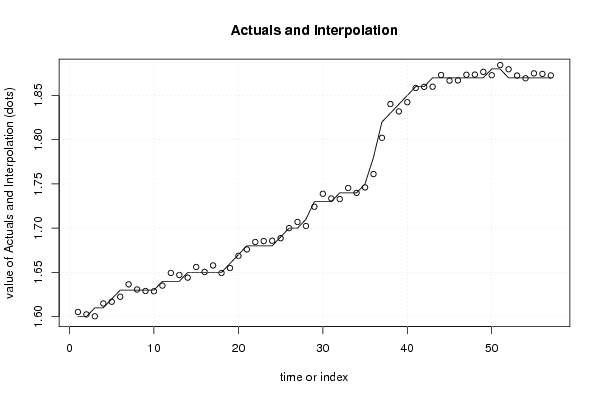
| Multiple Linear Regression - Actuals, Interpolation, and Residuals | |||
| Time or Index | Actuals | Interpolation Forecast | Residuals Prediction Error |
| 1 | 1.6 | 1.60527567627637 | -0.00527567627636534 |
| 2 | 1.6 | 1.60253210304024 | -0.00253210304023638 |
| 3 | 1.61 | 1.60041961939219 | 0.00958038060781355 |
| 4 | 1.61 | 1.6149423287394 | -0.00494232873939999 |
| 5 | 1.62 | 1.61685043336407 | 0.00314956663593134 |
| 6 | 1.63 | 1.62250207817929 | 0.00749792182071448 |
| 7 | 1.63 | 1.63653234091878 | -0.00653234091877781 |
| 8 | 1.63 | 1.63073531617108 | -0.00073531617107516 |
| 9 | 1.63 | 1.62902889828916 | 0.000971101710844663 |
| 10 | 1.63 | 1.62867426196893 | 0.00132573803107269 |
| 11 | 1.64 | 1.63509913502433 | 0.00490086497566637 |
| 12 | 1.64 | 1.64941334652311 | -0.00941334652311083 |
| 13 | 1.64 | 1.64712222991638 | -0.0071222299163799 |
| 14 | 1.65 | 1.64411123389448 | 0.00588876610552125 |
| 15 | 1.65 | 1.65616201881553 | -0.00616201881553127 |
| 16 | 1.65 | 1.65055454458624 | -0.000554544586242875 |
| 17 | 1.65 | 1.65789471864676 | -0.0078947186467628 |
| 18 | 1.65 | 1.64938309489288 | 0.000616905107123137 |
| 19 | 1.66 | 1.65494958128489 | 0.00505041871510778 |
| 20 | 1.67 | 1.66874789454214 | 0.00125210545785672 |
| 21 | 1.68 | 1.67604009857925 | 0.0039599014207511 |
| 22 | 1.68 | 1.68441666139227 | -0.00441666139227222 |
| 23 | 1.68 | 1.68540946501183 | -0.00540946501182732 |
| 24 | 1.68 | 1.68582783072728 | -0.00582783072727603 |
| 25 | 1.69 | 1.68870136077062 | 0.00129863922937779 |
| 26 | 1.7 | 1.70012105610360 | -0.000121056103597770 |
| 27 | 1.7 | 1.70700719437457 | -0.00700719437457315 |
| 28 | 1.71 | 1.70246941128838 | 0.00753058871161881 |
| 29 | 1.73 | 1.72424027670378 | 0.0057597232962222 |
| 30 | 1.73 | 1.73889054343802 | -0.00889054343801988 |
| 31 | 1.73 | 1.73359289095833 | -0.00359289095833275 |
| 32 | 1.74 | 1.73296051286071 | 0.00703948713929288 |
| 33 | 1.74 | 1.74541736354789 | -0.00541736354788989 |
| 34 | 1.74 | 1.73989808057758 | 0.000101919422415291 |
| 35 | 1.75 | 1.74605553084722 | 0.00394446915278307 |
| 36 | 1.78 | 1.76117201070332 | 0.0188279892966836 |
| 37 | 1.82 | 1.80217296816122 | 0.0178270318387845 |
| 38 | 1.83 | 1.84032110646549 | -0.0103211064654933 |
| 39 | 1.84 | 1.83198072757201 | 0.00801927242798865 |
| 40 | 1.85 | 1.84240848141224 | 0.00759151858775569 |
| 41 | 1.86 | 1.85847985460602 | 0.00152014539398443 |
| 42 | 1.86 | 1.85976912112848 | 0.000230878871522624 |
| 43 | 1.87 | 1.85990353808464 | 0.0100964619153585 |
| 44 | 1.87 | 1.87316700577034 | -0.00316700577034434 |
| 45 | 1.87 | 1.86683078680990 | 0.00316921319010442 |
| 46 | 1.87 | 1.86701099606122 | 0.00298900393878422 |
| 47 | 1.87 | 1.87343586911662 | -0.00343586911662212 |
| 48 | 1.87 | 1.87358681204630 | -0.00358681204629672 |
| 49 | 1.87 | 1.87672776487542 | -0.00672776487541703 |
| 50 | 1.88 | 1.87291450049619 | 0.00708549950380622 |
| 51 | 1.88 | 1.8844304398457 | -0.00443043984569778 |
| 52 | 1.87 | 1.87962523397373 | -0.00962523397373163 |
| 53 | 1.87 | 1.87253471667938 | -0.00253471667937518 |
| 54 | 1.87 | 1.86945516236134 | 0.000544837638659635 |
| 55 | 1.87 | 1.87502164875336 | -0.00502164875335573 |
| 56 | 1.87 | 1.87438927065573 | -0.00438927065573010 |
| 57 | 1.87 | 1.87268285277381 | -0.00268285277381029 |
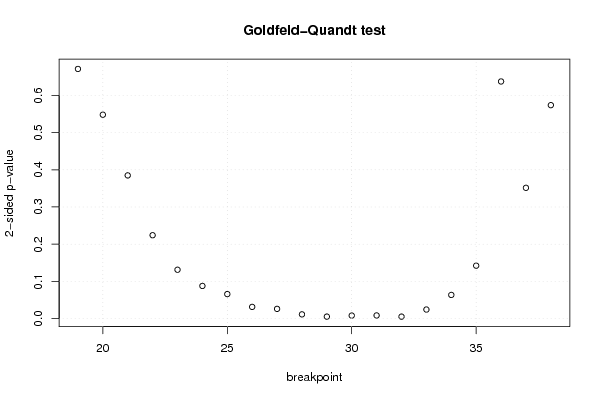
| Goldfeld-Quandt test for Heteroskedasticity | |||
| p-values | Alternative Hypothesis | ||
| breakpoint index | greater | 2-sided | less |
| 19 | 0.335470259803381 | 0.670940519606761 | 0.66452974019662 |
| 20 | 0.273979008304637 | 0.547958016609273 | 0.726020991695363 |
| 21 | 0.192449702264332 | 0.384899404528663 | 0.807550297735668 |
| 22 | 0.112062041326575 | 0.224124082653150 | 0.887937958673425 |
| 23 | 0.0656932717900766 | 0.131386543580153 | 0.934306728209923 |
| 24 | 0.0439483747862394 | 0.0878967495724789 | 0.95605162521376 |
| 25 | 0.0329823803792105 | 0.0659647607584209 | 0.96701761962079 |
| 26 | 0.0157731448872266 | 0.0315462897744533 | 0.984226855112773 |
| 27 | 0.0130887001165756 | 0.0261774002331512 | 0.986911299883424 |
| 28 | 0.00575522857443537 | 0.0115104571488707 | 0.994244771425565 |
| 29 | 0.00271325379204709 | 0.00542650758409418 | 0.997286746207953 |
| 30 | 0.0041171699637249 | 0.0082343399274498 | 0.995882830036275 |
| 31 | 0.00429878838672432 | 0.00859757677344865 | 0.995701211613276 |
| 32 | 0.00266506178877294 | 0.00533012357754587 | 0.997334938211227 |
| 33 | 0.0122168000508741 | 0.0244336001017483 | 0.987783199949126 |
| 34 | 0.0318472424158655 | 0.063694484831731 | 0.968152757584134 |
| 35 | 0.0711666125185204 | 0.142333225037041 | 0.92883338748148 |
| 36 | 0.318642799724139 | 0.637285599448277 | 0.681357200275861 |
| 37 | 0.824253655055578 | 0.351492689888844 | 0.175746344944422 |
| 38 | 0.713193273940103 | 0.573613452119793 | 0.286806726059897 |
| Meta Analysis of Goldfeld-Quandt test for Heteroskedasticity | |||
| Description | # significant tests | % significant tests | OK/NOK |
| 1% type I error level | 4 | 0.2 | NOK |
| 5% type I error level | 8 | 0.4 | NOK |
| 10% type I error level | 11 | 0.55 | NOK |