| Multiple Linear Regression - Estimated Regression Equation |
| Y[t] = + 0.373041030730798 + 0.0731322482947126X[t] + 1.42861292764240Y1[t] -0.79401619507144Y2[t] + 0.441334049246045Y3[t] -0.334606997433555Y4[t] + 0.00358222217610623M1[t] -0.00127785491116625M2[t] -0.00305874236631328M3[t] -0.00477107569119665M4[t] + 0.00229643512668181M5[t] -0.00643096429226704M6[t] + 0.000599238113361633M7[t] -0.00360162979024544M8[t] -0.00326629003045313M9[t] -0.00469609721726716M10[t] + 0.000140090461648979M11[t] + 0.00106672568748966t + e[t] |
| Multiple Linear Regression - Ordinary Least Squares | |||||
| Variable | Parameter | S.D. | T-STAT H0: parameter = 0 | 2-tail p-value | 1-tail p-value |
| (Intercept) | 0.373041030730798 | 0.248106 | 1.5036 | 0.140752 | 0.070376 |
| X | 0.0731322482947126 | 0.070876 | 1.0318 | 0.308506 | 0.154253 |
| Y1 | 1.42861292764240 | 0.156205 | 9.1458 | 0 | 0 |
| Y2 | -0.79401619507144 | 0.268437 | -2.9579 | 0.005239 | 0.00262 |
| Y3 | 0.441334049246045 | 0.264374 | 1.6694 | 0.103056 | 0.051528 |
| Y4 | -0.334606997433555 | 0.16104 | -2.0778 | 0.044359 | 0.022179 |
| M1 | 0.00358222217610623 | 0.005045 | 0.7101 | 0.481882 | 0.240941 |
| M2 | -0.00127785491116625 | 0.005022 | -0.2544 | 0.800498 | 0.400249 |
| M3 | -0.00305874236631328 | 0.005116 | -0.5979 | 0.553392 | 0.276696 |
| M4 | -0.00477107569119665 | 0.005114 | -0.9329 | 0.356609 | 0.178305 |
| M5 | 0.00229643512668181 | 0.005026 | 0.4569 | 0.650264 | 0.325132 |
| M6 | -0.00643096429226704 | 0.00496 | -1.2967 | 0.202364 | 0.101182 |
| M7 | 0.000599238113361633 | 0.005181 | 0.1157 | 0.908523 | 0.454261 |
| M8 | -0.00360162979024544 | 0.004982 | -0.7229 | 0.47405 | 0.237025 |
| M9 | -0.00326629003045313 | 0.005012 | -0.6517 | 0.518425 | 0.259212 |
| M10 | -0.00469609721726716 | 0.005314 | -0.8837 | 0.382281 | 0.191141 |
| M11 | 0.000140090461648979 | 0.005278 | 0.0265 | 0.978962 | 0.489481 |
| t | 0.00106672568748966 | 0.000645 | 1.6537 | 0.106219 | 0.053109 |
| Multiple Linear Regression - Regression Statistics | |
| Multiple R | 0.998175276796487 |
| R-squared | 0.996353883207744 |
| Adjusted R-squared | 0.994764550247017 |
| F-TEST (value) | 626.900660735122 |
| F-TEST (DF numerator) | 17 |
| F-TEST (DF denominator) | 39 |
| p-value | 0 |
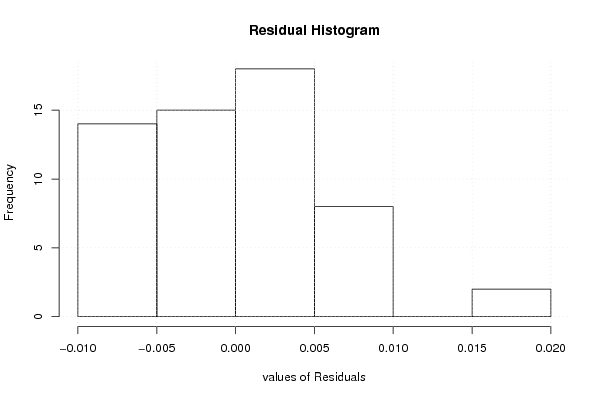
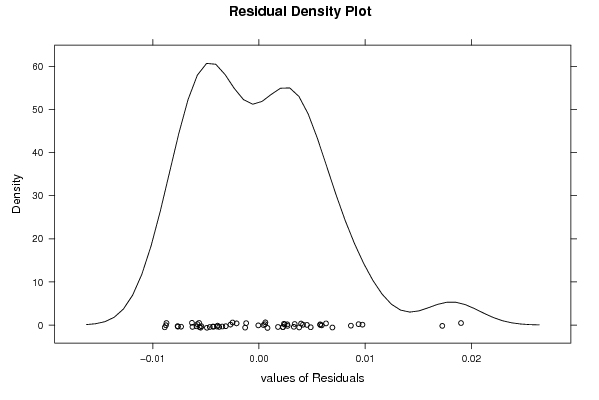
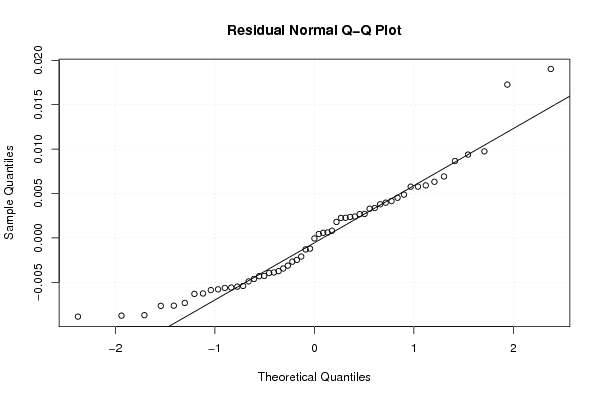
| Multiple Linear Regression - Residual Statistics | |
| Residual Standard Deviation | 0.00734352971707821 |
| Sum Squared Residuals | 0.00210316971951882 |
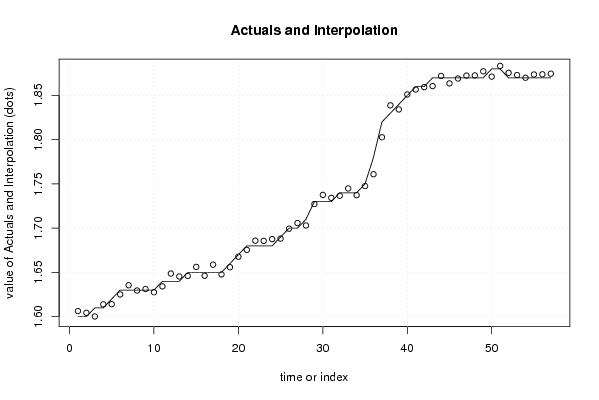
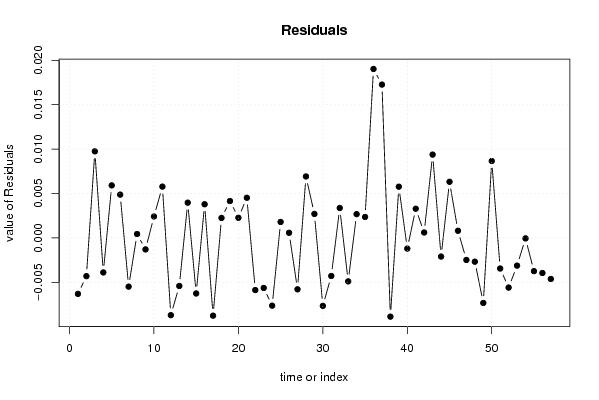
| Multiple Linear Regression - Actuals, Interpolation, and Residuals | |||
| Time or Index | Actuals | Interpolation Forecast | Residuals Prediction Error |
| 1 | 1.6 | 1.60630956962621 | -0.00630956962621468 |
| 2 | 1.6 | 1.6043148112275 | -0.00431481122750106 |
| 3 | 1.61 | 1.60025457948551 | 0.0097454205144918 |
| 4 | 1.61 | 1.61389510112454 | -0.00389510112453837 |
| 5 | 1.62 | 1.61408917567919 | 0.00591082432080794 |
| 6 | 1.63 | 1.62512797171662 | 0.00487202828338250 |
| 7 | 1.63 | 1.63549347467816 | -0.00549347467816241 |
| 8 | 1.63 | 1.62956383348674 | 0.000436166513261634 |
| 9 | 1.63 | 1.63130184696920 | -0.00130184696919800 |
| 10 | 1.63 | 1.62759269549554 | 0.00240730450446184 |
| 11 | 1.64 | 1.63422693134489 | 0.00577306865510891 |
| 12 | 1.64 | 1.64870837336421 | -0.00870837336420861 |
| 13 | 1.64 | 1.64541715927709 | -0.0054171592770901 |
| 14 | 1.65 | 1.64603714836977 | 0.00396285163023228 |
| 15 | 1.65 | 1.6562630459042 | -0.00626304590419878 |
| 16 | 1.65 | 1.64621463135020 | 0.00378536864980361 |
| 17 | 1.65 | 1.65876220834802 | -0.00876220834802496 |
| 18 | 1.65 | 1.64775546464223 | 0.00224453535776977 |
| 19 | 1.66 | 1.65585239273535 | 0.00414760726465145 |
| 20 | 1.67 | 1.66773570227860 | 0.00226429772139774 |
| 21 | 1.68 | 1.67548373505159 | 0.00451626494840622 |
| 22 | 1.68 | 1.68587996137044 | -0.00587996137043944 |
| 23 | 1.68 | 1.68564130578720 | -0.00564130578720288 |
| 24 | 1.68 | 1.68763521153117 | -0.00763521153116847 |
| 25 | 1.69 | 1.68820676693748 | 0.00179323306251834 |
| 26 | 1.7 | 1.69943086729707 | 0.000569132702930058 |
| 27 | 1.7 | 1.70579399533807 | -0.00579399533806928 |
| 28 | 1.71 | 1.70308421120832 | 0.00691578879168415 |
| 29 | 1.73 | 1.72730316999118 | 0.00269683000882003 |
| 30 | 1.73 | 1.73765984537047 | -0.0076598453704659 |
| 31 | 1.73 | 1.73428979005462 | -0.00428979005461587 |
| 32 | 1.74 | 1.73663625884908 | 0.00336374115091619 |
| 33 | 1.74 | 1.74490099114117 | -0.00490099114117154 |
| 34 | 1.74 | 1.73732907017408 | 0.00267092982592012 |
| 35 | 1.75 | 1.74764532403295 | 0.00235467596705387 |
| 36 | 1.78 | 1.76097466352677 | 0.0190253364732305 |
| 37 | 1.82 | 1.80273580471776 | 0.0172641952822358 |
| 38 | 1.83 | 1.83887379251284 | -0.00887379251283594 |
| 39 | 1.84 | 1.83423567613653 | 0.00576432386347366 |
| 40 | 1.85 | 1.85120780028641 | -0.00120780028641301 |
| 41 | 1.86 | 1.85671706471261 | 0.00328293528739105 |
| 42 | 1.86 | 1.85939491875677 | 0.000605081243227267 |
| 43 | 1.87 | 1.8606189554173 | 0.00938104458269844 |
| 44 | 1.87 | 1.87210689051279 | -0.00210689051278590 |
| 45 | 1.87 | 1.86368536900091 | 0.00631463099908783 |
| 46 | 1.87 | 1.86919827295994 | 0.000801727040057486 |
| 47 | 1.87 | 1.87248643883496 | -0.00248643883495991 |
| 48 | 1.87 | 1.87268175157785 | -0.00268175157785346 |
| 49 | 1.87 | 1.87733069944145 | -0.00733069944144935 |
| 50 | 1.88 | 1.87134338059283 | 0.00865661940717465 |
| 51 | 1.88 | 1.88345270313570 | -0.00345270313569739 |
| 52 | 1.87 | 1.87559825603054 | -0.00559825603053637 |
| 53 | 1.87 | 1.87312838126899 | -0.00312838126899405 |
| 54 | 1.87 | 1.87006179951391 | -6.17995139136242e-05 |
| 55 | 1.87 | 1.87374538711457 | -0.00374538711457161 |
| 56 | 1.87 | 1.87395731487279 | -0.00395731487278968 |
| 57 | 1.87 | 1.87462805783712 | -0.00462805783712452 |
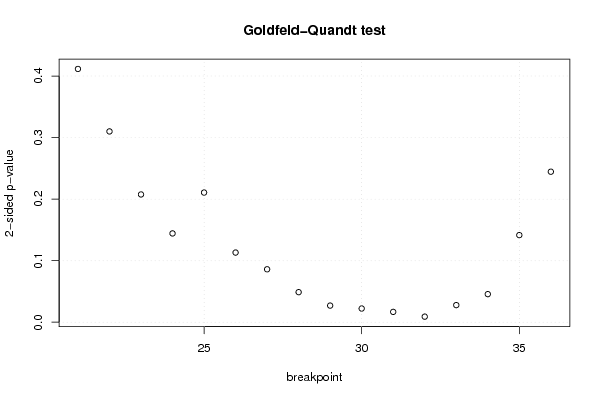
| Goldfeld-Quandt test for Heteroskedasticity | |||
| p-values | Alternative Hypothesis | ||
| breakpoint index | greater | 2-sided | less |
| 21 | 0.20574896448881 | 0.41149792897762 | 0.79425103551119 |
| 22 | 0.155010020193866 | 0.310020040387732 | 0.844989979806134 |
| 23 | 0.103805504613915 | 0.207611009227829 | 0.896194495386085 |
| 24 | 0.072149606260111 | 0.144299212520222 | 0.927850393739889 |
| 25 | 0.105339142127560 | 0.210678284255120 | 0.89466085787244 |
| 26 | 0.0565881976078421 | 0.113176395215684 | 0.943411802392158 |
| 27 | 0.0430153598453238 | 0.0860307196906475 | 0.956984640154676 |
| 28 | 0.0244276697020466 | 0.0488553394040933 | 0.975572330297953 |
| 29 | 0.0135233843555140 | 0.0270467687110279 | 0.986476615644486 |
| 30 | 0.0111422663646205 | 0.0222845327292410 | 0.98885773363538 |
| 31 | 0.00841971055135736 | 0.0168394211027147 | 0.991580289448643 |
| 32 | 0.00453812422004067 | 0.00907624844008134 | 0.99546187577996 |
| 33 | 0.0139135408381284 | 0.0278270816762568 | 0.986086459161872 |
| 34 | 0.0228205556149223 | 0.0456411112298447 | 0.977179444385078 |
| 35 | 0.0707688155057276 | 0.141537631011455 | 0.929231184494272 |
| 36 | 0.877724232731431 | 0.244551534537138 | 0.122275767268569 |
| Meta Analysis of Goldfeld-Quandt test for Heteroskedasticity | |||
| Description | # significant tests | % significant tests | OK/NOK |
| 1% type I error level | 1 | 0.0625 | NOK |
| 5% type I error level | 7 | 0.4375 | NOK |
| 10% type I error level | 8 | 0.5 | NOK |