Free Statistics

of Irreproducible Research!

Author's title

Author*The author of this computation has been verified*
R Software Modulerwasp_multipleregression.wasp
Title produced by softwareMultiple Regression
Date of computationFri, 20 Nov 2009 04:57:21 -0700
Cite this page as followsStatistical Computations at FreeStatistics.org, Office for Research Development and Education, URL https://freestatistics.org/blog/index.php?v=date/2009/Nov/20/t12587183057jpyof69yzip8xy.htm/, Retrieved Fri, 19 Apr 2024 09:19:15 +0000
Statistical Computations at FreeStatistics.org, Office for Research Development and Education, URL https://freestatistics.org/blog/index.php?pk=58051, Retrieved Fri, 19 Apr 2024 09:19:15 +0000
QR Codes:

Original text written by user:
IsPrivate?No (this computation is public)
User-defined keywordsbhschhwsws7
Estimated Impact159
Family? (F = Feedback message, R = changed R code, M = changed R Module, P = changed Parameters, D = changed Data)
-     [Multiple Regression] [Q1 The Seatbeltlaw] [2007-11-14 19:27:43] [8cd6641b921d30ebe00b648d1481bba0]
- RMPD  [Multiple Regression] [Seatbelt] [2009-11-12 13:54:52] [b98453cac15ba1066b407e146608df68]
F   PD      [Multiple Regression] [ws7] [2009-11-20 11:57:21] [682632737e024f9e62885141c5f654cd] [Current]
- R PD        [Multiple Regression] [] [2009-12-02 18:49:06] [74be16979710d4c4e7c6647856088456]
- R PD        [Multiple Regression] [] [2009-12-02 18:54:33] [74be16979710d4c4e7c6647856088456]
- R PD        [Multiple Regression] [] [2009-12-02 18:57:32] [74be16979710d4c4e7c6647856088456]
Feedback Forum
2009-12-02 19:01:50 [f1e24346ff4ab8a20729561498ad5c34] [reply
Het is de bedoeling dat je adhv je tijdreeksen verschillende modellen onderzoekt. Ik zal dit even toelichten:

Model 1: 'gewone' multiple regression

Intercept: gemiddelde waarde per maand
Multiple R: geeft ons de correlatie
R-squared: dit is de correlatie coefficient gekwadrateerd. Op deze manier is dit cijfer altijd positief. Het is het percentage dat je verklaart van de endogene variabele.
Adjusted R-squared: dit is de aangepaste R-squared en geeft een getrouwer beeld.
F-test: laat ons toe R-squared te meten
p-value: is 0, heeft betrekking op de R-squared en zegt ons dat dit getal al dan niet belangrijk genoeg is en dat het geen toeval is.
Om de nulhypothese te verwerpen moet de p-waarde zo laag mogelijk zijn.

Model 2: include monthly dummies

In model 2 voegen we ‘monthly dummies’ toe aan de calculator. Er worden seasonal dummies gemaakt voor de eerste 11 observaties, de 12e observatie is de ‘intercept’.
De getallen van M1 tot M11 geven het aantal weer dat in de andere maanden meer of minder is dan bij de intercept. Enkele getallen kunnen negatief zijn; hier zijn je gegevens lager dan bij de intercept. Enkele getallen kunnen positief zijn; hier zijn je gegevens hoger dan bij de intercept.
Met jouw gegevens ziet dit er zo uit:
http://www.freestatistics.org/blog/index.php?v=date/2009/Dec/02/t1259780114axmnwrlrl9a8kpu.htm/
Bij M7 zie je het meest negatieve getal. Hier ligt je reeks dus het laagst (en het verst onder intercept)
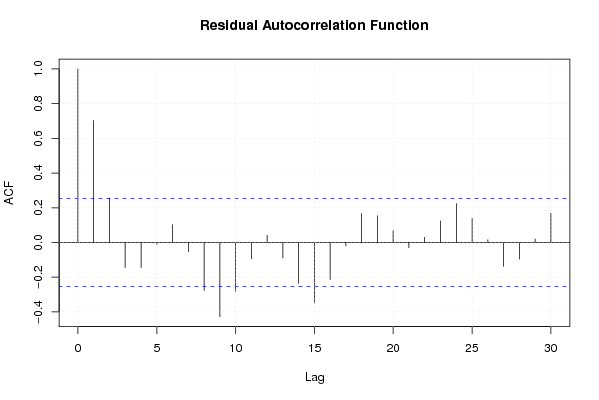
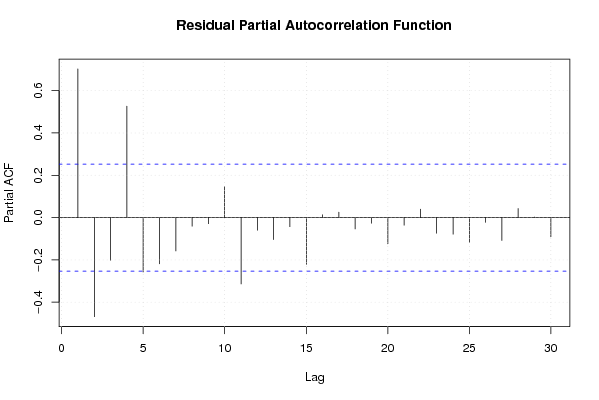
We zien bij de Autocorrelatie Functie dat het model nog niet goed genoeg is.

Model 3: introducing a linear trend
Nu vink je bij Type of Equation 'linear trend' aan. Op deze manier wordt ook een lineaire trend geïntroduceerd.
Met jouw gegevens: http://www.freestatistics.org/blog/index.php?v=date/2009/Dec/02/t1259780293974ytenwtvrn75o.htm/
Bij ACF zie je dat het model er al beter uit ziet. De lags liggen bijna allemaal tussen het 95% betrouwbaarheidsinterval.

Model 4: Autoregression with 4 lags
In Excel maak je 4 extra reeksen aan door telkens -1 te doen. Zo krijg je, Yt, Yt-1, Yt-2, Yt-3, Yt-4. Je selecteert enkel het gedeelte waarin alle reeksen volledig zijn. Zo vallen wel enkele gegevens weg. Als je dit doet en weer invoert in het Multiple Regressie Model dan zie je dat de correlatie weg is. De lags zullen zich niet meer boven het 95% betrouwbaarheidsinterval bevinden.

Model 4 kan dus beschouwd worden als het beste model.


Post a new message
Dataseries X:
126.51	0
131.02	0
136.51	0
138.04	0
132.92	0
129.61	0
122.96	0
124.04	0
121.29	0
124.56	0
118.53	0
113.14	0
114.15	0
122.17	0
129.23	0
131.19	0
129.12	0
128.28	0
126.83	0
138.13	0
140.52	0
146.83	0
135.14	0
131.84	0
125.7	0
128.98	0
133.25	0
136.76	0
133.24	0
128.54	0
121.08	0
120.23	0
119.08	0
125.75	0
126.89	0
126.6	0
121.89	0
123.44	0
126.46	0
129.49	0
127.78	0
125.29	0
119.02	0
119.96	0
122.86	0
131.89	0
132.73	0
135.01	0
136.71	1
142.73	1
144.43	1
144.93	1
138.75	1
130.22	1
122.19	1
128.4	1
140.43	1
153.5	1
149.33	1
142.97	1


Summary of computational transaction
Raw Inputview raw input (R code)
Raw Outputview raw output of R engine
Computing time4 seconds
R Server'Gwilym Jenkins' @ 72.249.127.135

\begin{tabular}{lllllllll}
\hline
Summary of computational transaction \tabularnewline
Raw Input & view raw input (R code)  \tabularnewline
Raw Output & view raw output of R engine  \tabularnewline
Computing time & 4 seconds \tabularnewline
R Server & 'Gwilym Jenkins' @ 72.249.127.135 \tabularnewline
\hline
\end{tabular}
%Source: https://freestatistics.org/blog/index.php?pk=58051&T=0

[TABLE]
[ROW][C]Summary of computational transaction[/C][/ROW]
[ROW][C]Raw Input[/C][C]view raw input (R code) [/C][/ROW]
[ROW][C]Raw Output[/C][C]view raw output of R engine [/C][/ROW]
[ROW][C]Computing time[/C][C]4 seconds[/C][/ROW]
[ROW][C]R Server[/C][C]'Gwilym Jenkins' @ 72.249.127.135[/C][/ROW]
[/TABLE]
Source: https://freestatistics.org/blog/index.php?pk=58051&T=0

Globally Unique Identifier (entire table): ba.freestatistics.org/blog/index.php?pk=58051&T=0

As an alternative you can also use a QR Code:  

The GUIDs for individual cells are displayed in the table below:

Summary of computational transaction
Raw Inputview raw input (R code)
Raw Outputview raw output of R engine
Computing time4 seconds
R Server'Gwilym Jenkins' @ 72.249.127.135


Multiple Linear Regression - Estimated Regression Equation
Y[t] = + 128.461123908783 + 12.5549986638161X[t] -0.0269166221272041t + e[t]

\begin{tabular}{lllllllll}
\hline
Multiple Linear Regression - Estimated Regression Equation \tabularnewline
Y[t] =  +  128.461123908783 +  12.5549986638161X[t] -0.0269166221272041t  + e[t] \tabularnewline
\hline
\end{tabular}
%Source: https://freestatistics.org/blog/index.php?pk=58051&T=1

[TABLE]
[ROW][C]Multiple Linear Regression - Estimated Regression Equation[/C][/ROW]
[ROW][C]Y[t] =  +  128.461123908783 +  12.5549986638161X[t] -0.0269166221272041t  + e[t][/C][/ROW]
[/TABLE]
Source: https://freestatistics.org/blog/index.php?pk=58051&T=1

Globally Unique Identifier (entire table): ba.freestatistics.org/blog/index.php?pk=58051&T=1

As an alternative you can also use a QR Code:  

The GUIDs for individual cells are displayed in the table below:

Multiple Linear Regression - Estimated Regression Equation
Y[t] = + 128.461123908783 + 12.5549986638161X[t] -0.0269166221272041t + e[t]


Multiple Linear Regression - Ordinary Least Squares
VariableParameterS.D.T-STATH0: parameter = 02-tail p-value1-tail p-value
(Intercept)128.4611239087832.1433959.933600
X12.55499866381613.2909263.8150.0003370.000169
t-0.02691662212720410.076011-0.35410.724560.36228

\begin{tabular}{lllllllll}
\hline
Multiple Linear Regression - Ordinary Least Squares \tabularnewline
Variable & Parameter & S.D. & T-STATH0: parameter = 0 & 2-tail p-value & 1-tail p-value \tabularnewline
(Intercept) & 128.461123908783 & 2.14339 & 59.9336 & 0 & 0 \tabularnewline
X & 12.5549986638161 & 3.290926 & 3.815 & 0.000337 & 0.000169 \tabularnewline
t & -0.0269166221272041 & 0.076011 & -0.3541 & 0.72456 & 0.36228 \tabularnewline
\hline
\end{tabular}
%Source: https://freestatistics.org/blog/index.php?pk=58051&T=2

[TABLE]
[ROW][C]Multiple Linear Regression - Ordinary Least Squares[/C][/ROW]
[ROW][C]Variable[/C][C]Parameter[/C][C]S.D.[/C][C]T-STATH0: parameter = 0[/C][C]2-tail p-value[/C][C]1-tail p-value[/C][/ROW]
[ROW][C](Intercept)[/C][C]128.461123908783[/C][C]2.14339[/C][C]59.9336[/C][C]0[/C][C]0[/C][/ROW]
[ROW][C]X[/C][C]12.5549986638161[/C][C]3.290926[/C][C]3.815[/C][C]0.000337[/C][C]0.000169[/C][/ROW]
[ROW][C]t[/C][C]-0.0269166221272041[/C][C]0.076011[/C][C]-0.3541[/C][C]0.72456[/C][C]0.36228[/C][/ROW]
[/TABLE]
Source: https://freestatistics.org/blog/index.php?pk=58051&T=2

Globally Unique Identifier (entire table): ba.freestatistics.org/blog/index.php?pk=58051&T=2

As an alternative you can also use a QR Code:  

The GUIDs for individual cells are displayed in the table below:

Multiple Linear Regression - Ordinary Least Squares
VariableParameterS.D.T-STATH0: parameter = 02-tail p-value1-tail p-value
(Intercept)128.4611239087832.1433959.933600
X12.55499866381613.2909263.8150.0003370.000169
t-0.02691662212720410.076011-0.35410.724560.36228


Multiple Linear Regression - Regression Statistics
Multiple R0.549347680748939
R-squared0.301782874344238
Adjusted R-squared0.277284027830000
F-TEST (value)12.3182482966641
F-TEST (DF numerator)2
F-TEST (DF denominator)57
p-value3.57873186478397e-05
Multiple Linear Regression - Residual Statistics
Residual Standard Deviation7.35190131548342
Sum Squared Residuals3080.87581829859

\begin{tabular}{lllllllll}
\hline
Multiple Linear Regression - Regression Statistics \tabularnewline
Multiple R & 0.549347680748939 \tabularnewline
R-squared & 0.301782874344238 \tabularnewline
Adjusted R-squared & 0.277284027830000 \tabularnewline
F-TEST (value) & 12.3182482966641 \tabularnewline
F-TEST (DF numerator) & 2 \tabularnewline
F-TEST (DF denominator) & 57 \tabularnewline
p-value & 3.57873186478397e-05 \tabularnewline
Multiple Linear Regression - Residual Statistics \tabularnewline
Residual Standard Deviation & 7.35190131548342 \tabularnewline
Sum Squared Residuals & 3080.87581829859 \tabularnewline
\hline
\end{tabular}
%Source: https://freestatistics.org/blog/index.php?pk=58051&T=3

[TABLE]
[ROW][C]Multiple Linear Regression - Regression Statistics[/C][/ROW]
[ROW][C]Multiple R[/C][C]0.549347680748939[/C][/ROW]
[ROW][C]R-squared[/C][C]0.301782874344238[/C][/ROW]
[ROW][C]Adjusted R-squared[/C][C]0.277284027830000[/C][/ROW]
[ROW][C]F-TEST (value)[/C][C]12.3182482966641[/C][/ROW]
[ROW][C]F-TEST (DF numerator)[/C][C]2[/C][/ROW]
[ROW][C]F-TEST (DF denominator)[/C][C]57[/C][/ROW]
[ROW][C]p-value[/C][C]3.57873186478397e-05[/C][/ROW]
[ROW][C]Multiple Linear Regression - Residual Statistics[/C][/ROW]
[ROW][C]Residual Standard Deviation[/C][C]7.35190131548342[/C][/ROW]
[ROW][C]Sum Squared Residuals[/C][C]3080.87581829859[/C][/ROW]
[/TABLE]
Source: https://freestatistics.org/blog/index.php?pk=58051&T=3

Globally Unique Identifier (entire table): ba.freestatistics.org/blog/index.php?pk=58051&T=3

As an alternative you can also use a QR Code:  

The GUIDs for individual cells are displayed in the table below:

Multiple Linear Regression - Regression Statistics
Multiple R0.549347680748939
R-squared0.301782874344238
Adjusted R-squared0.277284027830000
F-TEST (value)12.3182482966641
F-TEST (DF numerator)2
F-TEST (DF denominator)57
p-value3.57873186478397e-05
Multiple Linear Regression - Residual Statistics
Residual Standard Deviation7.35190131548342
Sum Squared Residuals3080.87581829859


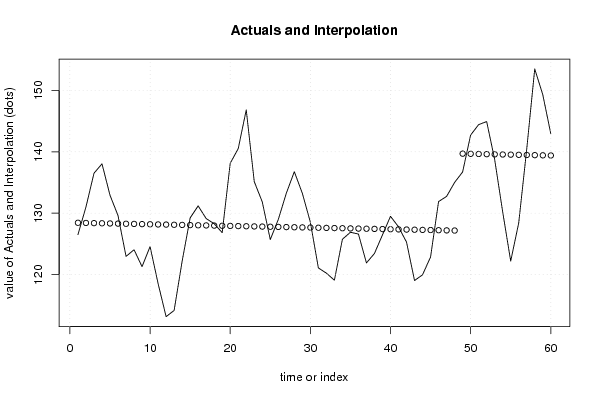
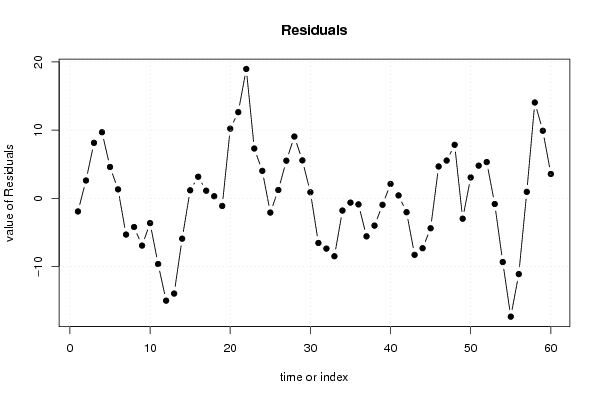
Multiple Linear Regression - Actuals, Interpolation, and Residuals
Time or IndexActualsInterpolationForecastResidualsPrediction Error
1126.51128.434207286656-1.92420728665622
2131.02128.4072906645292.61270933547124
3136.51128.3803740424028.12962595759844
4138.04128.3534574202749.68654257972565
5132.92128.3265407981474.59345920185285
6129.61128.299624176021.31037582398008
7122.96128.272707553893-5.31270755389274
8124.04128.245790931766-4.20579093176552
9121.29128.218874309638-6.92887430963832
10124.56128.191957687511-3.63195768751112
11118.53128.165041065384-9.63504106538391
12113.14128.138124443257-14.9981244432567
13114.15128.111207821130-13.9612078211295
14122.17128.084291199002-5.9142911990023
15129.23128.0573745768751.17262542312489
16131.19128.0304579547483.1595420452521
17129.12128.0035413326211.11645866737931
18128.28127.9766247104930.303375289506514
19126.83127.949708088366-1.11970808836628
20138.13127.92279146623910.2072085337609
21140.52127.89587484411212.6241251558881
22146.83127.86895822198518.9610417780153
23135.14127.8420415998577.29795840014252
24131.84127.8151249777304.02487502226974
25125.7127.788208355603-2.08820835560306
26128.98127.7612917334761.21870826652414
27133.25127.7343751113495.51562488865135
28136.76127.7074584892219.05254151077854
29133.24127.6805418670945.55945813290577
30128.54127.6536252449670.886374755032955
31121.08127.626708622840-6.54670862283983
32120.23127.599792000713-7.36979200071262
33119.08127.572875378585-8.49287537858543
34125.75127.545958756458-1.79595875645822
35126.89127.519042134331-0.629042134331016
36126.6127.492125512204-0.892125512203818
37121.89127.465208890077-5.57520889007661
38123.44127.438292267949-3.99829226794941
39126.46127.411375645822-0.951375645822206
40129.49127.3844590236952.10554097630501
41127.78127.3575424015680.422457598432209
42125.29127.330625779441-2.04062577944058
43119.02127.303709157313-8.28370915731339
44119.96127.276792535186-7.31679253518619
45122.86127.249875913059-4.38987591305898
46131.89127.2229592909324.66704070906822
47132.73127.1960426688055.53395733119542
48135.01127.1691260466777.84087395332263
49136.71139.697208088366-2.98720808836628
50142.73139.6702914662393.0597085337609
51144.43139.6433748441124.78662515588812
52144.93139.6164582219855.31354177801533
53138.75139.589541599857-0.839541599857476
54130.22139.562624977730-9.34262497773027
55122.19139.535708355603-17.3457083556031
56128.4139.508791733476-11.1087917334759
57140.43139.4818751113490.948124888651347
58153.5139.45495848922114.0450415107785
59149.33139.4280418670949.90195813290576
60142.97139.4011252449673.56887475503295

\begin{tabular}{lllllllll}
\hline
Multiple Linear Regression - Actuals, Interpolation, and Residuals \tabularnewline
Time or Index & Actuals & InterpolationForecast & ResidualsPrediction Error \tabularnewline
1 & 126.51 & 128.434207286656 & -1.92420728665622 \tabularnewline
2 & 131.02 & 128.407290664529 & 2.61270933547124 \tabularnewline
3 & 136.51 & 128.380374042402 & 8.12962595759844 \tabularnewline
4 & 138.04 & 128.353457420274 & 9.68654257972565 \tabularnewline
5 & 132.92 & 128.326540798147 & 4.59345920185285 \tabularnewline
6 & 129.61 & 128.29962417602 & 1.31037582398008 \tabularnewline
7 & 122.96 & 128.272707553893 & -5.31270755389274 \tabularnewline
8 & 124.04 & 128.245790931766 & -4.20579093176552 \tabularnewline
9 & 121.29 & 128.218874309638 & -6.92887430963832 \tabularnewline
10 & 124.56 & 128.191957687511 & -3.63195768751112 \tabularnewline
11 & 118.53 & 128.165041065384 & -9.63504106538391 \tabularnewline
12 & 113.14 & 128.138124443257 & -14.9981244432567 \tabularnewline
13 & 114.15 & 128.111207821130 & -13.9612078211295 \tabularnewline
14 & 122.17 & 128.084291199002 & -5.9142911990023 \tabularnewline
15 & 129.23 & 128.057374576875 & 1.17262542312489 \tabularnewline
16 & 131.19 & 128.030457954748 & 3.1595420452521 \tabularnewline
17 & 129.12 & 128.003541332621 & 1.11645866737931 \tabularnewline
18 & 128.28 & 127.976624710493 & 0.303375289506514 \tabularnewline
19 & 126.83 & 127.949708088366 & -1.11970808836628 \tabularnewline
20 & 138.13 & 127.922791466239 & 10.2072085337609 \tabularnewline
21 & 140.52 & 127.895874844112 & 12.6241251558881 \tabularnewline
22 & 146.83 & 127.868958221985 & 18.9610417780153 \tabularnewline
23 & 135.14 & 127.842041599857 & 7.29795840014252 \tabularnewline
24 & 131.84 & 127.815124977730 & 4.02487502226974 \tabularnewline
25 & 125.7 & 127.788208355603 & -2.08820835560306 \tabularnewline
26 & 128.98 & 127.761291733476 & 1.21870826652414 \tabularnewline
27 & 133.25 & 127.734375111349 & 5.51562488865135 \tabularnewline
28 & 136.76 & 127.707458489221 & 9.05254151077854 \tabularnewline
29 & 133.24 & 127.680541867094 & 5.55945813290577 \tabularnewline
30 & 128.54 & 127.653625244967 & 0.886374755032955 \tabularnewline
31 & 121.08 & 127.626708622840 & -6.54670862283983 \tabularnewline
32 & 120.23 & 127.599792000713 & -7.36979200071262 \tabularnewline
33 & 119.08 & 127.572875378585 & -8.49287537858543 \tabularnewline
34 & 125.75 & 127.545958756458 & -1.79595875645822 \tabularnewline
35 & 126.89 & 127.519042134331 & -0.629042134331016 \tabularnewline
36 & 126.6 & 127.492125512204 & -0.892125512203818 \tabularnewline
37 & 121.89 & 127.465208890077 & -5.57520889007661 \tabularnewline
38 & 123.44 & 127.438292267949 & -3.99829226794941 \tabularnewline
39 & 126.46 & 127.411375645822 & -0.951375645822206 \tabularnewline
40 & 129.49 & 127.384459023695 & 2.10554097630501 \tabularnewline
41 & 127.78 & 127.357542401568 & 0.422457598432209 \tabularnewline
42 & 125.29 & 127.330625779441 & -2.04062577944058 \tabularnewline
43 & 119.02 & 127.303709157313 & -8.28370915731339 \tabularnewline
44 & 119.96 & 127.276792535186 & -7.31679253518619 \tabularnewline
45 & 122.86 & 127.249875913059 & -4.38987591305898 \tabularnewline
46 & 131.89 & 127.222959290932 & 4.66704070906822 \tabularnewline
47 & 132.73 & 127.196042668805 & 5.53395733119542 \tabularnewline
48 & 135.01 & 127.169126046677 & 7.84087395332263 \tabularnewline
49 & 136.71 & 139.697208088366 & -2.98720808836628 \tabularnewline
50 & 142.73 & 139.670291466239 & 3.0597085337609 \tabularnewline
51 & 144.43 & 139.643374844112 & 4.78662515588812 \tabularnewline
52 & 144.93 & 139.616458221985 & 5.31354177801533 \tabularnewline
53 & 138.75 & 139.589541599857 & -0.839541599857476 \tabularnewline
54 & 130.22 & 139.562624977730 & -9.34262497773027 \tabularnewline
55 & 122.19 & 139.535708355603 & -17.3457083556031 \tabularnewline
56 & 128.4 & 139.508791733476 & -11.1087917334759 \tabularnewline
57 & 140.43 & 139.481875111349 & 0.948124888651347 \tabularnewline
58 & 153.5 & 139.454958489221 & 14.0450415107785 \tabularnewline
59 & 149.33 & 139.428041867094 & 9.90195813290576 \tabularnewline
60 & 142.97 & 139.401125244967 & 3.56887475503295 \tabularnewline
\hline
\end{tabular}
%Source: https://freestatistics.org/blog/index.php?pk=58051&T=4

[TABLE]
[ROW][C]Multiple Linear Regression - Actuals, Interpolation, and Residuals[/C][/ROW]
[ROW][C]Time or Index[/C][C]Actuals[/C][C]InterpolationForecast[/C][C]ResidualsPrediction Error[/C][/ROW]
[ROW][C]1[/C][C]126.51[/C][C]128.434207286656[/C][C]-1.92420728665622[/C][/ROW]
[ROW][C]2[/C][C]131.02[/C][C]128.407290664529[/C][C]2.61270933547124[/C][/ROW]
[ROW][C]3[/C][C]136.51[/C][C]128.380374042402[/C][C]8.12962595759844[/C][/ROW]
[ROW][C]4[/C][C]138.04[/C][C]128.353457420274[/C][C]9.68654257972565[/C][/ROW]
[ROW][C]5[/C][C]132.92[/C][C]128.326540798147[/C][C]4.59345920185285[/C][/ROW]
[ROW][C]6[/C][C]129.61[/C][C]128.29962417602[/C][C]1.31037582398008[/C][/ROW]
[ROW][C]7[/C][C]122.96[/C][C]128.272707553893[/C][C]-5.31270755389274[/C][/ROW]
[ROW][C]8[/C][C]124.04[/C][C]128.245790931766[/C][C]-4.20579093176552[/C][/ROW]
[ROW][C]9[/C][C]121.29[/C][C]128.218874309638[/C][C]-6.92887430963832[/C][/ROW]
[ROW][C]10[/C][C]124.56[/C][C]128.191957687511[/C][C]-3.63195768751112[/C][/ROW]
[ROW][C]11[/C][C]118.53[/C][C]128.165041065384[/C][C]-9.63504106538391[/C][/ROW]
[ROW][C]12[/C][C]113.14[/C][C]128.138124443257[/C][C]-14.9981244432567[/C][/ROW]
[ROW][C]13[/C][C]114.15[/C][C]128.111207821130[/C][C]-13.9612078211295[/C][/ROW]
[ROW][C]14[/C][C]122.17[/C][C]128.084291199002[/C][C]-5.9142911990023[/C][/ROW]
[ROW][C]15[/C][C]129.23[/C][C]128.057374576875[/C][C]1.17262542312489[/C][/ROW]
[ROW][C]16[/C][C]131.19[/C][C]128.030457954748[/C][C]3.1595420452521[/C][/ROW]
[ROW][C]17[/C][C]129.12[/C][C]128.003541332621[/C][C]1.11645866737931[/C][/ROW]
[ROW][C]18[/C][C]128.28[/C][C]127.976624710493[/C][C]0.303375289506514[/C][/ROW]
[ROW][C]19[/C][C]126.83[/C][C]127.949708088366[/C][C]-1.11970808836628[/C][/ROW]
[ROW][C]20[/C][C]138.13[/C][C]127.922791466239[/C][C]10.2072085337609[/C][/ROW]
[ROW][C]21[/C][C]140.52[/C][C]127.895874844112[/C][C]12.6241251558881[/C][/ROW]
[ROW][C]22[/C][C]146.83[/C][C]127.868958221985[/C][C]18.9610417780153[/C][/ROW]
[ROW][C]23[/C][C]135.14[/C][C]127.842041599857[/C][C]7.29795840014252[/C][/ROW]
[ROW][C]24[/C][C]131.84[/C][C]127.815124977730[/C][C]4.02487502226974[/C][/ROW]
[ROW][C]25[/C][C]125.7[/C][C]127.788208355603[/C][C]-2.08820835560306[/C][/ROW]
[ROW][C]26[/C][C]128.98[/C][C]127.761291733476[/C][C]1.21870826652414[/C][/ROW]
[ROW][C]27[/C][C]133.25[/C][C]127.734375111349[/C][C]5.51562488865135[/C][/ROW]
[ROW][C]28[/C][C]136.76[/C][C]127.707458489221[/C][C]9.05254151077854[/C][/ROW]
[ROW][C]29[/C][C]133.24[/C][C]127.680541867094[/C][C]5.55945813290577[/C][/ROW]
[ROW][C]30[/C][C]128.54[/C][C]127.653625244967[/C][C]0.886374755032955[/C][/ROW]
[ROW][C]31[/C][C]121.08[/C][C]127.626708622840[/C][C]-6.54670862283983[/C][/ROW]
[ROW][C]32[/C][C]120.23[/C][C]127.599792000713[/C][C]-7.36979200071262[/C][/ROW]
[ROW][C]33[/C][C]119.08[/C][C]127.572875378585[/C][C]-8.49287537858543[/C][/ROW]
[ROW][C]34[/C][C]125.75[/C][C]127.545958756458[/C][C]-1.79595875645822[/C][/ROW]
[ROW][C]35[/C][C]126.89[/C][C]127.519042134331[/C][C]-0.629042134331016[/C][/ROW]
[ROW][C]36[/C][C]126.6[/C][C]127.492125512204[/C][C]-0.892125512203818[/C][/ROW]
[ROW][C]37[/C][C]121.89[/C][C]127.465208890077[/C][C]-5.57520889007661[/C][/ROW]
[ROW][C]38[/C][C]123.44[/C][C]127.438292267949[/C][C]-3.99829226794941[/C][/ROW]
[ROW][C]39[/C][C]126.46[/C][C]127.411375645822[/C][C]-0.951375645822206[/C][/ROW]
[ROW][C]40[/C][C]129.49[/C][C]127.384459023695[/C][C]2.10554097630501[/C][/ROW]
[ROW][C]41[/C][C]127.78[/C][C]127.357542401568[/C][C]0.422457598432209[/C][/ROW]
[ROW][C]42[/C][C]125.29[/C][C]127.330625779441[/C][C]-2.04062577944058[/C][/ROW]
[ROW][C]43[/C][C]119.02[/C][C]127.303709157313[/C][C]-8.28370915731339[/C][/ROW]
[ROW][C]44[/C][C]119.96[/C][C]127.276792535186[/C][C]-7.31679253518619[/C][/ROW]
[ROW][C]45[/C][C]122.86[/C][C]127.249875913059[/C][C]-4.38987591305898[/C][/ROW]
[ROW][C]46[/C][C]131.89[/C][C]127.222959290932[/C][C]4.66704070906822[/C][/ROW]
[ROW][C]47[/C][C]132.73[/C][C]127.196042668805[/C][C]5.53395733119542[/C][/ROW]
[ROW][C]48[/C][C]135.01[/C][C]127.169126046677[/C][C]7.84087395332263[/C][/ROW]
[ROW][C]49[/C][C]136.71[/C][C]139.697208088366[/C][C]-2.98720808836628[/C][/ROW]
[ROW][C]50[/C][C]142.73[/C][C]139.670291466239[/C][C]3.0597085337609[/C][/ROW]
[ROW][C]51[/C][C]144.43[/C][C]139.643374844112[/C][C]4.78662515588812[/C][/ROW]
[ROW][C]52[/C][C]144.93[/C][C]139.616458221985[/C][C]5.31354177801533[/C][/ROW]
[ROW][C]53[/C][C]138.75[/C][C]139.589541599857[/C][C]-0.839541599857476[/C][/ROW]
[ROW][C]54[/C][C]130.22[/C][C]139.562624977730[/C][C]-9.34262497773027[/C][/ROW]
[ROW][C]55[/C][C]122.19[/C][C]139.535708355603[/C][C]-17.3457083556031[/C][/ROW]
[ROW][C]56[/C][C]128.4[/C][C]139.508791733476[/C][C]-11.1087917334759[/C][/ROW]
[ROW][C]57[/C][C]140.43[/C][C]139.481875111349[/C][C]0.948124888651347[/C][/ROW]
[ROW][C]58[/C][C]153.5[/C][C]139.454958489221[/C][C]14.0450415107785[/C][/ROW]
[ROW][C]59[/C][C]149.33[/C][C]139.428041867094[/C][C]9.90195813290576[/C][/ROW]
[ROW][C]60[/C][C]142.97[/C][C]139.401125244967[/C][C]3.56887475503295[/C][/ROW]
[/TABLE]
Source: https://freestatistics.org/blog/index.php?pk=58051&T=4

Globally Unique Identifier (entire table): ba.freestatistics.org/blog/index.php?pk=58051&T=4

As an alternative you can also use a QR Code:  

The GUIDs for individual cells are displayed in the table below:

Multiple Linear Regression - Actuals, Interpolation, and Residuals
Time or IndexActualsInterpolationForecastResidualsPrediction Error
1126.51128.434207286656-1.92420728665622
2131.02128.4072906645292.61270933547124
3136.51128.3803740424028.12962595759844
4138.04128.3534574202749.68654257972565
5132.92128.3265407981474.59345920185285
6129.61128.299624176021.31037582398008
7122.96128.272707553893-5.31270755389274
8124.04128.245790931766-4.20579093176552
9121.29128.218874309638-6.92887430963832
10124.56128.191957687511-3.63195768751112
11118.53128.165041065384-9.63504106538391
12113.14128.138124443257-14.9981244432567
13114.15128.111207821130-13.9612078211295
14122.17128.084291199002-5.9142911990023
15129.23128.0573745768751.17262542312489
16131.19128.0304579547483.1595420452521
17129.12128.0035413326211.11645866737931
18128.28127.9766247104930.303375289506514
19126.83127.949708088366-1.11970808836628
20138.13127.92279146623910.2072085337609
21140.52127.89587484411212.6241251558881
22146.83127.86895822198518.9610417780153
23135.14127.8420415998577.29795840014252
24131.84127.8151249777304.02487502226974
25125.7127.788208355603-2.08820835560306
26128.98127.7612917334761.21870826652414
27133.25127.7343751113495.51562488865135
28136.76127.7074584892219.05254151077854
29133.24127.6805418670945.55945813290577
30128.54127.6536252449670.886374755032955
31121.08127.626708622840-6.54670862283983
32120.23127.599792000713-7.36979200071262
33119.08127.572875378585-8.49287537858543
34125.75127.545958756458-1.79595875645822
35126.89127.519042134331-0.629042134331016
36126.6127.492125512204-0.892125512203818
37121.89127.465208890077-5.57520889007661
38123.44127.438292267949-3.99829226794941
39126.46127.411375645822-0.951375645822206
40129.49127.3844590236952.10554097630501
41127.78127.3575424015680.422457598432209
42125.29127.330625779441-2.04062577944058
43119.02127.303709157313-8.28370915731339
44119.96127.276792535186-7.31679253518619
45122.86127.249875913059-4.38987591305898
46131.89127.2229592909324.66704070906822
47132.73127.1960426688055.53395733119542
48135.01127.1691260466777.84087395332263
49136.71139.697208088366-2.98720808836628
50142.73139.6702914662393.0597085337609
51144.43139.6433748441124.78662515588812
52144.93139.6164582219855.31354177801533
53138.75139.589541599857-0.839541599857476
54130.22139.562624977730-9.34262497773027
55122.19139.535708355603-17.3457083556031
56128.4139.508791733476-11.1087917334759
57140.43139.4818751113490.948124888651347
58153.5139.45495848922114.0450415107785
59149.33139.4280418670949.90195813290576
60142.97139.4011252449673.56887475503295


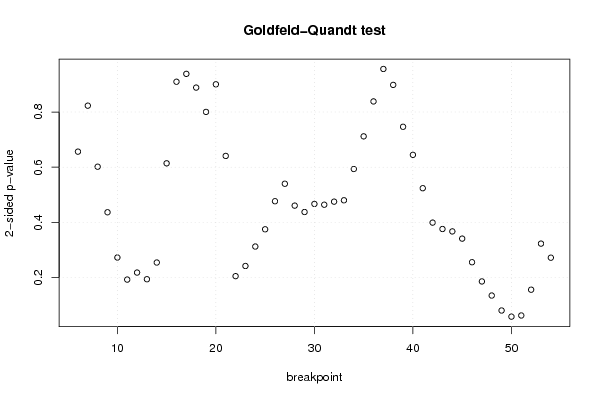
Goldfeld-Quandt test for Heteroskedasticity
p-valuesAlternative Hypothesis
breakpoint indexgreater2-sidedless
60.3282217752473910.6564435504947830.671778224752609
70.4115477091698770.8230954183397540.588452290830123
80.3009607496506110.6019214993012220.699039250349389
90.2183852907941920.4367705815883830.781614709205808
100.1363590481624280.2727180963248550.863640951837573
110.09636268672423920.1927253734484780.903637313275761
120.1090837375895000.2181674751790010.8909162624105
130.09701914072599770.1940382814519950.902980859274002
140.1272897230831460.2545794461662920.872710276916854
150.3070751771973880.6141503543947760.692924822802612
160.4549220664185150.909844132837030.545077933581485
170.469200268161590.938400536323180.53079973183841
180.4443284869102440.8886569738204880.555671513089756
190.4002262646374660.8004525292749330.599773735362534
200.5497376473698130.9005247052603730.450262352630187
210.6795115911392220.6409768177215560.320488408860778
220.8974073313207710.2051853373584580.102592668679229
230.8789757216456660.2420485567086680.121024278354334
240.8437297574781190.3125404850437620.156270242521881
250.8124961153697350.3750077692605310.187503884630265
260.761609765565980.476780468868040.23839023443402
270.7299382196702810.5401235606594370.270061780329719
280.7695802870231210.4608394259537590.230419712976879
290.7811853823980030.4376292352039950.218814617601997
300.7665050422457620.4669899155084760.233494957754238
310.7679343426608760.4641313146782480.232065657339124
320.7623701046567770.4752597906864460.237629895343223
330.7599143593795930.4801712812408140.240085640620407
340.7032348353213770.5935303293572470.296765164678623
350.6440702716781040.7118594566437920.355929728321896
360.5807753232619780.8384493534760430.419224676738022
370.5218967092560790.9562065814878420.478103290743921
380.4491982204487270.8983964408974540.550801779551273
390.3732958916476280.7465917832952560.626704108352372
400.3224394079263810.6448788158527620.677560592073619
410.2619888684794190.5239777369588370.738011131520581
420.1996035844632140.3992071689264290.800396415536786
430.1880440583062290.3760881166124580.811955941693771
440.1836744805951850.3673489611903690.816325519404815
450.1706118908799280.3412237817598560.829388109120072
460.1278577050851910.2557154101703820.872142294914809
470.09303855293572880.1860771058714580.906961447064271
480.06746558408320050.1349311681664010.9325344159168
490.04035994525782150.0807198905156430.959640054742179
500.02920408987649560.05840817975299120.970795910123504
510.03132946183888650.0626589236777730.968670538161113
520.07805532322648570.1561106464529710.921944676773514
530.1615579377375950.3231158754751890.838442062262405
540.1360586891918290.2721173783836590.86394131080817

\begin{tabular}{lllllllll}
\hline
Goldfeld-Quandt test for Heteroskedasticity \tabularnewline
p-values & Alternative Hypothesis \tabularnewline
breakpoint index & greater & 2-sided & less \tabularnewline
6 & 0.328221775247391 & 0.656443550494783 & 0.671778224752609 \tabularnewline
7 & 0.411547709169877 & 0.823095418339754 & 0.588452290830123 \tabularnewline
8 & 0.300960749650611 & 0.601921499301222 & 0.699039250349389 \tabularnewline
9 & 0.218385290794192 & 0.436770581588383 & 0.781614709205808 \tabularnewline
10 & 0.136359048162428 & 0.272718096324855 & 0.863640951837573 \tabularnewline
11 & 0.0963626867242392 & 0.192725373448478 & 0.903637313275761 \tabularnewline
12 & 0.109083737589500 & 0.218167475179001 & 0.8909162624105 \tabularnewline
13 & 0.0970191407259977 & 0.194038281451995 & 0.902980859274002 \tabularnewline
14 & 0.127289723083146 & 0.254579446166292 & 0.872710276916854 \tabularnewline
15 & 0.307075177197388 & 0.614150354394776 & 0.692924822802612 \tabularnewline
16 & 0.454922066418515 & 0.90984413283703 & 0.545077933581485 \tabularnewline
17 & 0.46920026816159 & 0.93840053632318 & 0.53079973183841 \tabularnewline
18 & 0.444328486910244 & 0.888656973820488 & 0.555671513089756 \tabularnewline
19 & 0.400226264637466 & 0.800452529274933 & 0.599773735362534 \tabularnewline
20 & 0.549737647369813 & 0.900524705260373 & 0.450262352630187 \tabularnewline
21 & 0.679511591139222 & 0.640976817721556 & 0.320488408860778 \tabularnewline
22 & 0.897407331320771 & 0.205185337358458 & 0.102592668679229 \tabularnewline
23 & 0.878975721645666 & 0.242048556708668 & 0.121024278354334 \tabularnewline
24 & 0.843729757478119 & 0.312540485043762 & 0.156270242521881 \tabularnewline
25 & 0.812496115369735 & 0.375007769260531 & 0.187503884630265 \tabularnewline
26 & 0.76160976556598 & 0.47678046886804 & 0.23839023443402 \tabularnewline
27 & 0.729938219670281 & 0.540123560659437 & 0.270061780329719 \tabularnewline
28 & 0.769580287023121 & 0.460839425953759 & 0.230419712976879 \tabularnewline
29 & 0.781185382398003 & 0.437629235203995 & 0.218814617601997 \tabularnewline
30 & 0.766505042245762 & 0.466989915508476 & 0.233494957754238 \tabularnewline
31 & 0.767934342660876 & 0.464131314678248 & 0.232065657339124 \tabularnewline
32 & 0.762370104656777 & 0.475259790686446 & 0.237629895343223 \tabularnewline
33 & 0.759914359379593 & 0.480171281240814 & 0.240085640620407 \tabularnewline
34 & 0.703234835321377 & 0.593530329357247 & 0.296765164678623 \tabularnewline
35 & 0.644070271678104 & 0.711859456643792 & 0.355929728321896 \tabularnewline
36 & 0.580775323261978 & 0.838449353476043 & 0.419224676738022 \tabularnewline
37 & 0.521896709256079 & 0.956206581487842 & 0.478103290743921 \tabularnewline
38 & 0.449198220448727 & 0.898396440897454 & 0.550801779551273 \tabularnewline
39 & 0.373295891647628 & 0.746591783295256 & 0.626704108352372 \tabularnewline
40 & 0.322439407926381 & 0.644878815852762 & 0.677560592073619 \tabularnewline
41 & 0.261988868479419 & 0.523977736958837 & 0.738011131520581 \tabularnewline
42 & 0.199603584463214 & 0.399207168926429 & 0.800396415536786 \tabularnewline
43 & 0.188044058306229 & 0.376088116612458 & 0.811955941693771 \tabularnewline
44 & 0.183674480595185 & 0.367348961190369 & 0.816325519404815 \tabularnewline
45 & 0.170611890879928 & 0.341223781759856 & 0.829388109120072 \tabularnewline
46 & 0.127857705085191 & 0.255715410170382 & 0.872142294914809 \tabularnewline
47 & 0.0930385529357288 & 0.186077105871458 & 0.906961447064271 \tabularnewline
48 & 0.0674655840832005 & 0.134931168166401 & 0.9325344159168 \tabularnewline
49 & 0.0403599452578215 & 0.080719890515643 & 0.959640054742179 \tabularnewline
50 & 0.0292040898764956 & 0.0584081797529912 & 0.970795910123504 \tabularnewline
51 & 0.0313294618388865 & 0.062658923677773 & 0.968670538161113 \tabularnewline
52 & 0.0780553232264857 & 0.156110646452971 & 0.921944676773514 \tabularnewline
53 & 0.161557937737595 & 0.323115875475189 & 0.838442062262405 \tabularnewline
54 & 0.136058689191829 & 0.272117378383659 & 0.86394131080817 \tabularnewline
\hline
\end{tabular}
%Source: https://freestatistics.org/blog/index.php?pk=58051&T=5

[TABLE]
[ROW][C]Goldfeld-Quandt test for Heteroskedasticity[/C][/ROW]
[ROW][C]p-values[/C][C]Alternative Hypothesis[/C][/ROW]
[ROW][C]breakpoint index[/C][C]greater[/C][C]2-sided[/C][C]less[/C][/ROW]
[ROW][C]6[/C][C]0.328221775247391[/C][C]0.656443550494783[/C][C]0.671778224752609[/C][/ROW]
[ROW][C]7[/C][C]0.411547709169877[/C][C]0.823095418339754[/C][C]0.588452290830123[/C][/ROW]
[ROW][C]8[/C][C]0.300960749650611[/C][C]0.601921499301222[/C][C]0.699039250349389[/C][/ROW]
[ROW][C]9[/C][C]0.218385290794192[/C][C]0.436770581588383[/C][C]0.781614709205808[/C][/ROW]
[ROW][C]10[/C][C]0.136359048162428[/C][C]0.272718096324855[/C][C]0.863640951837573[/C][/ROW]
[ROW][C]11[/C][C]0.0963626867242392[/C][C]0.192725373448478[/C][C]0.903637313275761[/C][/ROW]
[ROW][C]12[/C][C]0.109083737589500[/C][C]0.218167475179001[/C][C]0.8909162624105[/C][/ROW]
[ROW][C]13[/C][C]0.0970191407259977[/C][C]0.194038281451995[/C][C]0.902980859274002[/C][/ROW]
[ROW][C]14[/C][C]0.127289723083146[/C][C]0.254579446166292[/C][C]0.872710276916854[/C][/ROW]
[ROW][C]15[/C][C]0.307075177197388[/C][C]0.614150354394776[/C][C]0.692924822802612[/C][/ROW]
[ROW][C]16[/C][C]0.454922066418515[/C][C]0.90984413283703[/C][C]0.545077933581485[/C][/ROW]
[ROW][C]17[/C][C]0.46920026816159[/C][C]0.93840053632318[/C][C]0.53079973183841[/C][/ROW]
[ROW][C]18[/C][C]0.444328486910244[/C][C]0.888656973820488[/C][C]0.555671513089756[/C][/ROW]
[ROW][C]19[/C][C]0.400226264637466[/C][C]0.800452529274933[/C][C]0.599773735362534[/C][/ROW]
[ROW][C]20[/C][C]0.549737647369813[/C][C]0.900524705260373[/C][C]0.450262352630187[/C][/ROW]
[ROW][C]21[/C][C]0.679511591139222[/C][C]0.640976817721556[/C][C]0.320488408860778[/C][/ROW]
[ROW][C]22[/C][C]0.897407331320771[/C][C]0.205185337358458[/C][C]0.102592668679229[/C][/ROW]
[ROW][C]23[/C][C]0.878975721645666[/C][C]0.242048556708668[/C][C]0.121024278354334[/C][/ROW]
[ROW][C]24[/C][C]0.843729757478119[/C][C]0.312540485043762[/C][C]0.156270242521881[/C][/ROW]
[ROW][C]25[/C][C]0.812496115369735[/C][C]0.375007769260531[/C][C]0.187503884630265[/C][/ROW]
[ROW][C]26[/C][C]0.76160976556598[/C][C]0.47678046886804[/C][C]0.23839023443402[/C][/ROW]
[ROW][C]27[/C][C]0.729938219670281[/C][C]0.540123560659437[/C][C]0.270061780329719[/C][/ROW]
[ROW][C]28[/C][C]0.769580287023121[/C][C]0.460839425953759[/C][C]0.230419712976879[/C][/ROW]
[ROW][C]29[/C][C]0.781185382398003[/C][C]0.437629235203995[/C][C]0.218814617601997[/C][/ROW]
[ROW][C]30[/C][C]0.766505042245762[/C][C]0.466989915508476[/C][C]0.233494957754238[/C][/ROW]
[ROW][C]31[/C][C]0.767934342660876[/C][C]0.464131314678248[/C][C]0.232065657339124[/C][/ROW]
[ROW][C]32[/C][C]0.762370104656777[/C][C]0.475259790686446[/C][C]0.237629895343223[/C][/ROW]
[ROW][C]33[/C][C]0.759914359379593[/C][C]0.480171281240814[/C][C]0.240085640620407[/C][/ROW]
[ROW][C]34[/C][C]0.703234835321377[/C][C]0.593530329357247[/C][C]0.296765164678623[/C][/ROW]
[ROW][C]35[/C][C]0.644070271678104[/C][C]0.711859456643792[/C][C]0.355929728321896[/C][/ROW]
[ROW][C]36[/C][C]0.580775323261978[/C][C]0.838449353476043[/C][C]0.419224676738022[/C][/ROW]
[ROW][C]37[/C][C]0.521896709256079[/C][C]0.956206581487842[/C][C]0.478103290743921[/C][/ROW]
[ROW][C]38[/C][C]0.449198220448727[/C][C]0.898396440897454[/C][C]0.550801779551273[/C][/ROW]
[ROW][C]39[/C][C]0.373295891647628[/C][C]0.746591783295256[/C][C]0.626704108352372[/C][/ROW]
[ROW][C]40[/C][C]0.322439407926381[/C][C]0.644878815852762[/C][C]0.677560592073619[/C][/ROW]
[ROW][C]41[/C][C]0.261988868479419[/C][C]0.523977736958837[/C][C]0.738011131520581[/C][/ROW]
[ROW][C]42[/C][C]0.199603584463214[/C][C]0.399207168926429[/C][C]0.800396415536786[/C][/ROW]
[ROW][C]43[/C][C]0.188044058306229[/C][C]0.376088116612458[/C][C]0.811955941693771[/C][/ROW]
[ROW][C]44[/C][C]0.183674480595185[/C][C]0.367348961190369[/C][C]0.816325519404815[/C][/ROW]
[ROW][C]45[/C][C]0.170611890879928[/C][C]0.341223781759856[/C][C]0.829388109120072[/C][/ROW]
[ROW][C]46[/C][C]0.127857705085191[/C][C]0.255715410170382[/C][C]0.872142294914809[/C][/ROW]
[ROW][C]47[/C][C]0.0930385529357288[/C][C]0.186077105871458[/C][C]0.906961447064271[/C][/ROW]
[ROW][C]48[/C][C]0.0674655840832005[/C][C]0.134931168166401[/C][C]0.9325344159168[/C][/ROW]
[ROW][C]49[/C][C]0.0403599452578215[/C][C]0.080719890515643[/C][C]0.959640054742179[/C][/ROW]
[ROW][C]50[/C][C]0.0292040898764956[/C][C]0.0584081797529912[/C][C]0.970795910123504[/C][/ROW]
[ROW][C]51[/C][C]0.0313294618388865[/C][C]0.062658923677773[/C][C]0.968670538161113[/C][/ROW]
[ROW][C]52[/C][C]0.0780553232264857[/C][C]0.156110646452971[/C][C]0.921944676773514[/C][/ROW]
[ROW][C]53[/C][C]0.161557937737595[/C][C]0.323115875475189[/C][C]0.838442062262405[/C][/ROW]
[ROW][C]54[/C][C]0.136058689191829[/C][C]0.272117378383659[/C][C]0.86394131080817[/C][/ROW]
[/TABLE]
Source: https://freestatistics.org/blog/index.php?pk=58051&T=5

Globally Unique Identifier (entire table): ba.freestatistics.org/blog/index.php?pk=58051&T=5

As an alternative you can also use a QR Code:  

The GUIDs for individual cells are displayed in the table below:

Goldfeld-Quandt test for Heteroskedasticity
p-valuesAlternative Hypothesis
breakpoint indexgreater2-sidedless
60.3282217752473910.6564435504947830.671778224752609
70.4115477091698770.8230954183397540.588452290830123
80.3009607496506110.6019214993012220.699039250349389
90.2183852907941920.4367705815883830.781614709205808
100.1363590481624280.2727180963248550.863640951837573
110.09636268672423920.1927253734484780.903637313275761
120.1090837375895000.2181674751790010.8909162624105
130.09701914072599770.1940382814519950.902980859274002
140.1272897230831460.2545794461662920.872710276916854
150.3070751771973880.6141503543947760.692924822802612
160.4549220664185150.909844132837030.545077933581485
170.469200268161590.938400536323180.53079973183841
180.4443284869102440.8886569738204880.555671513089756
190.4002262646374660.8004525292749330.599773735362534
200.5497376473698130.9005247052603730.450262352630187
210.6795115911392220.6409768177215560.320488408860778
220.8974073313207710.2051853373584580.102592668679229
230.8789757216456660.2420485567086680.121024278354334
240.8437297574781190.3125404850437620.156270242521881
250.8124961153697350.3750077692605310.187503884630265
260.761609765565980.476780468868040.23839023443402
270.7299382196702810.5401235606594370.270061780329719
280.7695802870231210.4608394259537590.230419712976879
290.7811853823980030.4376292352039950.218814617601997
300.7665050422457620.4669899155084760.233494957754238
310.7679343426608760.4641313146782480.232065657339124
320.7623701046567770.4752597906864460.237629895343223
330.7599143593795930.4801712812408140.240085640620407
340.7032348353213770.5935303293572470.296765164678623
350.6440702716781040.7118594566437920.355929728321896
360.5807753232619780.8384493534760430.419224676738022
370.5218967092560790.9562065814878420.478103290743921
380.4491982204487270.8983964408974540.550801779551273
390.3732958916476280.7465917832952560.626704108352372
400.3224394079263810.6448788158527620.677560592073619
410.2619888684794190.5239777369588370.738011131520581
420.1996035844632140.3992071689264290.800396415536786
430.1880440583062290.3760881166124580.811955941693771
440.1836744805951850.3673489611903690.816325519404815
450.1706118908799280.3412237817598560.829388109120072
460.1278577050851910.2557154101703820.872142294914809
470.09303855293572880.1860771058714580.906961447064271
480.06746558408320050.1349311681664010.9325344159168
490.04035994525782150.0807198905156430.959640054742179
500.02920408987649560.05840817975299120.970795910123504
510.03132946183888650.0626589236777730.968670538161113
520.07805532322648570.1561106464529710.921944676773514
530.1615579377375950.3231158754751890.838442062262405
540.1360586891918290.2721173783836590.86394131080817


Meta Analysis of Goldfeld-Quandt test for Heteroskedasticity
Description# significant tests% significant testsOK/NOK
1% type I error level00OK
5% type I error level00OK
10% type I error level30.0612244897959184OK

\begin{tabular}{lllllllll}
\hline
Meta Analysis of Goldfeld-Quandt test for Heteroskedasticity \tabularnewline
Description & # significant tests & % significant tests & OK/NOK \tabularnewline
1% type I error level & 0 & 0 & OK \tabularnewline
5% type I error level & 0 & 0 & OK \tabularnewline
10% type I error level & 3 & 0.0612244897959184 & OK \tabularnewline
\hline
\end{tabular}
%Source: https://freestatistics.org/blog/index.php?pk=58051&T=6

[TABLE]
[ROW][C]Meta Analysis of Goldfeld-Quandt test for Heteroskedasticity[/C][/ROW]
[ROW][C]Description[/C][C]# significant tests[/C][C]% significant tests[/C][C]OK/NOK[/C][/ROW]
[ROW][C]1% type I error level[/C][C]0[/C][C]0[/C][C]OK[/C][/ROW]
[ROW][C]5% type I error level[/C][C]0[/C][C]0[/C][C]OK[/C][/ROW]
[ROW][C]10% type I error level[/C][C]3[/C][C]0.0612244897959184[/C][C]OK[/C][/ROW]
[/TABLE]
Source: https://freestatistics.org/blog/index.php?pk=58051&T=6

Globally Unique Identifier (entire table): ba.freestatistics.org/blog/index.php?pk=58051&T=6

As an alternative you can also use a QR Code:  

The GUIDs for individual cells are displayed in the table below:

Meta Analysis of Goldfeld-Quandt test for Heteroskedasticity
Description# significant tests% significant testsOK/NOK
1% type I error level00OK
5% type I error level00OK
10% type I error level30.0612244897959184OK


Parameters (Session):
par1 = 1 ; par2 = Do not include Seasonal Dummies ; par3 = Linear Trend ;
Parameters (R input):
par1 = 1 ; par2 = Do not include Seasonal Dummies ; par3 = Linear Trend ;
R code (references can be found in the software module):
library(lattice)
library(lmtest)
n25 <- 25 #minimum number of obs. for Goldfeld-Quandt test
par1 <- as.numeric(par1)
x <- t(y)
k <- length(x[1,])
n <- length(x[,1])
x1 <- cbind(x[,par1], x[,1:k!=par1])
mycolnames <- c(colnames(x)[par1], colnames(x)[1:k!=par1])
colnames(x1) <- mycolnames #colnames(x)[par1]
x <- x1
if (par3 == 'First Differences'){
x2 <- array(0, dim=c(n-1,k), dimnames=list(1:(n-1), paste('(1-B)',colnames(x),sep='')))
for (i in 1:n-1) {
for (j in 1:k) {
x2[i,j] <- x[i+1,j] - x[i,j]
}
}
x <- x2
}
if (par2 == 'Include Monthly Dummies'){
x2 <- array(0, dim=c(n,11), dimnames=list(1:n, paste('M', seq(1:11), sep ='')))
for (i in 1:11){
x2[seq(i,n,12),i] <- 1
}
x <- cbind(x, x2)
}
if (par2 == 'Include Quarterly Dummies'){
x2 <- array(0, dim=c(n,3), dimnames=list(1:n, paste('Q', seq(1:3), sep ='')))
for (i in 1:3){
x2[seq(i,n,4),i] <- 1
}
x <- cbind(x, x2)
}
k <- length(x[1,])
if (par3 == 'Linear Trend'){
x <- cbind(x, c(1:n))
colnames(x)[k+1] <- 't'
}
x
k <- length(x[1,])
df <- as.data.frame(x)
(mylm <- lm(df))
(mysum <- summary(mylm))
if (n > n25) {
kp3 <- k + 3
nmkm3 <- n - k - 3
gqarr <- array(NA, dim=c(nmkm3-kp3+1,3))
numgqtests <- 0
numsignificant1 <- 0
numsignificant5 <- 0
numsignificant10 <- 0
for (mypoint in kp3:nmkm3) {
j <- 0
numgqtests <- numgqtests + 1
for (myalt in c('greater', 'two.sided', 'less')) {
j <- j + 1
gqarr[mypoint-kp3+1,j] <- gqtest(mylm, point=mypoint, alternative=myalt)$p.value
}
if (gqarr[mypoint-kp3+1,2] < 0.01) numsignificant1 <- numsignificant1 + 1
if (gqarr[mypoint-kp3+1,2] < 0.05) numsignificant5 <- numsignificant5 + 1
if (gqarr[mypoint-kp3+1,2] < 0.10) numsignificant10 <- numsignificant10 + 1
}
gqarr
}
bitmap(file='test0.png')
plot(x[,1], type='l', main='Actuals and Interpolation', ylab='value of Actuals and Interpolation (dots)', xlab='time or index')
points(x[,1]-mysum$resid)
grid()
dev.off()
bitmap(file='test1.png')
plot(mysum$resid, type='b', pch=19, main='Residuals', ylab='value of Residuals', xlab='time or index')
grid()
dev.off()
bitmap(file='test2.png')
hist(mysum$resid, main='Residual Histogram', xlab='values of Residuals')
grid()
dev.off()
bitmap(file='test3.png')
densityplot(~mysum$resid,col='black',main='Residual Density Plot', xlab='values of Residuals')
dev.off()
bitmap(file='test4.png')
qqnorm(mysum$resid, main='Residual Normal Q-Q Plot')
qqline(mysum$resid)
grid()
dev.off()
(myerror <- as.ts(mysum$resid))
bitmap(file='test5.png')
dum <- cbind(lag(myerror,k=1),myerror)
dum
dum1 <- dum[2:length(myerror),]
dum1
z <- as.data.frame(dum1)
z
plot(z,main=paste('Residual Lag plot, lowess, and regression line'), ylab='values of Residuals', xlab='lagged values of Residuals')
lines(lowess(z))
abline(lm(z))
grid()
dev.off()
bitmap(file='test6.png')
acf(mysum$resid, lag.max=length(mysum$resid)/2, main='Residual Autocorrelation Function')
grid()
dev.off()
bitmap(file='test7.png')
pacf(mysum$resid, lag.max=length(mysum$resid)/2, main='Residual Partial Autocorrelation Function')
grid()
dev.off()
bitmap(file='test8.png')
opar <- par(mfrow = c(2,2), oma = c(0, 0, 1.1, 0))
plot(mylm, las = 1, sub='Residual Diagnostics')
par(opar)
dev.off()
if (n > n25) {
bitmap(file='test9.png')
plot(kp3:nmkm3,gqarr[,2], main='Goldfeld-Quandt test',ylab='2-sided p-value',xlab='breakpoint')
grid()
dev.off()
}
load(file='createtable')
a<-table.start()
a<-table.row.start(a)
a<-table.element(a, 'Multiple Linear Regression - Estimated Regression Equation', 1, TRUE)
a<-table.row.end(a)
myeq <- colnames(x)[1]
myeq <- paste(myeq, '[t] = ', sep='')
for (i in 1:k){
if (mysum$coefficients[i,1] > 0) myeq <- paste(myeq, '+', '')
myeq <- paste(myeq, mysum$coefficients[i,1], sep=' ')
if (rownames(mysum$coefficients)[i] != '(Intercept)') {
myeq <- paste(myeq, rownames(mysum$coefficients)[i], sep='')
if (rownames(mysum$coefficients)[i] != 't') myeq <- paste(myeq, '[t]', sep='')
}
}
myeq <- paste(myeq, ' + e[t]')
a<-table.row.start(a)
a<-table.element(a, myeq)
a<-table.row.end(a)
a<-table.end(a)
table.save(a,file='mytable1.tab')
a<-table.start()
a<-table.row.start(a)
a<-table.element(a,hyperlink('ols1.htm','Multiple Linear Regression - Ordinary Least Squares',''), 6, TRUE)
a<-table.row.end(a)
a<-table.row.start(a)
a<-table.element(a,'Variable',header=TRUE)
a<-table.element(a,'Parameter',header=TRUE)
a<-table.element(a,'S.D.',header=TRUE)
a<-table.element(a,'T-STAT
H0: parameter = 0',header=TRUE)
a<-table.element(a,'2-tail p-value',header=TRUE)
a<-table.element(a,'1-tail p-value',header=TRUE)
a<-table.row.end(a)
for (i in 1:k){
a<-table.row.start(a)
a<-table.element(a,rownames(mysum$coefficients)[i],header=TRUE)
a<-table.element(a,mysum$coefficients[i,1])
a<-table.element(a, round(mysum$coefficients[i,2],6))
a<-table.element(a, round(mysum$coefficients[i,3],4))
a<-table.element(a, round(mysum$coefficients[i,4],6))
a<-table.element(a, round(mysum$coefficients[i,4]/2,6))
a<-table.row.end(a)
}
a<-table.end(a)
table.save(a,file='mytable2.tab')
a<-table.start()
a<-table.row.start(a)
a<-table.element(a, 'Multiple Linear Regression - Regression Statistics', 2, TRUE)
a<-table.row.end(a)
a<-table.row.start(a)
a<-table.element(a, 'Multiple R',1,TRUE)
a<-table.element(a, sqrt(mysum$r.squared))
a<-table.row.end(a)
a<-table.row.start(a)
a<-table.element(a, 'R-squared',1,TRUE)
a<-table.element(a, mysum$r.squared)
a<-table.row.end(a)
a<-table.row.start(a)
a<-table.element(a, 'Adjusted R-squared',1,TRUE)
a<-table.element(a, mysum$adj.r.squared)
a<-table.row.end(a)
a<-table.row.start(a)
a<-table.element(a, 'F-TEST (value)',1,TRUE)
a<-table.element(a, mysum$fstatistic[1])
a<-table.row.end(a)
a<-table.row.start(a)
a<-table.element(a, 'F-TEST (DF numerator)',1,TRUE)
a<-table.element(a, mysum$fstatistic[2])
a<-table.row.end(a)
a<-table.row.start(a)
a<-table.element(a, 'F-TEST (DF denominator)',1,TRUE)
a<-table.element(a, mysum$fstatistic[3])
a<-table.row.end(a)
a<-table.row.start(a)
a<-table.element(a, 'p-value',1,TRUE)
a<-table.element(a, 1-pf(mysum$fstatistic[1],mysum$fstatistic[2],mysum$fstatistic[3]))
a<-table.row.end(a)
a<-table.row.start(a)
a<-table.element(a, 'Multiple Linear Regression - Residual Statistics', 2, TRUE)
a<-table.row.end(a)
a<-table.row.start(a)
a<-table.element(a, 'Residual Standard Deviation',1,TRUE)
a<-table.element(a, mysum$sigma)
a<-table.row.end(a)
a<-table.row.start(a)
a<-table.element(a, 'Sum Squared Residuals',1,TRUE)
a<-table.element(a, sum(myerror*myerror))
a<-table.row.end(a)
a<-table.end(a)
table.save(a,file='mytable3.tab')
a<-table.start()
a<-table.row.start(a)
a<-table.element(a, 'Multiple Linear Regression - Actuals, Interpolation, and Residuals', 4, TRUE)
a<-table.row.end(a)
a<-table.row.start(a)
a<-table.element(a, 'Time or Index', 1, TRUE)
a<-table.element(a, 'Actuals', 1, TRUE)
a<-table.element(a, 'Interpolation
Forecast', 1, TRUE)
a<-table.element(a, 'Residuals
Prediction Error', 1, TRUE)
a<-table.row.end(a)
for (i in 1:n) {
a<-table.row.start(a)
a<-table.element(a,i, 1, TRUE)
a<-table.element(a,x[i])
a<-table.element(a,x[i]-mysum$resid[i])
a<-table.element(a,mysum$resid[i])
a<-table.row.end(a)
}
a<-table.end(a)
table.save(a,file='mytable4.tab')
if (n > n25) {
a<-table.start()
a<-table.row.start(a)
a<-table.element(a,'Goldfeld-Quandt test for Heteroskedasticity',4,TRUE)
a<-table.row.end(a)
a<-table.row.start(a)
a<-table.element(a,'p-values',header=TRUE)
a<-table.element(a,'Alternative Hypothesis',3,header=TRUE)
a<-table.row.end(a)
a<-table.row.start(a)
a<-table.element(a,'breakpoint index',header=TRUE)
a<-table.element(a,'greater',header=TRUE)
a<-table.element(a,'2-sided',header=TRUE)
a<-table.element(a,'less',header=TRUE)
a<-table.row.end(a)
for (mypoint in kp3:nmkm3) {
a<-table.row.start(a)
a<-table.element(a,mypoint,header=TRUE)
a<-table.element(a,gqarr[mypoint-kp3+1,1])
a<-table.element(a,gqarr[mypoint-kp3+1,2])
a<-table.element(a,gqarr[mypoint-kp3+1,3])
a<-table.row.end(a)
}
a<-table.end(a)
table.save(a,file='mytable5.tab')
a<-table.start()
a<-table.row.start(a)
a<-table.element(a,'Meta Analysis of Goldfeld-Quandt test for Heteroskedasticity',4,TRUE)
a<-table.row.end(a)
a<-table.row.start(a)
a<-table.element(a,'Description',header=TRUE)
a<-table.element(a,'# significant tests',header=TRUE)
a<-table.element(a,'% significant tests',header=TRUE)
a<-table.element(a,'OK/NOK',header=TRUE)
a<-table.row.end(a)
a<-table.row.start(a)
a<-table.element(a,'1% type I error level',header=TRUE)
a<-table.element(a,numsignificant1)
a<-table.element(a,numsignificant1/numgqtests)
if (numsignificant1/numgqtests < 0.01) dum <- 'OK' else dum <- 'NOK'
a<-table.element(a,dum)
a<-table.row.end(a)
a<-table.row.start(a)
a<-table.element(a,'5% type I error level',header=TRUE)
a<-table.element(a,numsignificant5)
a<-table.element(a,numsignificant5/numgqtests)
if (numsignificant5/numgqtests < 0.05) dum <- 'OK' else dum <- 'NOK'
a<-table.element(a,dum)
a<-table.row.end(a)
a<-table.row.start(a)
a<-table.element(a,'10% type I error level',header=TRUE)
a<-table.element(a,numsignificant10)
a<-table.element(a,numsignificant10/numgqtests)
if (numsignificant10/numgqtests < 0.1) dum <- 'OK' else dum <- 'NOK'
a<-table.element(a,dum)
a<-table.row.end(a)
a<-table.end(a)
table.save(a,file='mytable6.tab')
}