| Multiple Linear Regression - Estimated Regression Equation |
| Y[t] = + 95.719020908 + 24.90158083X[t] + e[t] |
| Multiple Linear Regression - Ordinary Least Squares | |||||
| Variable | Parameter | S.D. | T-STAT H0: parameter = 0 | 2-tail p-value | 1-tail p-value |
| (Intercept) | 95.719020908 | 4.121432 | 23.2247 | 0 | 0 |
| X | 24.90158083 | 4.514803 | 5.5155 | 1e-06 | 0 |
| Multiple Linear Regression - Regression Statistics | |
| Multiple R | 0.586556645237301 |
| R-squared | 0.344048698072037 |
| Adjusted R-squared | 0.332739192866383 |
| F-TEST (value) | 30.4211980821247 |
| F-TEST (DF numerator) | 1 |
| F-TEST (DF denominator) | 58 |
| p-value | 8.44200816363383e-07 |
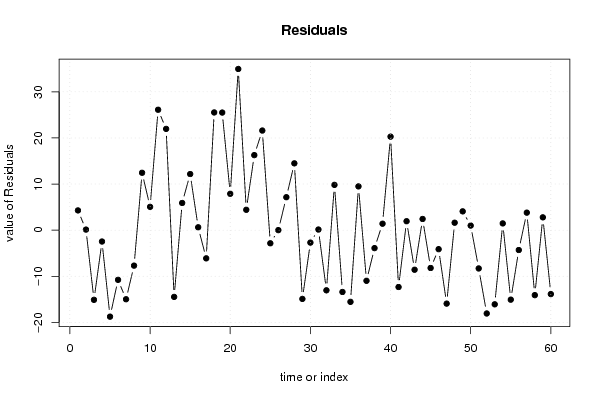
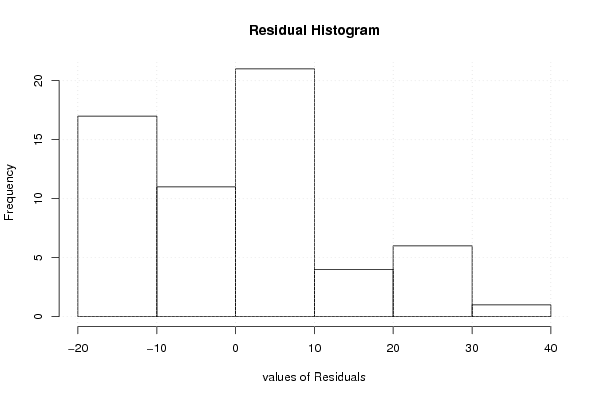
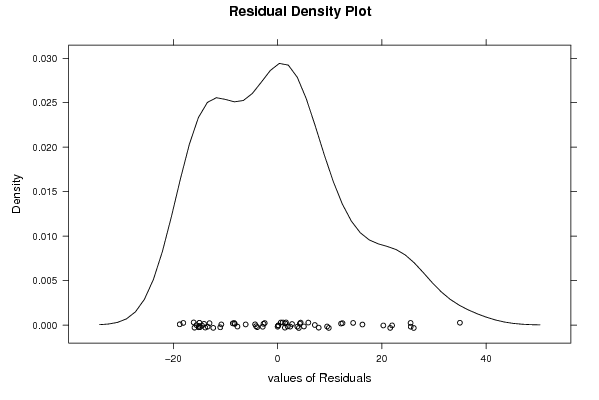
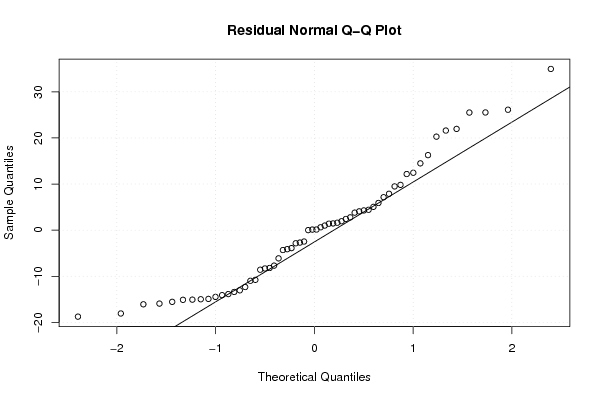
| Multiple Linear Regression - Residual Statistics | |
| Residual Standard Deviation | 13.0331123291101 |
| Sum Squared Residuals | 9851.99698502568 |
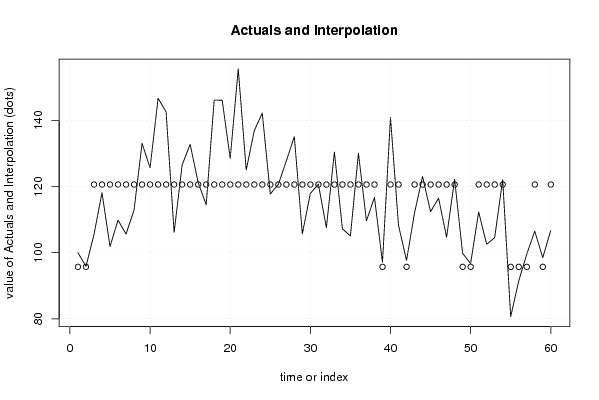
| Multiple Linear Regression - Actuals, Interpolation, and Residuals | |||
| Time or Index | Actuals | Interpolation Forecast | Residuals Prediction Error |
| 1 | 100 | 95.7190209080002 | 4.28097909199981 |
| 2 | 95.84395716 | 95.719020908 | 0.124936252000047 |
| 3 | 105.5073942 | 120.620601738 | -15.113207538 |
| 4 | 118.1540031 | 120.620601738 | -2.466598638 |
| 5 | 101.8612953 | 120.620601738 | -18.759306438 |
| 6 | 109.8419174 | 120.620601738 | -10.778684338 |
| 7 | 105.6348802 | 120.620601738 | -14.985721538 |
| 8 | 112.927078 | 120.620601738 | -7.693523738 |
| 9 | 133.0698623 | 120.620601738 | 12.449260562 |
| 10 | 125.6756757 | 120.620601738 | 5.055073962 |
| 11 | 146.736359 | 120.620601738 | 26.115757262 |
| 12 | 142.5803162 | 120.620601738 | 21.959714462 |
| 13 | 106.1448241 | 120.620601738 | -14.475777638 |
| 14 | 126.5170831 | 120.620601738 | 5.896481362 |
| 15 | 132.7893932 | 120.620601738 | 12.168791462 |
| 16 | 121.2391637 | 120.620601738 | 0.618561962000007 |
| 17 | 114.5079041 | 120.620601738 | -6.112697638 |
| 18 | 146.1499235 | 120.620601738 | 25.529321762 |
| 19 | 146.1244263 | 120.620601738 | 25.503824562 |
| 20 | 128.5058644 | 120.620601738 | 7.88526266200001 |
| 21 | 155.5838858 | 120.620601738 | 34.963284062 |
| 22 | 125.0382458 | 120.620601738 | 4.417644062 |
| 23 | 136.8944416 | 120.620601738 | 16.273839862 |
| 24 | 142.2233554 | 120.620601738 | 21.602753662 |
| 25 | 117.7715451 | 120.620601738 | -2.849056638 |
| 26 | 120.627231 | 120.620601738 | 0.00662926199999536 |
| 27 | 127.7664457 | 120.620601738 | 7.145843962 |
| 28 | 135.1096379 | 120.620601738 | 14.489036162 |
| 29 | 105.7113717 | 120.620601738 | -14.909230038 |
| 30 | 117.9245283 | 120.620601738 | -2.69607343799999 |
| 31 | 120.754717 | 120.620601738 | 0.134115262 |
| 32 | 107.572667 | 120.620601738 | -13.047934738 |
| 33 | 130.4436512 | 120.620601738 | 9.823049462 |
| 34 | 107.2157063 | 120.620601738 | -13.404895438 |
| 35 | 105.0739419 | 120.620601738 | -15.546659838 |
| 36 | 130.1121877 | 120.620601738 | 9.491585962 |
| 37 | 109.6379398 | 120.620601738 | -10.982661938 |
| 38 | 116.7261601 | 120.620601738 | -3.894441638 |
| 39 | 97.11881693 | 95.719020908 | 1.39979602200002 |
| 40 | 140.8975013 | 120.620601738 | 20.276899562 |
| 41 | 108.2865885 | 120.620601738 | -12.334013238 |
| 42 | 97.65425803 | 95.719020908 | 1.93523712200002 |
| 43 | 112.0346762 | 120.620601738 | -8.585925538 |
| 44 | 123.0494646 | 120.620601738 | 2.42886286199999 |
| 45 | 112.4171341 | 120.620601738 | -8.203467638 |
| 46 | 116.4966854 | 120.620601738 | -4.12391633800000 |
| 47 | 104.6914839 | 120.620601738 | -15.929117838 |
| 48 | 122.2335543 | 120.620601738 | 1.61295256199999 |
| 49 | 99.79602244 | 95.719020908 | 4.07700153200002 |
| 50 | 96.71086181 | 95.719020908 | 0.991840902000019 |
| 51 | 112.3151453 | 120.620601738 | -8.305456438 |
| 52 | 102.5497195 | 120.620601738 | -18.070882238 |
| 53 | 104.5385008 | 120.620601738 | -16.082100938 |
| 54 | 122.0805711 | 120.620601738 | 1.459969362 |
| 55 | 80.64762876 | 95.719020908 | -15.0713921480000 |
| 56 | 91.40744518 | 95.719020908 | -4.31157572799998 |
| 57 | 99.51555329 | 95.719020908 | 3.79653238200002 |
| 58 | 106.527282 | 120.620601738 | -14.093319738 |
| 59 | 98.49566548 | 95.719020908 | 2.77664457200002 |
| 60 | 106.7567568 | 120.620601738 | -13.863844938 |
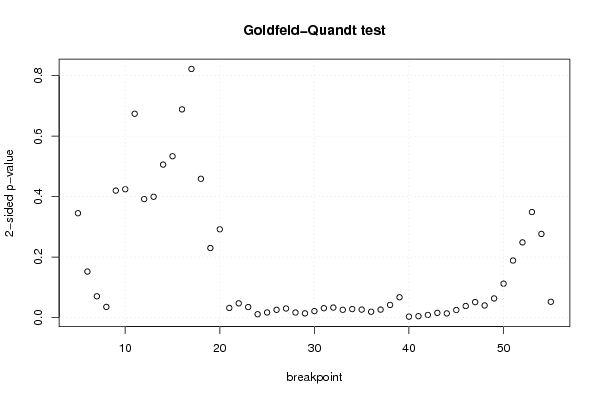
| Goldfeld-Quandt test for Heteroskedasticity | |||
| p-values | Alternative Hypothesis | ||
| breakpoint index | greater | 2-sided | less |
| 5 | 0.172494572865695 | 0.344989145731389 | 0.827505427134305 |
| 6 | 0.0759793224350185 | 0.151958644870037 | 0.924020677564982 |
| 7 | 0.0350141225478943 | 0.0700282450957886 | 0.964985877452106 |
| 8 | 0.0175147177012565 | 0.0350294354025130 | 0.982485282298744 |
| 9 | 0.209923545148888 | 0.419847090297776 | 0.790076454851112 |
| 10 | 0.212192623387086 | 0.424385246774172 | 0.787807376612914 |
| 11 | 0.662915866309032 | 0.674168267381937 | 0.337084133690968 |
| 12 | 0.80405798195987 | 0.39188403608026 | 0.19594201804013 |
| 13 | 0.800252586055609 | 0.399494827888783 | 0.199747413944391 |
| 14 | 0.747031074559512 | 0.505937850880976 | 0.252968925440488 |
| 15 | 0.733187844037614 | 0.533624311924771 | 0.266812155962386 |
| 16 | 0.655667074539865 | 0.688665850920271 | 0.344332925460135 |
| 17 | 0.588779337660166 | 0.822441324679668 | 0.411220662339834 |
| 18 | 0.770536543573984 | 0.458926912852032 | 0.229463456426016 |
| 19 | 0.8850700957312 | 0.229859808537599 | 0.114929904268800 |
| 20 | 0.854098692495133 | 0.291802615009734 | 0.145901307504867 |
| 21 | 0.98421475450615 | 0.0315704909877004 | 0.0157852454938502 |
| 22 | 0.976559257118094 | 0.0468814857638117 | 0.0234407428819058 |
| 23 | 0.982727875193071 | 0.0345442496138578 | 0.0172721248069289 |
| 24 | 0.994622451625736 | 0.0107550967485285 | 0.00537754837426423 |
| 25 | 0.991700106948005 | 0.0165997861039899 | 0.00829989305199493 |
| 26 | 0.98731389684736 | 0.0253722063052812 | 0.0126861031526406 |
| 27 | 0.985109400672976 | 0.0297811986540479 | 0.0148905993270239 |
| 28 | 0.99182106330841 | 0.0163578733831799 | 0.00817893669158996 |
| 29 | 0.993200336149386 | 0.0135993277012287 | 0.00679966385061434 |
| 30 | 0.989479821818272 | 0.0210403563634555 | 0.0105201781817277 |
| 31 | 0.984627124283753 | 0.0307457514324936 | 0.0153728757162468 |
| 32 | 0.983595919160337 | 0.0328081616793271 | 0.0164040808396635 |
| 33 | 0.987283734795684 | 0.025432530408632 | 0.012716265204316 |
| 34 | 0.986068645033735 | 0.0278627099325306 | 0.0139313549662653 |
| 35 | 0.98695812686009 | 0.0260837462798179 | 0.0130418731399090 |
| 36 | 0.990540551226712 | 0.0189188975465755 | 0.00945944877328774 |
| 37 | 0.986993549206755 | 0.0260129015864907 | 0.0130064507932454 |
| 38 | 0.979267173224647 | 0.0414656535507051 | 0.0207328267753525 |
| 39 | 0.966526502468418 | 0.0669469950631639 | 0.0334734975315819 |
| 40 | 0.998635882141512 | 0.00272823571697702 | 0.00136411785848851 |
| 41 | 0.99783655414891 | 0.00432689170217786 | 0.00216344585108893 |
| 42 | 0.995820148255026 | 0.00835970348994875 | 0.00417985174497438 |
| 43 | 0.992386014074165 | 0.0152279718516698 | 0.00761398592583492 |
| 44 | 0.993277297669074 | 0.0134454046618525 | 0.00672270233092624 |
| 45 | 0.987672547366773 | 0.0246549052664544 | 0.0123274526332272 |
| 46 | 0.98108319090483 | 0.0378336181903392 | 0.0189168090951696 |
| 47 | 0.974617112158329 | 0.0507657756833426 | 0.0253828878416713 |
| 48 | 0.980097681978675 | 0.0398046360426499 | 0.0199023180213250 |
| 49 | 0.968493585570161 | 0.0630128288596774 | 0.0315064144298387 |
| 50 | 0.94407573960176 | 0.111848520796479 | 0.0559242603982395 |
| 51 | 0.905764106300282 | 0.188471787399435 | 0.0942358936997177 |
| 52 | 0.875749667727708 | 0.248500664544584 | 0.124250332272292 |
| 53 | 0.825536063190833 | 0.348927873618335 | 0.174463936809167 |
| 54 | 0.861746752465215 | 0.27650649506957 | 0.138253247534785 |
| 55 | 0.97402813120837 | 0.0519437375832583 | 0.0259718687916292 |
| Meta Analysis of Goldfeld-Quandt test for Heteroskedasticity | |||
| Description | # significant tests | % significant tests | OK/NOK |
| 1% type I error level | 3 | 0.0588235294117647 | NOK |
| 5% type I error level | 27 | 0.529411764705882 | NOK |
| 10% type I error level | 32 | 0.627450980392157 | NOK |