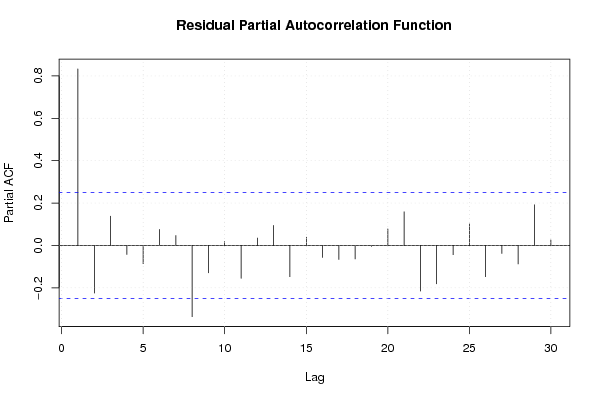
| Multiple Linear Regression - Estimated Regression Equation |
| Y[t] = + 1.39450175395646 + 0.340169624901634X[t] -0.00181850174385351M1[t] -0.00116977140470005M2[t] -0.000997065664072645M3[t] + 0.00121665782596459M4[t] + 0.00606970281639524M5[t] + 0.00892274780682585M6[t] + 0.00641511429764998M7[t] + 0.000546802288867615M8[t] + 0.00476052577890482M9[t] -0.000427446980074374M10[t] + 0.00046661575976609M11[t] + 0.00378627650996281t + e[t] |
| Multiple Linear Regression - Ordinary Least Squares | |||||
| Variable | Parameter | S.D. | T-STAT H0: parameter = 0 | 2-tail p-value | 1-tail p-value |
| (Intercept) | 1.39450175395646 | 0.016644 | 83.7832 | 0 | 0 |
| X | 0.340169624901634 | 0.032204 | 10.5629 | 0 | 0 |
| M1 | -0.00181850174385351 | 0.009256 | -0.1965 | 0.845088 | 0.422544 |
| M2 | -0.00116977140470005 | 0.009721 | -0.1203 | 0.904728 | 0.452364 |
| M3 | -0.000997065664072645 | 0.009709 | -0.1027 | 0.918639 | 0.459319 |
| M4 | 0.00121665782596459 | 0.009691 | 0.1255 | 0.900624 | 0.450312 |
| M5 | 0.00606970281639524 | 0.00968 | 0.6271 | 0.53365 | 0.266825 |
| M6 | 0.00892274780682585 | 0.00967 | 0.9227 | 0.360862 | 0.180431 |
| M7 | 0.00641511429764998 | 0.009664 | 0.6638 | 0.510057 | 0.255029 |
| M8 | 0.000546802288867615 | 0.009665 | 0.0566 | 0.955123 | 0.477561 |
| M9 | 0.00476052577890482 | 0.009654 | 0.4931 | 0.624228 | 0.312114 |
| M10 | -0.000427446980074374 | 0.009655 | -0.0443 | 0.964875 | 0.482438 |
| M11 | 0.00046661575976609 | 0.009647 | 0.0484 | 0.961626 | 0.480813 |
| t | 0.00378627650996281 | 0.000217 | 17.433 | 0 | 0 |
| Multiple Linear Regression - Regression Statistics | |
| Multiple R | 0.991688932549206 |
| R-squared | 0.983446938940583 |
| Adjusted R-squared | 0.978868432690106 |
| F-TEST (value) | 214.796460928308 |
| F-TEST (DF numerator) | 13 |
| F-TEST (DF denominator) | 47 |
| p-value | 0 |
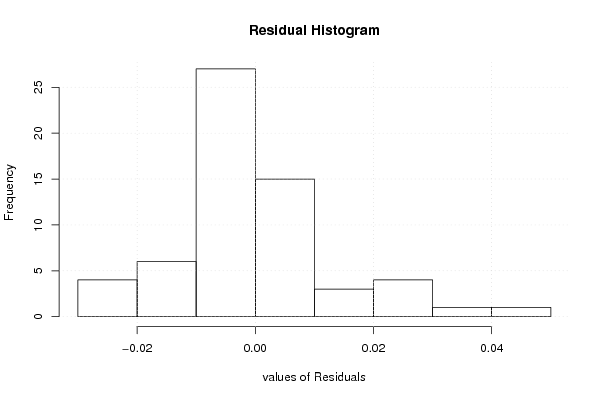
| Multiple Linear Regression - Residual Statistics | |
| Residual Standard Deviation | 0.0152504234527843 |
| Sum Squared Residuals | 0.0109310445279940 |
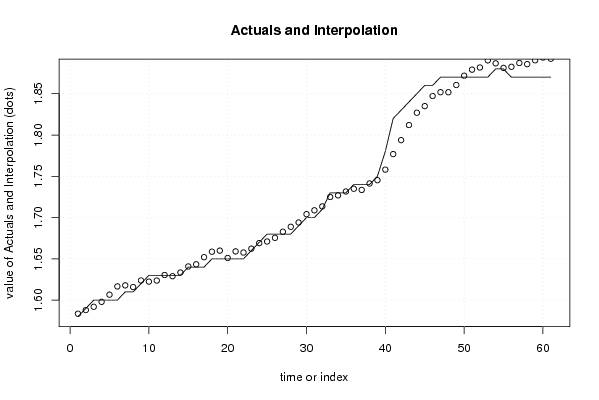
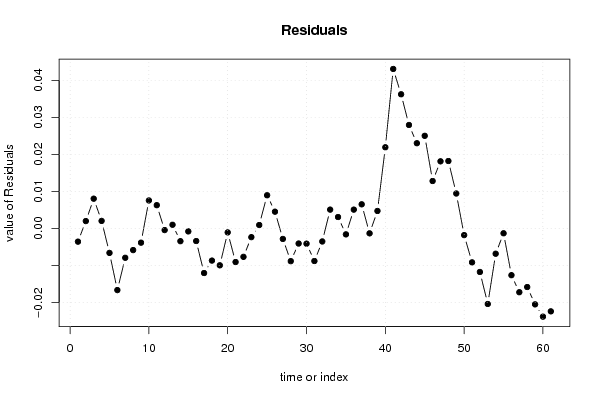
| Multiple Linear Regression - Actuals, Interpolation, and Residuals | |||
| Time or Index | Actuals | Interpolation Forecast | Residuals Prediction Error |
| 1 | 1.58 | 1.58356282241847 | -0.00356282241847002 |
| 2 | 1.59 | 1.58799782926758 | 0.00200217073241852 |
| 3 | 1.6 | 1.59195681151817 | 0.00804318848182836 |
| 4 | 1.6 | 1.59795681151817 | 0.00204318848182837 |
| 5 | 1.6 | 1.60659613301857 | -0.00659613301856506 |
| 6 | 1.6 | 1.61663715076798 | -0.0166371507679749 |
| 7 | 1.61 | 1.61791579376876 | -0.00791579376876178 |
| 8 | 1.61 | 1.61583375826994 | -0.00583375826994225 |
| 9 | 1.62 | 1.62383375826994 | -0.00383375826994223 |
| 10 | 1.63 | 1.62243206202093 | 0.00756793797907393 |
| 11 | 1.63 | 1.62371070502171 | 0.006289294978287 |
| 12 | 1.63 | 1.63043206202093 | -0.000432062020926052 |
| 13 | 1.63 | 1.62899814053802 | 0.00100185946198101 |
| 14 | 1.63 | 1.63343314738714 | -0.00343314738713537 |
| 15 | 1.64 | 1.64079382588674 | -0.000793825886741844 |
| 16 | 1.64 | 1.64339212963773 | -0.0033921296377255 |
| 17 | 1.64 | 1.65203145113812 | -0.0120314511381190 |
| 18 | 1.65 | 1.65867077263851 | -0.00867077263851238 |
| 19 | 1.65 | 1.6599494156393 | -0.00994941563929933 |
| 20 | 1.65 | 1.65106398764245 | -0.00106398764244708 |
| 21 | 1.65 | 1.65906398764245 | -0.0090639876424471 |
| 22 | 1.65 | 1.65766229139343 | -0.00766229139343073 |
| 23 | 1.66 | 1.66234263064323 | -0.00234263064323399 |
| 24 | 1.67 | 1.66906398764245 | 0.000936012357552973 |
| 25 | 1.68 | 1.67103176240856 | 0.0089682375914437 |
| 26 | 1.68 | 1.67546676925767 | 0.00453323074232744 |
| 27 | 1.68 | 1.68282744775728 | -0.00282744775727914 |
| 28 | 1.68 | 1.68882744775728 | -0.00882744775727915 |
| 29 | 1.69 | 1.69406507300866 | -0.00406507300865628 |
| 30 | 1.7 | 1.70410609075807 | -0.00410609075806603 |
| 31 | 1.7 | 1.70878643000787 | -0.00878643000786932 |
| 32 | 1.71 | 1.71350778700708 | -0.0035077870070824 |
| 33 | 1.73 | 1.7249094832561 | 0.00509051674390125 |
| 34 | 1.73 | 1.7269094832561 | 0.00309051674390130 |
| 35 | 1.73 | 1.73158982250590 | -0.00158982250590198 |
| 36 | 1.74 | 1.73490948325610 | 0.0050905167439013 |
| 37 | 1.74 | 1.73347556177319 | 0.00652443822680838 |
| 38 | 1.74 | 1.74131226487132 | -0.00131226487132422 |
| 39 | 1.75 | 1.74527124712191 | 0.00472875287808552 |
| 40 | 1.78 | 1.75807463961995 | 0.0219253603800528 |
| 41 | 1.82 | 1.77691904986739 | 0.0430809501326104 |
| 42 | 1.83 | 1.79376346011483 | 0.0362365398851679 |
| 43 | 1.84 | 1.8120505843607 | 0.0279494156392993 |
| 44 | 1.85 | 1.82697703010696 | 0.0230229698930372 |
| 45 | 1.86 | 1.83497703010696 | 0.0250229698930372 |
| 46 | 1.86 | 1.84718211885401 | 0.0128178811459882 |
| 47 | 1.87 | 1.85186245810382 | 0.018137541896185 |
| 48 | 1.87 | 1.85178042260500 | 0.0182195773950046 |
| 49 | 1.87 | 1.86055158986914 | 0.00944841013086265 |
| 50 | 1.87 | 1.87178998921629 | -0.00178998921628635 |
| 51 | 1.87 | 1.87915066771589 | -0.0091506677158929 |
| 52 | 1.87 | 1.88174897146688 | -0.0117489714668766 |
| 53 | 1.87 | 1.89038829296727 | -0.0203882929672701 |
| 54 | 1.88 | 1.88682252572061 | -0.00682252572061463 |
| 55 | 1.88 | 1.88129777622337 | -0.00129777622336891 |
| 56 | 1.87 | 1.88261743697357 | -0.0126174369735655 |
| 57 | 1.87 | 1.88721574072455 | -0.0172157407245491 |
| 58 | 1.87 | 1.88581404447553 | -0.0158140444755328 |
| 59 | 1.87 | 1.89049438372534 | -0.020494383725336 |
| 60 | 1.87 | 1.89381404447553 | -0.0238140444755328 |
| 61 | 1.87 | 1.89238012299263 | -0.0223801229926257 |
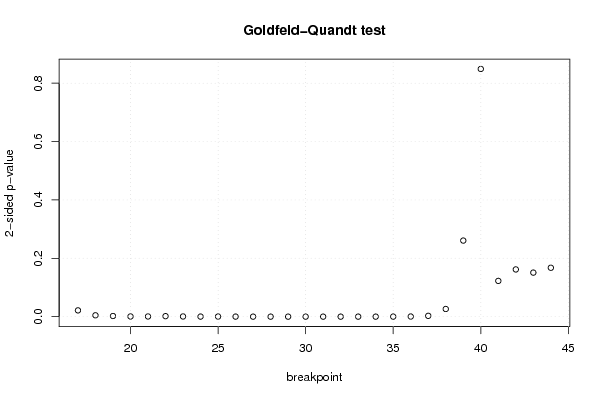
| Goldfeld-Quandt test for Heteroskedasticity | |||
| p-values | Alternative Hypothesis | ||
| breakpoint index | greater | 2-sided | less |
| 17 | 0.0107572451556727 | 0.0215144903113454 | 0.989242754844327 |
| 18 | 0.00232876214262528 | 0.00465752428525056 | 0.997671237857375 |
| 19 | 0.00111595958248040 | 0.00223191916496081 | 0.99888404041752 |
| 20 | 0.000344716013824551 | 0.000689432027649102 | 0.999655283986175 |
| 21 | 0.000351945495430277 | 0.000703890990860554 | 0.99964805450457 |
| 22 | 0.000857114192365567 | 0.00171422838473113 | 0.999142885807634 |
| 23 | 0.000319941549088036 | 0.000639883098176072 | 0.999680058450912 |
| 24 | 0.000118062792663675 | 0.000236125585327349 | 0.999881937207336 |
| 25 | 0.000200407713899102 | 0.000400815427798204 | 0.9997995922861 |
| 26 | 8.08745333451187e-05 | 0.000161749066690237 | 0.999919125466655 |
| 27 | 3.47444651721434e-05 | 6.94889303442868e-05 | 0.999965255534828 |
| 28 | 2.18048072190983e-05 | 4.36096144381967e-05 | 0.999978195192781 |
| 29 | 1.54315079395946e-05 | 3.08630158791891e-05 | 0.99998456849206 |
| 30 | 2.27202331958586e-05 | 4.54404663917173e-05 | 0.999977279766804 |
| 31 | 3.12256941957e-05 | 6.24513883914e-05 | 0.999968774305804 |
| 32 | 2.67514855442952e-05 | 5.35029710885903e-05 | 0.999973248514456 |
| 33 | 3.22906662037787e-05 | 6.45813324075575e-05 | 0.999967709333796 |
| 34 | 2.42471905199030e-05 | 4.84943810398061e-05 | 0.99997575280948 |
| 35 | 8.57138946197005e-05 | 0.000171427789239401 | 0.99991428610538 |
| 36 | 0.000232696389757752 | 0.000465392779515505 | 0.999767303610242 |
| 37 | 0.00140192166101792 | 0.00280384332203584 | 0.998598078338982 |
| 38 | 0.0131415453567058 | 0.0262830907134115 | 0.986858454643294 |
| 39 | 0.130373177180816 | 0.260746354361632 | 0.869626822819184 |
| 40 | 0.575573062400501 | 0.848853875198998 | 0.424426937599499 |
| 41 | 0.938723276945066 | 0.122553446109868 | 0.061276723054934 |
| 42 | 0.91909588973759 | 0.161808220524820 | 0.0809041102624099 |
| 43 | 0.924529336222913 | 0.150941327554174 | 0.0754706637770872 |
| 44 | 0.9162073045724 | 0.167585390855200 | 0.0837926954276002 |
| Meta Analysis of Goldfeld-Quandt test for Heteroskedasticity | |||
| Description | # significant tests | % significant tests | OK/NOK |
| 1% type I error level | 20 | 0.714285714285714 | NOK |
| 5% type I error level | 22 | 0.785714285714286 | NOK |
| 10% type I error level | 22 | 0.785714285714286 | NOK |