| Multiple Linear Regression - Estimated Regression Equation |
| Y[t] = + 8.02708333333333 -1.13541666666667X[t] + 0.259999999999997M1[t] + 0.220000000000001M2[t] + 0.18M3[t] + 0.0999999999999998M4[t] + 0.12M5[t] + 0.0799999999999999M6[t] + 0.16M7[t] + 0.18M8[t] + 0.1M9[t] + 0.0399999999999998M10[t] -0.0399999999999999M11[t] + e[t] |
| Multiple Linear Regression - Ordinary Least Squares | |||||
| Variable | Parameter | S.D. | T-STAT H0: parameter = 0 | 2-tail p-value | 1-tail p-value |
| (Intercept) | 8.02708333333333 | 0.234435 | 34.2401 | 0 | 0 |
| X | -1.13541666666667 | 0.167454 | -6.7805 | 0 | 0 |
| M1 | 0.259999999999997 | 0.328141 | 0.7923 | 0.432142 | 0.216071 |
| M2 | 0.220000000000001 | 0.328141 | 0.6704 | 0.505856 | 0.252928 |
| M3 | 0.18 | 0.328141 | 0.5485 | 0.585914 | 0.292957 |
| M4 | 0.0999999999999998 | 0.328141 | 0.3047 | 0.761904 | 0.380952 |
| M5 | 0.12 | 0.328141 | 0.3657 | 0.716232 | 0.358116 |
| M6 | 0.0799999999999999 | 0.328141 | 0.2438 | 0.808448 | 0.404224 |
| M7 | 0.16 | 0.328141 | 0.4876 | 0.628103 | 0.314051 |
| M8 | 0.18 | 0.328141 | 0.5485 | 0.585914 | 0.292957 |
| M9 | 0.1 | 0.328141 | 0.3047 | 0.761904 | 0.380952 |
| M10 | 0.0399999999999998 | 0.328141 | 0.1219 | 0.903499 | 0.451749 |
| M11 | -0.0399999999999999 | 0.328141 | -0.1219 | 0.903499 | 0.451749 |
| Multiple Linear Regression - Regression Statistics | |
| Multiple R | 0.709316796716717 |
| R-squared | 0.503130318104464 |
| Adjusted R-squared | 0.37626997379071 |
| F-TEST (value) | 3.96601728322691 |
| F-TEST (DF numerator) | 12 |
| F-TEST (DF denominator) | 47 |
| p-value | 0.000313507766686705 |
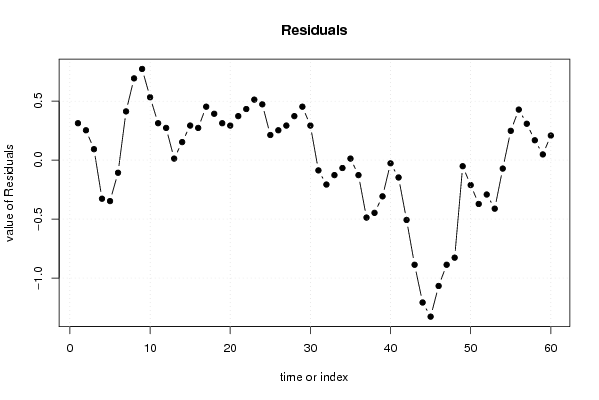
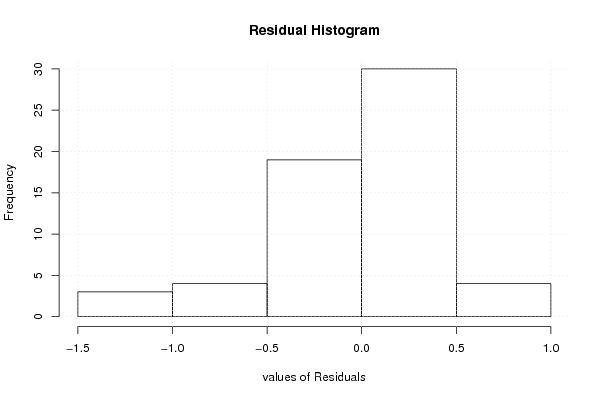
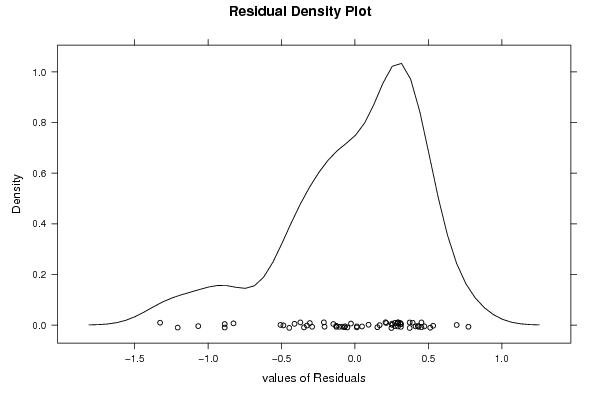
| Multiple Linear Regression - Residual Statistics | |
| Residual Standard Deviation | 0.518835814913426 |
| Sum Squared Residuals | 12.6519583333333 |
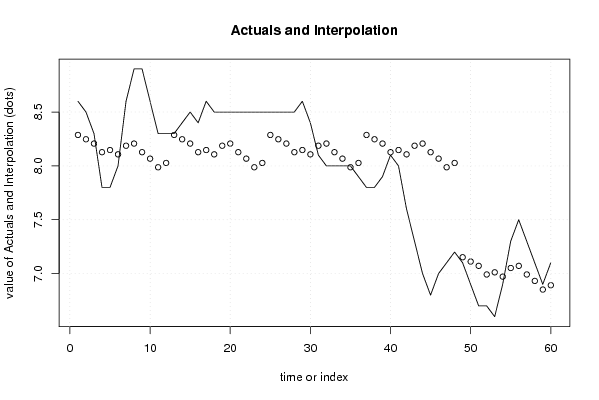
| Multiple Linear Regression - Actuals, Interpolation, and Residuals | |||
| Time or Index | Actuals | Interpolation Forecast | Residuals Prediction Error |
| 1 | 8.6 | 8.28708333333335 | 0.312916666666653 |
| 2 | 8.5 | 8.24708333333333 | 0.252916666666669 |
| 3 | 8.3 | 8.20708333333333 | 0.0929166666666671 |
| 4 | 7.8 | 8.12708333333333 | -0.327083333333333 |
| 5 | 7.8 | 8.14708333333333 | -0.347083333333333 |
| 6 | 8 | 8.10708333333333 | -0.107083333333333 |
| 7 | 8.6 | 8.18708333333333 | 0.412916666666667 |
| 8 | 8.9 | 8.20708333333333 | 0.692916666666668 |
| 9 | 8.9 | 8.12708333333333 | 0.772916666666667 |
| 10 | 8.6 | 8.06708333333333 | 0.532916666666666 |
| 11 | 8.3 | 7.98708333333333 | 0.312916666666667 |
| 12 | 8.3 | 8.02708333333333 | 0.272916666666667 |
| 13 | 8.3 | 8.28708333333333 | 0.0129166666666705 |
| 14 | 8.4 | 8.24708333333333 | 0.152916666666666 |
| 15 | 8.5 | 8.20708333333333 | 0.292916666666666 |
| 16 | 8.4 | 8.12708333333333 | 0.272916666666667 |
| 17 | 8.6 | 8.14708333333333 | 0.452916666666666 |
| 18 | 8.5 | 8.10708333333333 | 0.392916666666667 |
| 19 | 8.5 | 8.18708333333333 | 0.312916666666667 |
| 20 | 8.5 | 8.20708333333333 | 0.292916666666667 |
| 21 | 8.5 | 8.12708333333333 | 0.372916666666667 |
| 22 | 8.5 | 8.06708333333333 | 0.432916666666667 |
| 23 | 8.5 | 7.98708333333333 | 0.512916666666667 |
| 24 | 8.5 | 8.02708333333333 | 0.472916666666667 |
| 25 | 8.5 | 8.28708333333333 | 0.21291666666667 |
| 26 | 8.5 | 8.24708333333333 | 0.252916666666666 |
| 27 | 8.5 | 8.20708333333333 | 0.292916666666666 |
| 28 | 8.5 | 8.12708333333333 | 0.372916666666667 |
| 29 | 8.6 | 8.14708333333333 | 0.452916666666666 |
| 30 | 8.4 | 8.10708333333333 | 0.292916666666667 |
| 31 | 8.1 | 8.18708333333333 | -0.0870833333333334 |
| 32 | 8 | 8.20708333333333 | -0.207083333333333 |
| 33 | 8 | 8.12708333333333 | -0.127083333333333 |
| 34 | 8 | 8.06708333333333 | -0.0670833333333332 |
| 35 | 8 | 7.98708333333333 | 0.0129166666666665 |
| 36 | 7.9 | 8.02708333333333 | -0.127083333333333 |
| 37 | 7.8 | 8.28708333333333 | -0.48708333333333 |
| 38 | 7.8 | 8.24708333333333 | -0.447083333333334 |
| 39 | 7.9 | 8.20708333333333 | -0.307083333333333 |
| 40 | 8.1 | 8.12708333333333 | -0.0270833333333337 |
| 41 | 8 | 8.14708333333333 | -0.147083333333333 |
| 42 | 7.6 | 8.10708333333333 | -0.507083333333334 |
| 43 | 7.3 | 8.18708333333333 | -0.887083333333333 |
| 44 | 7 | 8.20708333333333 | -1.20708333333333 |
| 45 | 6.8 | 8.12708333333333 | -1.32708333333333 |
| 46 | 7 | 8.06708333333333 | -1.06708333333333 |
| 47 | 7.1 | 7.98708333333333 | -0.887083333333334 |
| 48 | 7.2 | 8.02708333333333 | -0.827083333333333 |
| 49 | 7.1 | 7.15166666666666 | -0.051666666666664 |
| 50 | 6.9 | 7.11166666666667 | -0.211666666666667 |
| 51 | 6.7 | 7.07166666666667 | -0.371666666666667 |
| 52 | 6.7 | 6.99166666666667 | -0.291666666666667 |
| 53 | 6.6 | 7.01166666666667 | -0.411666666666667 |
| 54 | 6.9 | 6.97166666666667 | -0.0716666666666665 |
| 55 | 7.3 | 7.05166666666667 | 0.248333333333333 |
| 56 | 7.5 | 7.07166666666667 | 0.428333333333333 |
| 57 | 7.3 | 6.99166666666667 | 0.308333333333333 |
| 58 | 7.1 | 6.93166666666667 | 0.168333333333333 |
| 59 | 6.9 | 6.85166666666667 | 0.0483333333333333 |
| 60 | 7.1 | 6.89166666666667 | 0.208333333333333 |
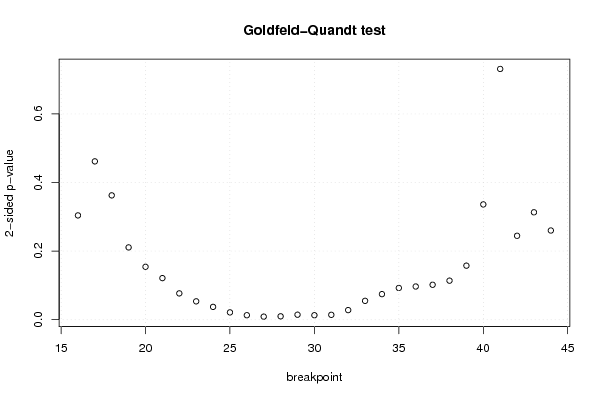
| Goldfeld-Quandt test for Heteroskedasticity | |||
| p-values | Alternative Hypothesis | ||
| breakpoint index | greater | 2-sided | less |
| 16 | 0.152018031571261 | 0.304036063142523 | 0.847981968428739 |
| 17 | 0.230788219019074 | 0.461576438038149 | 0.769211780980926 |
| 18 | 0.181243436813180 | 0.362486873626359 | 0.81875656318682 |
| 19 | 0.105369833305929 | 0.210739666611857 | 0.894630166694071 |
| 20 | 0.0771174828396537 | 0.154234965679307 | 0.922882517160346 |
| 21 | 0.0606001696887962 | 0.121200339377592 | 0.939399830311204 |
| 22 | 0.0383549250736142 | 0.0767098501472284 | 0.961645074926386 |
| 23 | 0.0267775826575941 | 0.0535551653151882 | 0.973222417342406 |
| 24 | 0.0186772322236841 | 0.0373544644473683 | 0.981322767776316 |
| 25 | 0.0106632082864103 | 0.0213264165728205 | 0.98933679171359 |
| 26 | 0.00652882284021741 | 0.0130576456804348 | 0.993471177159783 |
| 27 | 0.00444200267448736 | 0.00888400534897472 | 0.995557997325513 |
| 28 | 0.00492057682153077 | 0.00984115364306153 | 0.99507942317847 |
| 29 | 0.00728236690360236 | 0.0145647338072047 | 0.992717633096398 |
| 30 | 0.00651889979392655 | 0.0130377995878531 | 0.993481100206073 |
| 31 | 0.00709090130086208 | 0.0141818026017242 | 0.992909098699138 |
| 32 | 0.014011642477936 | 0.028023284955872 | 0.985988357522064 |
| 33 | 0.0274795912944455 | 0.054959182588891 | 0.972520408705555 |
| 34 | 0.0372981750562411 | 0.0745963501124822 | 0.962701824943759 |
| 35 | 0.0462477476595275 | 0.092495495319055 | 0.953752252340473 |
| 36 | 0.0483811293457619 | 0.0967622586915237 | 0.951618870654238 |
| 37 | 0.050921848212433 | 0.101843696424866 | 0.949078151787567 |
| 38 | 0.05690725395533 | 0.11381450791066 | 0.94309274604467 |
| 39 | 0.0787574776741498 | 0.157514955348300 | 0.92124252232585 |
| 40 | 0.168044457869602 | 0.336088915739204 | 0.831955542130398 |
| 41 | 0.634515865950173 | 0.730968268099655 | 0.365484134049827 |
| 42 | 0.877698865358447 | 0.244602269283106 | 0.122301134641553 |
| 43 | 0.843466168235085 | 0.313067663529829 | 0.156533831764915 |
| 44 | 0.869982635595988 | 0.260034728808023 | 0.130017364404012 |
| Meta Analysis of Goldfeld-Quandt test for Heteroskedasticity | |||
| Description | # significant tests | % significant tests | OK/NOK |
| 1% type I error level | 2 | 0.0689655172413793 | NOK |
| 5% type I error level | 9 | 0.310344827586207 | NOK |
| 10% type I error level | 15 | 0.517241379310345 | NOK |